Homework 2
Assignment:
(Use the following Olympic data for this assignment.)
OLYMPICS
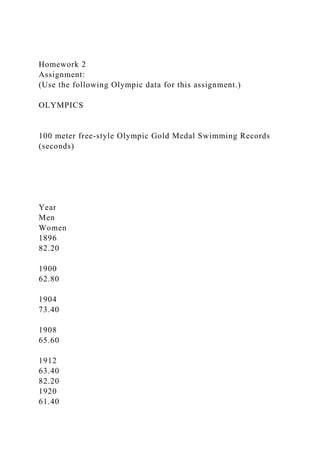
100 meter free-style Olympic Gold Medal Swimming Records (seconds)
Year
Men
Women
1896
82.20
1900
62.80
1904
73.40
1908
65.60
1912
63.40
82.20
1920
61.40
73.60
1924
59.00
72.40
1928
58.60
71.00
1932
58.20
66.80
1936
57.60
65.90
1948
57.30
66.30
1952
57.40
66.80
1956
55.40
62.00
1960
55.20
61.20
1964
53.40
59.50
1968
52.20
60.00
1972
51.11
58.59
1976
49.99
55.65
1980
50.40
54.79
1984
49.80
55.92
1988
48.63
54.93
1992
49.02
54.64
1996
48.74
54.50
2000
48.30
53.83
2004
48.17
53.84
2008
47.21
53.12
Enter the data above in an Excel spreadsheet, place it on the first worksheet and label the worksheet “OlympicData”. Create twoadditional worksheets, labeled “PolyTrend” and “ExpTrend”. On each of those worksheets, create an XY chart from the data to illustrate the information graphically. Ensure that your charts are labeled with a title and legends for the x and y-axis. Use three different ordersof polynomials in creating trend lines on the “PolyTrend” worksheet. On the “ExpTrend worksheet, create an exponential trend line. Remember to make the information look presentable.
Homework 3 ()
Assignment:
You are the plant engineer and the plant manager has asked you to do an analysis of the utility bills and make a presentable report from the information. The data is required to evaluate cost saving improvements you are considering for the plant by improving energy and water usage:
ELECTRIC
Use
Use
Demand
Demand
TOTAL
KWH
$
KW
$
$
JAN
2012
208,120
$6,565
798
$6,464
$13,029
FEB
2012
302,400
$10,121
819
$6,634
$16,755
MAR
2012
273,000
$10,374
756
$6,124
$16,498
APR
2012
193,200
$8,767
651
$5,273
$14,040
MAY
2012
291,100
$10,377
546
$4,423
$14,800
JUN
2012
391,100
$10,238
525
$4,262
$14,500
JUL
2012
296,100
$13,575
735
$7,445
$21,020
AUG
2012
407,400
$16,902
798
$8,091
$24,993
SEP
2012
420,000
$18,574
798
$8,025
$26,599
OCT
2012
348,600
$17,613
756
$7,634
$25,247
NOV
2012
199,500
$9,739
588
$4,663
$14,402
DEC
2012
239,400
$10,121
672
$5,269
$15,390
TOTALS
3,569,920
$142,966
8,442
$74,307
$217,273
(Note: the dollar information on this table is set to the dollar value, no cents)
-When you enter this table into your spreadsheet, you will need to enter formulas for the Total $ column (Yellow) and Totals row (Green).
NATURAL GAS
MMBTU
Cost $
$/MMBTU
JAN
2012
189
$1,218.00
$6.44
FEB
2012
215
$1,297.00
$6.03
MAR
2012
71
$412.00
$5.80
APR
2012
18
$142.00
$7.89
MAY
2012
2
$22.00
$11.00
JUN
2012
4
$44.00
$11.00
JUL
2012
3
$44.00
$14.67
AUG
2012
3
$44.00
$14.67
SEP
2012
3
$44.00
$14.67
OCT
2012
58
$601.00
$10.36
NOV
2012
76
$820.00
$10.79
DEC
2012
84
$940.00
$11.19
TOTALS
726
$5,628.00
$7.75
(Note: the dollar information on this table is set to the cents value)
-When you enter this table into your spreadsheet, you will need to enter formulas for the $/MMBTU column (yellow) and Totals row (green).
WATER
SEWAGE
TOTAL
WATER
SEWAGE
Cubic.
Web & Social Media Analytics Previous Year Question Paper.pdf
Homework 2 Assignment(Use the following Olympic data for this.docx
1. Homework 2
Assignment:
(Use the following Olympic data for this assignment.)
OLYMPICS
100 meter free-style Olympic Gold Medal Swimming Records
(seconds)
Year
Men
Women
1896
82.20
1900
62.80
1904
73.40
1908
65.60
1912
63.40
82.20
1920
61.40
3. 55.65
1980
50.40
54.79
1984
49.80
55.92
1988
48.63
54.93
1992
49.02
54.64
1996
48.74
54.50
2000
48.30
53.83
2004
48.17
53.84
2008
47.21
53.12
Enter the data above in an Excel spreadsheet, place it on
the first worksheet and label the worksheet “OlympicData”.
Create twoadditional worksheets, labeled “PolyTrend” and
“ExpTrend”. On each of those worksheets, create an XY chart
from the data to illustrate the information graphically. Ensure
that your charts are labeled with a title and legends for the x
and y-axis. Use three different ordersof polynomials in creating
trend lines on the “PolyTrend” worksheet. On the “ExpTrend
worksheet, create an exponential trend line. Remember to make
the information look presentable.
4. Homework 3 ()
Assignment:
You are the plant engineer and the plant manager has asked you
to do an analysis of the utility bills and make a presentable
report from the information. The data is required to evaluate
cost saving improvements you are considering for the plant by
improving energy and water usage:
ELECTRIC
Use
Use
Demand
Demand
TOTAL
KWH
$
KW
$
$
JAN
2012
208,120
$6,565
798
$6,464
$13,029
FEB
2012
302,400
10. -When you enter this table into your spreadsheet, you will need
to enter formulas for the $/MMBTU column (yellow) and Totals
row (green).
WATER
SEWAGE
TOTAL
WATER
SEWAGE
Cubic
$
$
$
$/CGAL
$/CGAL
Gallons
JAN
2012
374
$59.00
$64.00
$123.00
$0.16
$0.17
14. -When you enter this table into your spreadsheet, you will need
to enter formulas for the Total $ column (yellow), Water
$/CGAL column (light blue), Sewage $/CGAL column (grey),
and Totals row (green).
Enter the three tables above in an Excel spreadsheet, place them
on the first worksheet and label the worksheet Bills. Create
three additional worksheets, labeled Electric, Gas, and Water.
On each of those worksheets, link the related information from
the first worksheet to a table on the appropriately labeled
worksheet and then create a chart to illustrate the information
graphically. Make sure that your charts are labeled with a title
and legends for the x and y-axis. Use three different types of
charts (1 chart for each page). Your goal is to make the
information look presentable.
Homework 4 ()
Assignment:
This exercise consists of a list of tasks for a home yard project.
Working in Microsoft Project, you will create the task list,
including summary tasks and their sub-tasks, create links
between tasks and their predecessors. Set a start date for your
project of February 28, 2014. Enter the following tasks,
including the duration, where specified. Tasks with unspecified
duration are summary tasks and the rest are sub-tasks. When
completed save the file and submit the file via Canvas.
ID: Task List:
Duration: Predecessors:
1 Preparation
2 Get trash bags 5 min
3 Pick up trash 15
min 2
15. 4 Put gas in the equipment 5 min
5 Get the hedge clippers 5 min
6 Do the work
7 Trim weeds 30
min 3,4
8 Mow front yard 45
min 3,4
9 Edge sidewalk 15
min 3,4
10 Trim Hedge 30
min 5
11 Mow back yard 30
min 8
12 Clean up
13 Bag grass 30
min 7,9,10,11
14 Bundle trash 15
min 7,9,10,11
15 Haul trash 45
min 13,14
Saving/Naming Your File:
When you save your file make sure that your name and the
project number are included in it.