SlideShare a Scribd company logo
1 of 13
2.0 Analysis of Number of Units
Item Type Selling Price(RM) Units Blocks Lot size
Buildup
area (sq ft)
A
Double storey Terrace
(intermediate) RM 400,000.00 80 9 22' x 75' 1,500
B D/S Terrace (Corner) RM 650,000.00 6 1,500
C D/S Terrace (End) RM 500,000.00 12 1,500
1. Total of D/S Terrace (A+B+C) 98 9
D
Double storey Shop/office
(intermediate) RM 850,000.00 6 2 26' x 80' 3,600
E D/S Shop/office (Corner) RM1,600,000.00 2 6,500
F D/S Shop/office (End) RM1,000,000.00 2 3,600
2. Total of D/S Shop/office (D+E+F) 10 2
G
Low cost house
(Intermediate) RM 45,000.00 78 6 20' x 60' 900
H LCH (Corner) RM 45,000.00 4
J LCH (End) RM 45,000.00 8
3. Total of Low cost house 90 6
Total amount for (1+2+3) 198
Total amount 198
2.1 FINANCIAL APPRASIAL
2.1.1 Gross Development Value
Type Number of Units Selling Price Value
Double storey Terrace (intermediate) 80 RM 400,000.00 RM32,000,000.00
D/S Terrace (Corner) 6 RM 650,000.00 RM 3,900,000.00
D/S Terrace (End) 12 RM 500,000.00 RM 6,000,000.00
Double storey Shop/office (intermediate) 6 RM 850,000.00 RM 5,100,000.00
D/S Shop/office (Corner) 2 RM 1,600,000.00 RM 3,200,000.00
D/S Shop/office (End) 2 RM 1,000,000.00 RM 2,000,000.00
Low cost house (Intermediate) 78 RM 45,000.00 RM 3,510,000.00
LCH (Corner & End) 12 RM 45,000.00 RM 540,000.00
Gross GDV RM56,250,000.00
Less Bumiputra discount : 7% on 30% of Bumiputra reservation -RM 1,181,250.00
GDV RM55,068,750.00
2.1.2 Gross Development Cost
Item Description RM/SF SF Cost (RM) Total (RM)
1 Land Cost 15.00 449,213 - 6,738,187.50
2 Building Cost
a) Double storey Terrace (intermediate) 75.00 120,000 9,000,000.00
b) D/S Terrace (Corner & End) 85.00 27,000 2,295,000.00
c) Double storey Shop/office (intermediate) 70.00 21,600 1,512,000.00
d) D/S Shop/office (Corner & End) 80.00 20,200 1,616,000.00
e) Low cost house (Intermediate) 35.00 70,200 2,457,000.00
f) LCH (Corner & End) 40.00 10,800 432,000.00
Total Building Cost 17,312,000.00
g) Earth Works (5% of building cost) 5% 865,600.00
h) Infrastructure cost (10% of building cost) 10% 1,731,200.00
Total Construction cost 19,908,800.00
3 Administrative cost
a) Professional fee (9% of construction cost) 9% 1,791,792.00
b) Admistrative fee (2% of GDV) 2% 1,101,375.00
c) Plan fees (RM2000/unit) 2,000.00 396,000.00
d) Contributions & fees (2% of construction cost) 2% 398,176.00
e) Advertisement (1% of GDV) 1% 550,687.50
f) Land conversion
Commercial (20% land value of commercial lots) 20% 125,400.00
Residential (15% land value of residential lots) 15% 513,000.00
g) Subdivision (RM1500/unit) 1,500.00 297,000.00
h) Legal fees (RM2500/unit) 2,500.00 495,000.00
Total Administrative Cost 5,668,430.50
4 Financing Cost
a) Bridging Finance (50% of construction cost
@ 5.5% p.a. + BLR (6.5%) over 2 years) 9,954,400.00 12% 2,389,056.00
b) Interest on Loan for purchase of land
(RM 6,500,000.00 @ 2.5% p.a. 6,500,000.00 9% 2,925,000.00
+ BLR (6.5%) over 5 years
Total Financing Cost 5,314,056.00
5 Contigencies (5% of construction cost) 5% 995,440.00
Gross Development Cost 38,624,914.00
2.2 Cash Flow
Cash Inflow 2013
Item Description % Amount M1 M2 M3 M4 M5 M6 M7 M8 M9 M10 M11 M12
Sales Projection
1 Shop/Office 18.3 10,083,700.00 10% 10% 10%
2 Terrace 74.5 41,020,100.00 30% 20% 20%
3 Low Cost 7.2 3,964,950.00 50%
Monthly Total 100% 55,068,750.00 24.2% 0.0% 0.0% 0.0% 0.0% 16.7% 0.0% 0.0% 20.3% 0.0% 0.0%
% of cumulative sales 24.2% 24.2% 24.2% 24.2% 24.2% 40.9% 40.9% 40.9% 61.2% 61.2% 61.2%
Item Description % Amount M1 M2 M3 M4 M5 M6 M7 M8 M9 M10 M11 M12
1 Earthworks 1 100% 100%
2 Foundation 3 100% 8.1% 8.1% 8.1% 16.7% 20.3%
3 RC Framework 9 100% 2.7% 2.7% 2.7% 5.5% 5.5% 5.5% 12.3% 12.3% 12.3%
4 Walls, Doors & Window Frame 7 100% 5.8% 5.8% 9.9% 9.9% 9.9%
5 Roofing, Elec Wiring & Plumbing 7 100% 8.7% 8.7% 8.7%
6 Internal & External Plastering 8 100% 7.7%
7 Sewerage Works 5 100%
8 Drainage Works 6 100%
9 Road Works 2 100%
10 Infrastructure Works 6 100%
Item Description % Amount M1 M2 M3 M4 M5 M6 M7 M8 M9 M10 M11 M12
Sales Proceed
24.2% 16.7% 20.3%
1 Signing of S&P 10.0% 5,506,875 1,331,440 921,239 1,119,487
100.0%
2 Earthworks 3.9% 2,154,864 2,154,864
8.1% 8.1% 8.1% 16.7% 20.3%
3 Foundation 7.8% 4,309,728 347,332 347,332 347,332 720,970 876,120
2.7% 2.7% 2.7% 5.5% 5.5% 5.5% 12.3% 12.3% 12.3%
4 RC Framework 19.6% 10,774,321 289,443 289,443 289,443 589,848 589,848 589,848 1,319,947 1,319,947 1,319,947
5.8% 5.8% 9.9% 9.9% 9.9%
5 Walls, Doors & Window Frame 11.7% 6,464,592 377,778 377,778 640,614 640,614 640,614
8.7% 8.7% 8.7%
6 Roofing, Elec Wiring & Plumbing 11.7% 6,464,592 565,518 565,518 565,518
7.7%
7 Internal & External Plastering 11.7% 6,464,592 494,829
8 Sewerage Works 3.9% 2,154,864
9 Drainage Works 3.9% 2,154,864
10 Road Works 7.8% 4,309,728
11 Infrastructure Works 7.8% 4,309,728
100% 55,068,750 3,833,636 347,332 636,776 289,443 289,443 2,232,056 967,626 967,626 4,521,687 2,526,080 3,020,909
Q1 Q2 Q3 Q4
2013
2013
Q1 Q2 Q3 Q4
2013
Q1 Q2 Q3 Q4
CashInflow 2014
2015
Q1
Item Description % Amount M1 M2 M3 M4 M5 M6 M7 M8 M9 M10 M11 M12 M1
Sales Projection
1 Shop/Office 18.3 10,083,700.00 10% 10% 20% 30%
2 Terrace 74.5 41,020,100.00 10% 20%
3 LowCost 7.2 3,964,950.00 50%
Monthly Total 100% 55,068,750.00 9.3% 0.0% 0.0% 20.3% 0.0% 0.0% 3.7% 0.0% 0.0% 5.5% 0.0% 0.0% 0
% of cumulative sales 70.5% 70.5% 70.5% 90.8% 90.8% 90.8% 94.5% 94.5% 94.5% 100.0% 100.0% 100.0% 100.0%
2015
Q1
Item Description % Amount M1 M2 M3 M4 M5 M6 M7 M8 M9 M10 M11 M12 M1
1 Earthworks 1 100%
2 Foundation 3 100% 9.3% 20.3% 3.7% 5.5%
3 RC Framework 9 100% 9.3% 20.3% 3.7% 5.5%
4 Walls, Doors & WindowFrame 7 100% 14.5% 14.5% 20.3% 3.7% 5.5%
5 Roofing, Elec Wiring & Plumbing 7 100% 11.1% 11.1% 11.1% 31.4% 3.7% 5.5%
6 Internal& ExternalPlastering 8 100% 9.0% 9.0% 9.0% 14.1% 14.1% 14.1% 17.7% 5.5%
7 Sewerage Works 5 100% 18.9% 18.9% 20.7% 20.7% 20.7%
8 Drainage Works 6 100% 15.1% 15.9% 15.9% 15.9% 18.6% 18.6%
9 Road Works 2 100% 50.0% 50.0%
10 Infrastructure Works 6 100% 15.1% 15.1% 16.1% 16.1% 16.1% 21.5%
2015
Q1
Item Description % Amount M1 M2 M3 M4 M5 M6 M7 M8 M9 M10 M11 M12 M1
Sales Proceed
9.3% 20.3% 3.7% 5.5%
1 Signing of S&P 10.0% 5,506,875 511,038 1,119,487 201,674 302,511
2 Earthworks 3.9% 2,154,864
9.3% 20.3% 3.7% 5.5%
3 Foundation 7.8% 4,309,728 399,943 876,120 157,832 236,748
9.3% 20.3% 3.7% 5.5%
4 RC Framework 19.6% 10,774,321 999,857 2,190,300 394,580 591,869
14.5% 14.5% 20.3% 3.7% 5.5%
5 Walls, Doors & WindowFrame 11.7% 6,464,592 940,572 940,572 1,314,180 236,748 355,122
11.1% 11.1% 11.1% 31.4% 3.7% 5.5%
6 Roofing, Elec Wiring & Plumbing 11.7% 6,464,592 715,497 715,497 715,497 2,029,677 236,748 355,122
9.0% 9.0% 9.0% 14.1% 14.1% 14.1% 17.7% 5.5%
7 Internal& ExternalPlastering 11.7% 6,464,592 580,531 580,531 580,531 909,076 909,076 909,076 1,145,823 355,122
18.9% 18.9% 20.7% 20.7% 20.7%
8 Sewerage Works 3.9% 2,154,864 407,298 407,298 446,756 446,756 446,756
15.1% 15.9% 15.9% 15.9% 18.6% 18.6%
9 Drainage Works 3.9% 2,154,864 326,262 342,046 342,046 342,046 401,233 401,233
50.0% 50.0%
10 Road Works 7.8% 4,309,728 2,154,864 2,154,864
15.1% 15.1% 16.1% 16.1% 16.1% 21.5%
11 Infrastructure Works 7.8% 4,309,728 652,525 652,525 691,983 691,983 691,983 928,730
100% 55,068,750 4,147,437 2,236,599 1,296,028 8,438,838 1,561,600 1,887,863 3,407,433 1,441,326 1,441,326 3,973,212 847,989 2,601,620 2,154,864
2014
Q1 Q2 Q3 Q4
2014
Q1 Q2 Q3 Q4
2014
Q1 Q2 Q3 Q4
Cash Outflow 2013-2014
Item Description Months % Amount M1 M2 M3 M4 M5 M6 M7 M8 M9 M10 M11 M12
Construction Cost
1 Earthworks 1 4.3% 865,600.00 865,600.00
2 Foundation 3 8.7% 1,731,200.00 577,066.67 577,066.67 577,066.67
3 RC Framework 9 21.7% 4,328,000.00 480,888.89 480,888.89 480,888.89 480,888.89 480,888.89 480,888.89 480,888.89 480,888.89 480,888.89
4 Walls, Doors & Window Frame 7 13.0% 2,596,800.00 370,971.43 370,971.43 370,971.43 370,971.43 370,971.43
5 Roofing, Elec Wiring & Plumbing 7 13.0% 2,596,800.00 370,971.43 370,971.43 370,971.43
6 Internal & External Plastering 8 13.0% 2,596,800.00 324,600.00
7 Sewerage Works 5 4.3% 865,600.00
8 Drainage Works 6 4.3% 865,600.00
9 Roadworks 2 8.7% 1,731,200.00
10 Infrastructure Works 6 8.7% 1,731,200.00
TOTAL CONSTRUCTION COST 100.0% 19,908,800.00
Monthly Total Cash Outflow (Before Retention) 1,442,666.67 577,066.67 1,057,955.56 480,888.89 480,888.89 480,888.89 851,860.32 851,860.32 1,222,831.75 1,222,831.75 1,547,431.75
Monthly Cumulative Outflow (Before Retention) 1,442,666.67 2,019,733.33 3,077,688.89 3,558,577.78 4,039,466.67 4,520,355.56 5,372,215.87 6,224,076.19 7,446,907.94 8,669,739.68 10,217,171.43
Less Retention (10%, Limit 5%) (995,440.00) (144,266.67) (57,706.67) (105,795.56) (48,088.89) (48,088.89) (48,088.89) (85,186.03) (85,186.03) (122,283.17) (122,283.17) (128,466.03)
Monthly Cumulative Outflow (After Retention) 1,298,400.00 1,962,026.67 2,971,893.33 3,510,488.89 3,991,377.78 4,472,266.67 5,287,029.84 6,138,890.16 7,324,624.76 8,547,456.51 10,088,705.40
Monthly Total Cash Outflow (After Retention) 18,047,760.00 1,298,400.00 519,360.00 952,160.00 432,800.00 432,800.00 432,800.00 766,674.29 766,674.29 1,100,548.57 1,100,548.57 1,418,965.71
Item Description Months % Amount M1 M2 M3 M4 M5 M6 M7 M8 M9 M10 M11 M12
Construction Cost
1 Earthworks 1 4.3% 865,600.00
2 Foundation 3 8.7% 1,731,200.00
3 RC Framework 9 21.7% 4,328,000.00
4 Walls, Doors & Window Frame 7 13.0% 2,596,800.00 370,971.43 370,971.43
5 Roofing, Elec Wiring & Plumbing 7 13.0% 2,596,800.00 370,971.43 370,971.43 370,971.43 370,971.43
6 Internal & External Plastering 8 13.0% 2,596,800.00 324,600.00 324,600.00 324,600.00 324,600.00 324,600.00 324,600.00 324,600.00
7 Sewerage Works 5 4.3% 865,600.00 173,120.00 173,120.00 173,120.00 173,120.00 173,120.00
8 Drainage Works 6 4.3% 865,600.00 144,266.67 144,266.67 144,266.67 144,266.67 144,266.67 144,266.67
9 Roadworks 2 8.7% 1,731,200.00 865,600.00
10 Infrastructure Works 6 8.7% 1,731,200.00 288,533.33 288,533.33 288,533.33 288,533.33 288,533.33 288,533.33
TOTAL CONSTRUCTION COST 100.0% 19,908,800.00
Monthly Total Cash Outflow (Before Retention) 1,066,542.86 1,066,542.86 695,571.43 695,571.43 613,133.33 757,400.00 757,400.00 605,920.00 605,920.00 605,920.00 317,386.67 1,038,720.00
Monthly Cumulative Outflow (Before Retention) 11,283,714.29 12,350,257.14 13,045,828.57 13,741,400.00 14,354,533.33 15,111,933.33 15,869,333.33 16,475,253.33 17,081,173.33 17,687,093.33 18,004,480.00 19,043,200.00
Less Retention (10%, Limit 5%) (995,440.00)
Monthly Cumulative Outflow (After Retention) 11,283,714.29 12,350,257.14 13,045,828.57 13,741,400.00 14,354,533.33 15,111,933.33 15,869,333.33 16,475,253.33 17,081,173.33 17,687,093.33 18,004,480.00 19,043,200.00
Monthly Total Cash Outflow (After Retention) 18,047,760.00 1,066,542.86 1,066,542.86 695,571.43 695,571.43 613,133.33 757,400.00 757,400.00 605,920.00 605,920.00 605,920.00 317,386.67 1,038,720.00
2013
Q1 Q2 Q3 Q4
2014
Q1 Q2 Q3 Q4
Cash Outflow 2015-2016
Item Description Months % Amount M1 M2 M3 M4 M5 M6 M7 M8 M9 M10 M11 M12
Construction Cost
1 Earthworks 1 4.3% 865,600.00
2 Foundation 3 8.7% 1,731,200.00
3 RC Framework 9 21.7% 4,328,000.00
4 Walls, Doors & Window Frame 7 13.0% 2,596,800.00
5 Roofing, Elec Wiring & Plumbing 7 13.0% 2,596,800.00
6 Internal & External Plastering 8 13.0% 2,596,800.00
7 Sewerage Works 5 4.3% 865,600.00
8 Drainage Works 6 4.3% 865,600.00
9 Roadworks 2 8.7% 1,731,200.00 865,600.00
10 Infrastructure Works 6 8.7% 1,731,200.00
TOTAL CONSTRUCTION COST 100.0% 19,908,800.00
Monthly Total Cash Outflow (Before Retention) 865,600.00 - - - - - - - - - - -
Monthly Cumulative Outflow (Before Retention) 19,908,800.00 19,908,800.00 19,908,800.00 19,908,800.00 19,908,800.00 19,908,800.00 19,908,800.00 19,908,800.00 19,908,800.00 19,908,800.00 19,908,800.00 19,908,800.00
Less Retention (10%, Limit 5%) (995,440.00) 497,720.00
Monthly Cumulative Outflow (After Retention) 20,406,520.00 20,406,520.00 20,406,520.00 20,406,520.00 20,406,520.00 20,406,520.00 20,406,520.00 20,406,520.00 20,406,520.00 20,406,520.00 20,406,520.00 20,406,520.00
Monthly Total Cash Outflow (After Retention) 18,047,760.00 1,363,320.00
Item Description Months % Amount M1 M2 M3 M4 M5 M6
Construction Cost
1 Earthworks 1 4.3% 865,600.00
2 Foundation 3 8.7% 1,731,200.00
3 RC Framework 9 21.7% 4,328,000.00
4 Walls, Doors & Window Frame 7 13.0% 2,596,800.00
5 Roofing, Elec Wiring & Plumbing 7 13.0% 2,596,800.00
6 Internal & External Plastering 8 13.0% 2,596,800.00
7 Sewerage Works 5 4.3% 865,600.00
8 Drainage Works 6 4.3% 865,600.00
9 Roadworks 2 8.7% 1,731,200.00
10 Infrastructure Works 6 8.7% 1,731,200.00
TOTAL CONSTRUCTION COST 100.0% 19,908,800.00
Monthly Total Cash Outflow (Before Retention) - - - - - -
Monthly Cumulative Outflow (Before Retention) 19,908,800.00 19,908,800.00 19,908,800.00 19,908,800.00 19,908,800.00 19,908,800.00
Less Retention (10%, Limit 5%) (995,440.00) 497,720.00
Monthly Cumulative Outflow (After Retention) 20,406,520.00 20,406,520.00 20,406,520.00 20,406,520.00 20,406,520.00 20,406,520.00
Monthly Total Cash Outflow (After Retention) 18,047,760.00 497,720.00
2015
Q1 Q2 Q3
Q1 Q2
2016
Q4
Quarter Yearly Cash Flow 2010-2012
Item Description Amount (RM) Q1 Q2 Q3 Q4 Q1 Q2 Q3 Q4 Q1 Q2 Q3 Q4
A CASH INFLOW
1 Bank Loan for Land Purchase 6,500,000.00 6,500,000.00
2 Sales Projection 55,068,750.00
Total Cash Inflow 61,568,750.00 6,500,000.00 - - - - - - - - - - -
Cumulative Cash Inflow 6,500,000.00 6,500,000.00 6,500,000.00 6,500,000.00 6,500,000.00 6,500,000.00 6,500,000.00 6,500,000.00 6,500,000.00 6,500,000.00 6,500,000.00 6,500,000.00
Item Description Amount (RM) Q1 Q2 Q3 Q4 Q1 Q2 Q3 Q4 Q1 Q2 Q3 Q4
B CASH OUTFLOW
1 Land Cost 6,738,187.50 6,738,187.50
2 Construction Cost 19,908,800.00
3 Repayment of Land Loan 6,500,000.00
Administrative Cost
4 Professional Fees 1,791,792.00
5 Administrative Fees 1,101,375.00
6 Plan Fees 396,000.00
7 Contribution & Fees 398,176.00
8 Advertising & Marketing 550,687.50
9 Conversion Premium:-
a) Commercial 125,400.00
b) Residential 513,000.00
c) Subdivision 297,000.00
d) Legal Fees 495,000.00
Financing Cost
10 Interest on Bridging Finance 2,389,056.00
11 Interest on Land Loan 2,925,000.00
12 Contigencies 995,440.00
Total Cash Outflow 45,124,914.00 6,738,187.50 - - - - - - - - - - -
Cumulative Cash Outflow 6,738,187.50 6,738,187.50 6,738,187.50 6,738,187.50 6,738,187.50 6,738,187.50 6,738,187.50 6,738,187.50 6,738,187.50 6,738,187.50 6,738,187.50 6,738,187.50
2010 2011 2012
2010 2011 2012
QuarterYearly Cash Flow2013-2015
Item Description Amount (RM) Q1 Q2 Q3 Q4 Q1 Q2 Q3 Q4 Q1 Q2
A CASHINFLOW
1 Bank Loanfor LandPurchase 6,500,000.00
2 Sales Projection 55,068,750.00 13,314,400.00 9,212,390.00 11,194,865.00 5,110,380.00 11,194,865.00 2,016,740.00 3,025,110.00
TotalCash Inflow 61,568,750.00 13,314,400.00 - 9,212,390.00 11,194,865.00 5,110,380.00 11,194,865.00 2,016,740.00 3,025,110.00 - -
Cumulative Cash Inflow 19,814,400.00 19,814,400.00 29,026,790.00 40,221,655.00 45,332,035.00 56,526,900.00 58,543,640.00 61,568,750.00 61,568,750.00 61,568,750.00
Item Description Amount (RM) Q1 Q2 Q3 Q4 Q1 Q2 Q3 Q4 Q1 Q2
B CASHOUTFLOW
1 LandCost 6,738,187.50
2 ConstructionCost 19,908,800.00 2,019,733.33 2,019,733.33 2,184,609.52 3,993,095.24 2,828,657.14 2,066,104.76 1,969,240.00 1,962,026.67 865,600.00
3 Repayment of LandLoan 6,500,000.00 6,500,000.00
Administrative Cost
4 Professional Fees 1,791,792.00 1,075,075.20 358,358.40 358,358.40
5 Administrative Fees 1,101,375.00 137,671.88 137,671.88 137,671.88 137,671.88 137,671.88 137,671.88 137,671.88 137,671.88
6 PlanFees 396,000.00 396,000.00
7 Contribution& Fees 398,176.00 398,176.00
8 Advertising& Marketing 550,687.50 68,835.94 68,835.94 68,835.94 68,835.94 68,835.94 68,835.94 68,835.94 68,835.94
9 ConversionPremium:-
a)Commercial 125,400.00 125,400.00
b)Residential 513,000.00 513,000.00
c)Subdivision 297,000.00 297,000.00
d)Legal Fees 495,000.00 495,000.00
Financing Cost
10 Interest onBridgingFinance 2,389,056.00 298,632.00 298,632.00 298,632.00 298,632.00 298,632.00 298,632.00 298,632.00 298,632.00
11 Interest onLandLoan 2,925,000.00 365,625.00 365,625.00 365,625.00 365,625.00 365,625.00 365,625.00 365,625.00 365,625.00
12 Contigencies 995,440.00 124,430.00 124,430.00 124,430.00 124,430.00 124,430.00 124,430.00 124,430.00 124,430.00
TotalCash Outflow 45,124,914.00 5,650,322.35 3,014,928.15 3,179,804.34 4,988,290.05 4,182,210.36 3,061,299.57 2,964,434.81 9,457,221.48 1,888,215.40 -
Cumulative Cash Outflow 12,388,509.85 15,403,437.99 18,583,242.33 23,571,532.38 27,753,742.73 30,815,042.31 33,779,477.12 43,236,698.60 45,124,914.00 45,124,914.00
2013 2014
2015
2015
2013 2014
2.3 Net Present Value
PV = 1/(1+i)^n
Year Quarter Quarterly Inflow Quarterly Outflow Net Cash Flow PV Factor (12%) NPV
Q1 6,500,000.00 (6,738,187.50) (238,187.50) 0.972 (231,533.83)
Q2 - - - 0.945 -
Q3 - - - 0.919 -
Q4 - - - 0.893 -
Q1 - - - 0.868 -
Q2 - - - 0.844 -
Q3 - - - 0.820 -
Q4 - - - 0.797 -
Q1 - - - 0.775 -
Q2 - - - 0.753 -
Q3 - - - 0.732 -
Q4 - - - 0.712 -
Q1 13,314,400.00 (5,650,322.35) 7,664,077.65 0.692 5,302,752.07
Q2 - (3,014,928.15) (3,014,928.15) 0.673 (2,027,747.56)
Q3 9,212,390.00 (3,179,804.34) 6,032,585.66 0.654 3,943,990.97
Q4 11,194,865.00 (4,988,290.05) 6,206,574.95 0.636 3,944,390.59
Q1 5,110,380.00 (4,182,210.36) 928,169.64 0.618 573,390.86
Q2 11,194,865.00 (3,061,299.57) 8,133,565.43 0.601 4,884,272.24
Q3 2,016,740.00 (2,964,434.81) (947,694.81) 0.584 (553,200.92)
Q4 3,025,110.00 (9,457,221.48) (6,432,111.48) 0.567 (3,649,752.79)
Q1 - (1,888,215.40) (1,888,215.40) 0.552 (1,041,494.35)
Q2 - - - 0.536 -
Q3 - - - 0.521 -
Q4 - - - 0.507 -
Q1 - - - 0.492 -
Q2 - (497,720.00) (497,720.00) 0.479 (238,269.22)
Q3 - - - 0.465 -
Q4 - - - 0.452 -
15,946,115.99 10,906,798.06Total
2010
2016
2015
2014
2013
2012
2011
2.4 Build-then-sell Concept
‘Build- then- Sell’ concept in property market known as a project will only open for
sales after the issuance of Certificate of Completion and Compliance (CCC). ‘Build- then Sell’
concept is the new concept introduced by the Government to the developers. However,
developers have their own decision to choose whether to carry out ‘Build- then Sell’ or ‘Sell-
then- Build’ because the cash flow faced by the developer could be different. There are two
types of ‘Build- then- Sell’ which are 100% ‘Build- then- Sell’ with CCC and ‘Build- then-
Sell’ 10:90 formula. The figure 5.1 shows the graph 100% ‘Build- then- Sell’ with CCC.
Figure 5.1 Cash Flow of 100% ‘Build- then- Sell’ with CCC
Based on the figure 5.1, the developer do not receive any payment from the purchasers
to fund the construction costs or to repay the bridging loans secured by the developer from
point A to point C which is during the construction stage. In this case, during the construction
stage the developer will face serious financial problems which is the negative cash flow. Thus,
the developer has to borrow loans which is the short-term and long-term loan from the bank to
cover current obligations by providing immediate cash flow due to the zero cash inflows during
the construction stage. At point C, sales only can launched at this time where the project has
been completed and issuance by the Certificate of Completion and Compliance (CCC) which
allow the purchasers to buy the property first with the payment of 10% of selling price upon
signing the sale and purchase agreement. However, the break-even point of cash inflow and
outflow for the developer will not meet at this point yet because the net inflows may need
longer time to move into profit account where the other 90% of the payment from each
purchaser will be paid after3 months from the date of signing sales and purchase agreement
with another 1 month extension. In additional, the developer has to ensure that all of the
property or housing that has been constructed able to sell out as soon as possible so that they
are able to pay the debt to bank to avoid the charge of interest. Once there are the property or
housing weren’t sell out yet then the developer is consider loss of profits.
The `Build- then- Sell’ with 10:90 formula is where the buyers only required to pay 10%
of the total amount of the selling price to the stakeholder as proposed by the Housing Buyers
Association (HBA). The 10% payment made by the buyers can be assumed as the booking fees
for their selection of property or housing based on their favored. After that, the buyers will not
require to make any payment during the construction stage until the issuance of Certificate of
Completion and Compliance has been issued only the buyers required to pay the remaining 90%
of the selling price of the property. Based on National House Buyer Association (HBA),
developer who wanted to adopt this Build then Sell 10:90 formula will be exempted from
paying Rm200, 000 deposit for a housing development license.
The ‘Build- then –Sell’ concept could bring advantages to the buyers, bank and
developer. The main advantage of `Build- then- Sell’ to the buyers is they can avoid from
buying properties or houses that might be abandoned during the construction period and
property or housing that could not complete at the time as promised and caused major delay
problems. If this situation happened, it could decrease the reputation of the developer and the
the buyers will losses their trusts on the developer and avoid buying property or housing from
the developer.
Next, ‘Build- then- Sell’ concept able for the buyers to view the completed design and
construction of the houses to make sure the final products are able to reach the satisfaction
from the buyers. This is because the design before completion as advertisement might be
different from the actual completion design. Buyers also able to examine the quality of the
housing in term of finishing, specification and etc. and workmanship during construction the
housing project. In financial aspect, buyers only required to pay after the issuance of Certificate
of Completion and Compliance to the housing which could increase the confidence of the
buyers on purchasing the property or housing.
The advantage could be found between the developer and buyers where the developer
has the ability to accommodate the specific property or housing that based on the demands and
needs from the buyers. Before the completion or during the construction of a project, the buyers
may want certain finishes, specifications and design to the property or housing so the developer
can conduct a survey to conclude the decision and meet most of the buyer satisfaction which
could highly increase the demand of the property or housing.
After that, there are advantages for the developer from the government to encourage
and helps in decrease financial burden of the developer to who implement the ‘Build- then-
Sell’ concept. There are four types of incentives by government to the developer which are:
 The banking institution to be given tax exemption on interest income received
from the rescuing contractor or developer.
 Developer be given a double deduction on interest paid and all direct costs
incurred in obtaining loans.
 Contractor be given stamp duty exemption on all instruments executed for the
purpose of transfer of land or house.
 Loan agreements to finance the cost of revival and original house buyer in
abandoned project be given stamp duty exemption on all instruments executed
for the purpose of obtaining additional finance and the transfer of the house.
Lastly, there are advantages for the bank because there are required of bank loan by
developer to run or develop the property or housing based on ‘Build- then- Sell’ concept. This
allow the bank to gain more interest profits when they released the high amount of loan to the
developer.
In conclusion, the cash flow of ‘Build- then Sell’ seen like not a good sight for the
developer where the developer may faces a lot of financial issues and the developer may need
a sufficient or high amount of capital to kick start a construction. However, the implement of
`Build- then-Sell’ concept able to provide benefits to the developer, buyers, banker so it is
highly recommend to implement the concept of ‘Build- then- Sell’ in a country.

More Related Content

Similar to De assignment

The watergate confidential
The watergate confidentialThe watergate confidential
The watergate confidentialHaris Memon
 
Presentations
PresentationsPresentations
PresentationsEucatexRI
 
Real Estate Development - Financial Model
Real Estate Development - Financial ModelReal Estate Development - Financial Model
Real Estate Development - Financial ModelImran Almaleh
 
Final presentation with excel
Final presentation with excelFinal presentation with excel
Final presentation with excelAura Investments
 
Financial Model Sample Format - Cement Company
Financial Model Sample Format - Cement CompanyFinancial Model Sample Format - Cement Company
Financial Model Sample Format - Cement CompanyPranav Pareek
 
Colliers Gta office market statistics q1 2016
Colliers Gta office market statistics q1 2016Colliers Gta office market statistics q1 2016
Colliers Gta office market statistics q1 2016Chris Fyvie
 
Second edition epc project rule of credit and progress measurement promo
Second edition epc project rule of credit and progress measurement promoSecond edition epc project rule of credit and progress measurement promo
Second edition epc project rule of credit and progress measurement promoignitetribes
 
Westheimer mobil station
Westheimer mobil stationWestheimer mobil station
Westheimer mobil stationrobertday
 
Westheimer mobil station
Westheimer mobil stationWestheimer mobil station
Westheimer mobil stationnateshow
 
Spdr debunking-5-common-gold-misconceptions
Spdr debunking-5-common-gold-misconceptionsSpdr debunking-5-common-gold-misconceptions
Spdr debunking-5-common-gold-misconceptionsZewoMaluk
 
Market Sizing Study
Market Sizing StudyMarket Sizing Study
Market Sizing StudyCABA
 
YorBox UK model
YorBox UK modelYorBox UK model
YorBox UK modelYorBox
 
111647298 heritage-dolls-case-study-analysis-calc
111647298 heritage-dolls-case-study-analysis-calc111647298 heritage-dolls-case-study-analysis-calc
111647298 heritage-dolls-case-study-analysis-calcFaheem Mukhtar
 
Flujo de caja
Flujo de cajaFlujo de caja
Flujo de cajaacalixtoh
 
Payment Method for Work item Studies and Design November 26, 2010.
Payment Method for Work item Studies and Design November 26, 2010.Payment Method for Work item Studies and Design November 26, 2010.
Payment Method for Work item Studies and Design November 26, 2010.Mourad Iskandar
 
PPT Item # 5&6 - Water & Sewer Rate Study
PPT Item # 5&6 - Water & Sewer Rate StudyPPT Item # 5&6 - Water & Sewer Rate Study
PPT Item # 5&6 - Water & Sewer Rate Studyahcitycouncil
 

Similar to De assignment (20)

The watergate confidential
The watergate confidentialThe watergate confidential
The watergate confidential
 
2 q11
2 q112 q11
2 q11
 
Presentations
PresentationsPresentations
Presentations
 
Real Estate Development - Financial Model
Real Estate Development - Financial ModelReal Estate Development - Financial Model
Real Estate Development - Financial Model
 
Final presentation with excel
Final presentation with excelFinal presentation with excel
Final presentation with excel
 
Financial Model Sample Format - Cement Company
Financial Model Sample Format - Cement CompanyFinancial Model Sample Format - Cement Company
Financial Model Sample Format - Cement Company
 
Colliers Gta office market statistics q1 2016
Colliers Gta office market statistics q1 2016Colliers Gta office market statistics q1 2016
Colliers Gta office market statistics q1 2016
 
Second edition epc project rule of credit and progress measurement promo
Second edition epc project rule of credit and progress measurement promoSecond edition epc project rule of credit and progress measurement promo
Second edition epc project rule of credit and progress measurement promo
 
Westheimer mobil station
Westheimer mobil stationWestheimer mobil station
Westheimer mobil station
 
Westheimer mobil station
Westheimer mobil stationWestheimer mobil station
Westheimer mobil station
 
2015 Savings Achieved
2015 Savings Achieved2015 Savings Achieved
2015 Savings Achieved
 
Spdr debunking-5-common-gold-misconceptions
Spdr debunking-5-common-gold-misconceptionsSpdr debunking-5-common-gold-misconceptions
Spdr debunking-5-common-gold-misconceptions
 
Hansson
HanssonHansson
Hansson
 
Market Sizing Study
Market Sizing StudyMarket Sizing Study
Market Sizing Study
 
YorBox UK model
YorBox UK modelYorBox UK model
YorBox UK model
 
111647298 heritage-dolls-case-study-analysis-calc
111647298 heritage-dolls-case-study-analysis-calc111647298 heritage-dolls-case-study-analysis-calc
111647298 heritage-dolls-case-study-analysis-calc
 
Flujo de caja
Flujo de cajaFlujo de caja
Flujo de caja
 
Payment Method for Work item Studies and Design November 26, 2010.
Payment Method for Work item Studies and Design November 26, 2010.Payment Method for Work item Studies and Design November 26, 2010.
Payment Method for Work item Studies and Design November 26, 2010.
 
PPT Item # 5&6 - Water & Sewer Rate Study
PPT Item # 5&6 - Water & Sewer Rate StudyPPT Item # 5&6 - Water & Sewer Rate Study
PPT Item # 5&6 - Water & Sewer Rate Study
 
INVESTAURA_Business-Planning-Template.pdf
INVESTAURA_Business-Planning-Template.pdfINVESTAURA_Business-Planning-Template.pdf
INVESTAURA_Business-Planning-Template.pdf
 

More from Lwj Welson

Vm presentation
Vm presentationVm presentation
Vm presentationLwj Welson
 
Mah Sing Group Berhad
Mah Sing Group BerhadMah Sing Group Berhad
Mah Sing Group BerhadLwj Welson
 
Be cost appraisal
Be cost appraisalBe cost appraisal
Be cost appraisalLwj Welson
 
Pp1 assignment
Pp1 assignmentPp1 assignment
Pp1 assignmentLwj Welson
 
Pp1 assignment
Pp1 assignmentPp1 assignment
Pp1 assignmentLwj Welson
 
Bs ii-assignment
Bs ii-assignmentBs ii-assignment
Bs ii-assignmentLwj Welson
 
Safety complete
Safety completeSafety complete
Safety completeLwj Welson
 
Thc construction-company-completed
Thc construction-company-completedThc construction-company-completed
Thc construction-company-completedLwj Welson
 
Management science presentation slides
Management science  presentation slidesManagement science  presentation slides
Management science presentation slidesLwj Welson
 
Building services-i (2)
Building services-i (2)Building services-i (2)
Building services-i (2)Lwj Welson
 
Assignment (1)
Assignment (1)Assignment (1)
Assignment (1)Lwj Welson
 
Assignment (1)
Assignment (1)Assignment (1)
Assignment (1)Lwj Welson
 
Epc oral presentation part 2
Epc oral presentation part 2Epc oral presentation part 2
Epc oral presentation part 2Lwj Welson
 
Epc oral presentation part 1
Epc oral presentation part 1Epc oral presentation part 1
Epc oral presentation part 1Lwj Welson
 
Psy final-write-up
Psy final-write-upPsy final-write-up
Psy final-write-upLwj Welson
 
Psychology social elements
Psychology social elementsPsychology social elements
Psychology social elementsLwj Welson
 
Social behavior
Social behaviorSocial behavior
Social behaviorLwj Welson
 

More from Lwj Welson (20)

Pm only
Pm onlyPm only
Pm only
 
Vm presentation
Vm presentationVm presentation
Vm presentation
 
Mah Sing Group Berhad
Mah Sing Group BerhadMah Sing Group Berhad
Mah Sing Group Berhad
 
Be cost appraisal
Be cost appraisalBe cost appraisal
Be cost appraisal
 
Pp1 assignment
Pp1 assignmentPp1 assignment
Pp1 assignment
 
Pp1 assignment
Pp1 assignmentPp1 assignment
Pp1 assignment
 
Final pp1
Final pp1Final pp1
Final pp1
 
Bs ii-assignment
Bs ii-assignmentBs ii-assignment
Bs ii-assignment
 
Safety complete
Safety completeSafety complete
Safety complete
 
Thc construction-company-completed
Thc construction-company-completedThc construction-company-completed
Thc construction-company-completed
 
Management science presentation slides
Management science  presentation slidesManagement science  presentation slides
Management science presentation slides
 
Building services-i (2)
Building services-i (2)Building services-i (2)
Building services-i (2)
 
Assignment (1)
Assignment (1)Assignment (1)
Assignment (1)
 
Assignment (1)
Assignment (1)Assignment (1)
Assignment (1)
 
Ct
CtCt
Ct
 
Epc oral presentation part 2
Epc oral presentation part 2Epc oral presentation part 2
Epc oral presentation part 2
 
Epc oral presentation part 1
Epc oral presentation part 1Epc oral presentation part 1
Epc oral presentation part 1
 
Psy final-write-up
Psy final-write-upPsy final-write-up
Psy final-write-up
 
Psychology social elements
Psychology social elementsPsychology social elements
Psychology social elements
 
Social behavior
Social behaviorSocial behavior
Social behavior
 

Recently uploaded

OAT_RI_Ep19 WeighingTheRisks_Apr24_TheYellowMetal.pptx
OAT_RI_Ep19 WeighingTheRisks_Apr24_TheYellowMetal.pptxOAT_RI_Ep19 WeighingTheRisks_Apr24_TheYellowMetal.pptx
OAT_RI_Ep19 WeighingTheRisks_Apr24_TheYellowMetal.pptxhiddenlevers
 
Independent Lucknow Call Girls 8923113531WhatsApp Lucknow Call Girls make you...
Independent Lucknow Call Girls 8923113531WhatsApp Lucknow Call Girls make you...Independent Lucknow Call Girls 8923113531WhatsApp Lucknow Call Girls make you...
Independent Lucknow Call Girls 8923113531WhatsApp Lucknow Call Girls make you...makika9823
 
(办理原版一样)QUT毕业证昆士兰科技大学毕业证学位证留信学历认证成绩单补办
(办理原版一样)QUT毕业证昆士兰科技大学毕业证学位证留信学历认证成绩单补办(办理原版一样)QUT毕业证昆士兰科技大学毕业证学位证留信学历认证成绩单补办
(办理原版一样)QUT毕业证昆士兰科技大学毕业证学位证留信学历认证成绩单补办fqiuho152
 
call girls in Nand Nagri (DELHI) 🔝 >༒9953330565🔝 genuine Escort Service 🔝✔️✔️
call girls in  Nand Nagri (DELHI) 🔝 >༒9953330565🔝 genuine Escort Service 🔝✔️✔️call girls in  Nand Nagri (DELHI) 🔝 >༒9953330565🔝 genuine Escort Service 🔝✔️✔️
call girls in Nand Nagri (DELHI) 🔝 >༒9953330565🔝 genuine Escort Service 🔝✔️✔️9953056974 Low Rate Call Girls In Saket, Delhi NCR
 
Bladex Earnings Call Presentation 1Q2024
Bladex Earnings Call Presentation 1Q2024Bladex Earnings Call Presentation 1Q2024
Bladex Earnings Call Presentation 1Q2024Bladex
 
SBP-Market-Operations and market managment
SBP-Market-Operations and market managmentSBP-Market-Operations and market managment
SBP-Market-Operations and market managmentfactical
 
VIP Kolkata Call Girl Jodhpur Park 👉 8250192130 Available With Room
VIP Kolkata Call Girl Jodhpur Park 👉 8250192130  Available With RoomVIP Kolkata Call Girl Jodhpur Park 👉 8250192130  Available With Room
VIP Kolkata Call Girl Jodhpur Park 👉 8250192130 Available With Roomdivyansh0kumar0
 
government_intervention_in_business_ownership[1].pdf
government_intervention_in_business_ownership[1].pdfgovernment_intervention_in_business_ownership[1].pdf
government_intervention_in_business_ownership[1].pdfshaunmashale756
 
VIP Call Girls Service Dilsukhnagar Hyderabad Call +91-8250192130
VIP Call Girls Service Dilsukhnagar Hyderabad Call +91-8250192130VIP Call Girls Service Dilsukhnagar Hyderabad Call +91-8250192130
VIP Call Girls Service Dilsukhnagar Hyderabad Call +91-8250192130Suhani Kapoor
 
Quantitative Analysis of Retail Sector Companies
Quantitative Analysis of Retail Sector CompaniesQuantitative Analysis of Retail Sector Companies
Quantitative Analysis of Retail Sector Companiesprashantbhati354
 
VIP Call Girls LB Nagar ( Hyderabad ) Phone 8250192130 | ₹5k To 25k With Room...
VIP Call Girls LB Nagar ( Hyderabad ) Phone 8250192130 | ₹5k To 25k With Room...VIP Call Girls LB Nagar ( Hyderabad ) Phone 8250192130 | ₹5k To 25k With Room...
VIP Call Girls LB Nagar ( Hyderabad ) Phone 8250192130 | ₹5k To 25k With Room...Suhani Kapoor
 
Call Girls In Yusuf Sarai Women Seeking Men 9654467111
Call Girls In Yusuf Sarai Women Seeking Men 9654467111Call Girls In Yusuf Sarai Women Seeking Men 9654467111
Call Girls In Yusuf Sarai Women Seeking Men 9654467111Sapana Sha
 
Call Girls Service Nagpur Maya Call 7001035870 Meet With Nagpur Escorts
Call Girls Service Nagpur Maya Call 7001035870 Meet With Nagpur EscortsCall Girls Service Nagpur Maya Call 7001035870 Meet With Nagpur Escorts
Call Girls Service Nagpur Maya Call 7001035870 Meet With Nagpur Escortsranjana rawat
 
Instant Issue Debit Cards - High School Spirit
Instant Issue Debit Cards - High School SpiritInstant Issue Debit Cards - High School Spirit
Instant Issue Debit Cards - High School Spiritegoetzinger
 
fca-bsps-decision-letter-redacted (1).pdf
fca-bsps-decision-letter-redacted (1).pdffca-bsps-decision-letter-redacted (1).pdf
fca-bsps-decision-letter-redacted (1).pdfHenry Tapper
 
The Triple Threat | Article on Global Resession | Harsh Kumar
The Triple Threat | Article on Global Resession | Harsh KumarThe Triple Threat | Article on Global Resession | Harsh Kumar
The Triple Threat | Article on Global Resession | Harsh KumarHarsh Kumar
 
Q3 2024 Earnings Conference Call and Webcast Slides
Q3 2024 Earnings Conference Call and Webcast SlidesQ3 2024 Earnings Conference Call and Webcast Slides
Q3 2024 Earnings Conference Call and Webcast SlidesMarketing847413
 
Chapter 2.ppt of macroeconomics by mankiw 9th edition
Chapter 2.ppt of macroeconomics by mankiw 9th editionChapter 2.ppt of macroeconomics by mankiw 9th edition
Chapter 2.ppt of macroeconomics by mankiw 9th editionMuhammadHusnain82237
 
Authentic No 1 Amil Baba In Pakistan Authentic No 1 Amil Baba In Karachi No 1...
Authentic No 1 Amil Baba In Pakistan Authentic No 1 Amil Baba In Karachi No 1...Authentic No 1 Amil Baba In Pakistan Authentic No 1 Amil Baba In Karachi No 1...
Authentic No 1 Amil Baba In Pakistan Authentic No 1 Amil Baba In Karachi No 1...First NO1 World Amil baba in Faisalabad
 
VIP Kolkata Call Girl Serampore 👉 8250192130 Available With Room
VIP Kolkata Call Girl Serampore 👉 8250192130  Available With RoomVIP Kolkata Call Girl Serampore 👉 8250192130  Available With Room
VIP Kolkata Call Girl Serampore 👉 8250192130 Available With Roomdivyansh0kumar0
 

Recently uploaded (20)

OAT_RI_Ep19 WeighingTheRisks_Apr24_TheYellowMetal.pptx
OAT_RI_Ep19 WeighingTheRisks_Apr24_TheYellowMetal.pptxOAT_RI_Ep19 WeighingTheRisks_Apr24_TheYellowMetal.pptx
OAT_RI_Ep19 WeighingTheRisks_Apr24_TheYellowMetal.pptx
 
Independent Lucknow Call Girls 8923113531WhatsApp Lucknow Call Girls make you...
Independent Lucknow Call Girls 8923113531WhatsApp Lucknow Call Girls make you...Independent Lucknow Call Girls 8923113531WhatsApp Lucknow Call Girls make you...
Independent Lucknow Call Girls 8923113531WhatsApp Lucknow Call Girls make you...
 
(办理原版一样)QUT毕业证昆士兰科技大学毕业证学位证留信学历认证成绩单补办
(办理原版一样)QUT毕业证昆士兰科技大学毕业证学位证留信学历认证成绩单补办(办理原版一样)QUT毕业证昆士兰科技大学毕业证学位证留信学历认证成绩单补办
(办理原版一样)QUT毕业证昆士兰科技大学毕业证学位证留信学历认证成绩单补办
 
call girls in Nand Nagri (DELHI) 🔝 >༒9953330565🔝 genuine Escort Service 🔝✔️✔️
call girls in  Nand Nagri (DELHI) 🔝 >༒9953330565🔝 genuine Escort Service 🔝✔️✔️call girls in  Nand Nagri (DELHI) 🔝 >༒9953330565🔝 genuine Escort Service 🔝✔️✔️
call girls in Nand Nagri (DELHI) 🔝 >༒9953330565🔝 genuine Escort Service 🔝✔️✔️
 
Bladex Earnings Call Presentation 1Q2024
Bladex Earnings Call Presentation 1Q2024Bladex Earnings Call Presentation 1Q2024
Bladex Earnings Call Presentation 1Q2024
 
SBP-Market-Operations and market managment
SBP-Market-Operations and market managmentSBP-Market-Operations and market managment
SBP-Market-Operations and market managment
 
VIP Kolkata Call Girl Jodhpur Park 👉 8250192130 Available With Room
VIP Kolkata Call Girl Jodhpur Park 👉 8250192130  Available With RoomVIP Kolkata Call Girl Jodhpur Park 👉 8250192130  Available With Room
VIP Kolkata Call Girl Jodhpur Park 👉 8250192130 Available With Room
 
government_intervention_in_business_ownership[1].pdf
government_intervention_in_business_ownership[1].pdfgovernment_intervention_in_business_ownership[1].pdf
government_intervention_in_business_ownership[1].pdf
 
VIP Call Girls Service Dilsukhnagar Hyderabad Call +91-8250192130
VIP Call Girls Service Dilsukhnagar Hyderabad Call +91-8250192130VIP Call Girls Service Dilsukhnagar Hyderabad Call +91-8250192130
VIP Call Girls Service Dilsukhnagar Hyderabad Call +91-8250192130
 
Quantitative Analysis of Retail Sector Companies
Quantitative Analysis of Retail Sector CompaniesQuantitative Analysis of Retail Sector Companies
Quantitative Analysis of Retail Sector Companies
 
VIP Call Girls LB Nagar ( Hyderabad ) Phone 8250192130 | ₹5k To 25k With Room...
VIP Call Girls LB Nagar ( Hyderabad ) Phone 8250192130 | ₹5k To 25k With Room...VIP Call Girls LB Nagar ( Hyderabad ) Phone 8250192130 | ₹5k To 25k With Room...
VIP Call Girls LB Nagar ( Hyderabad ) Phone 8250192130 | ₹5k To 25k With Room...
 
Call Girls In Yusuf Sarai Women Seeking Men 9654467111
Call Girls In Yusuf Sarai Women Seeking Men 9654467111Call Girls In Yusuf Sarai Women Seeking Men 9654467111
Call Girls In Yusuf Sarai Women Seeking Men 9654467111
 
Call Girls Service Nagpur Maya Call 7001035870 Meet With Nagpur Escorts
Call Girls Service Nagpur Maya Call 7001035870 Meet With Nagpur EscortsCall Girls Service Nagpur Maya Call 7001035870 Meet With Nagpur Escorts
Call Girls Service Nagpur Maya Call 7001035870 Meet With Nagpur Escorts
 
Instant Issue Debit Cards - High School Spirit
Instant Issue Debit Cards - High School SpiritInstant Issue Debit Cards - High School Spirit
Instant Issue Debit Cards - High School Spirit
 
fca-bsps-decision-letter-redacted (1).pdf
fca-bsps-decision-letter-redacted (1).pdffca-bsps-decision-letter-redacted (1).pdf
fca-bsps-decision-letter-redacted (1).pdf
 
The Triple Threat | Article on Global Resession | Harsh Kumar
The Triple Threat | Article on Global Resession | Harsh KumarThe Triple Threat | Article on Global Resession | Harsh Kumar
The Triple Threat | Article on Global Resession | Harsh Kumar
 
Q3 2024 Earnings Conference Call and Webcast Slides
Q3 2024 Earnings Conference Call and Webcast SlidesQ3 2024 Earnings Conference Call and Webcast Slides
Q3 2024 Earnings Conference Call and Webcast Slides
 
Chapter 2.ppt of macroeconomics by mankiw 9th edition
Chapter 2.ppt of macroeconomics by mankiw 9th editionChapter 2.ppt of macroeconomics by mankiw 9th edition
Chapter 2.ppt of macroeconomics by mankiw 9th edition
 
Authentic No 1 Amil Baba In Pakistan Authentic No 1 Amil Baba In Karachi No 1...
Authentic No 1 Amil Baba In Pakistan Authentic No 1 Amil Baba In Karachi No 1...Authentic No 1 Amil Baba In Pakistan Authentic No 1 Amil Baba In Karachi No 1...
Authentic No 1 Amil Baba In Pakistan Authentic No 1 Amil Baba In Karachi No 1...
 
VIP Kolkata Call Girl Serampore 👉 8250192130 Available With Room
VIP Kolkata Call Girl Serampore 👉 8250192130  Available With RoomVIP Kolkata Call Girl Serampore 👉 8250192130  Available With Room
VIP Kolkata Call Girl Serampore 👉 8250192130 Available With Room
 

De assignment

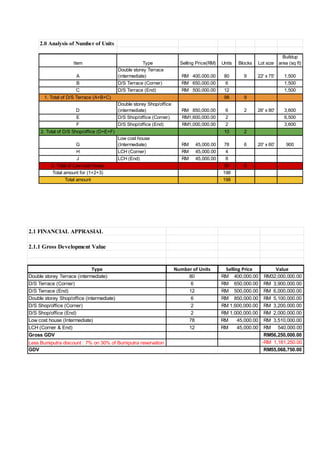
  • 1. 2.0 Analysis of Number of Units Item Type Selling Price(RM) Units Blocks Lot size Buildup area (sq ft) A Double storey Terrace (intermediate) RM 400,000.00 80 9 22' x 75' 1,500 B D/S Terrace (Corner) RM 650,000.00 6 1,500 C D/S Terrace (End) RM 500,000.00 12 1,500 1. Total of D/S Terrace (A+B+C) 98 9 D Double storey Shop/office (intermediate) RM 850,000.00 6 2 26' x 80' 3,600 E D/S Shop/office (Corner) RM1,600,000.00 2 6,500 F D/S Shop/office (End) RM1,000,000.00 2 3,600 2. Total of D/S Shop/office (D+E+F) 10 2 G Low cost house (Intermediate) RM 45,000.00 78 6 20' x 60' 900 H LCH (Corner) RM 45,000.00 4 J LCH (End) RM 45,000.00 8 3. Total of Low cost house 90 6 Total amount for (1+2+3) 198 Total amount 198 2.1 FINANCIAL APPRASIAL 2.1.1 Gross Development Value Type Number of Units Selling Price Value Double storey Terrace (intermediate) 80 RM 400,000.00 RM32,000,000.00 D/S Terrace (Corner) 6 RM 650,000.00 RM 3,900,000.00 D/S Terrace (End) 12 RM 500,000.00 RM 6,000,000.00 Double storey Shop/office (intermediate) 6 RM 850,000.00 RM 5,100,000.00 D/S Shop/office (Corner) 2 RM 1,600,000.00 RM 3,200,000.00 D/S Shop/office (End) 2 RM 1,000,000.00 RM 2,000,000.00 Low cost house (Intermediate) 78 RM 45,000.00 RM 3,510,000.00 LCH (Corner & End) 12 RM 45,000.00 RM 540,000.00 Gross GDV RM56,250,000.00 Less Bumiputra discount : 7% on 30% of Bumiputra reservation -RM 1,181,250.00 GDV RM55,068,750.00
  • 2. 2.1.2 Gross Development Cost Item Description RM/SF SF Cost (RM) Total (RM) 1 Land Cost 15.00 449,213 - 6,738,187.50 2 Building Cost a) Double storey Terrace (intermediate) 75.00 120,000 9,000,000.00 b) D/S Terrace (Corner & End) 85.00 27,000 2,295,000.00 c) Double storey Shop/office (intermediate) 70.00 21,600 1,512,000.00 d) D/S Shop/office (Corner & End) 80.00 20,200 1,616,000.00 e) Low cost house (Intermediate) 35.00 70,200 2,457,000.00 f) LCH (Corner & End) 40.00 10,800 432,000.00 Total Building Cost 17,312,000.00 g) Earth Works (5% of building cost) 5% 865,600.00 h) Infrastructure cost (10% of building cost) 10% 1,731,200.00 Total Construction cost 19,908,800.00 3 Administrative cost a) Professional fee (9% of construction cost) 9% 1,791,792.00 b) Admistrative fee (2% of GDV) 2% 1,101,375.00 c) Plan fees (RM2000/unit) 2,000.00 396,000.00 d) Contributions & fees (2% of construction cost) 2% 398,176.00 e) Advertisement (1% of GDV) 1% 550,687.50 f) Land conversion Commercial (20% land value of commercial lots) 20% 125,400.00 Residential (15% land value of residential lots) 15% 513,000.00 g) Subdivision (RM1500/unit) 1,500.00 297,000.00 h) Legal fees (RM2500/unit) 2,500.00 495,000.00 Total Administrative Cost 5,668,430.50 4 Financing Cost a) Bridging Finance (50% of construction cost @ 5.5% p.a. + BLR (6.5%) over 2 years) 9,954,400.00 12% 2,389,056.00 b) Interest on Loan for purchase of land (RM 6,500,000.00 @ 2.5% p.a. 6,500,000.00 9% 2,925,000.00 + BLR (6.5%) over 5 years Total Financing Cost 5,314,056.00 5 Contigencies (5% of construction cost) 5% 995,440.00 Gross Development Cost 38,624,914.00
  • 3. 2.2 Cash Flow Cash Inflow 2013 Item Description % Amount M1 M2 M3 M4 M5 M6 M7 M8 M9 M10 M11 M12 Sales Projection 1 Shop/Office 18.3 10,083,700.00 10% 10% 10% 2 Terrace 74.5 41,020,100.00 30% 20% 20% 3 Low Cost 7.2 3,964,950.00 50% Monthly Total 100% 55,068,750.00 24.2% 0.0% 0.0% 0.0% 0.0% 16.7% 0.0% 0.0% 20.3% 0.0% 0.0% % of cumulative sales 24.2% 24.2% 24.2% 24.2% 24.2% 40.9% 40.9% 40.9% 61.2% 61.2% 61.2% Item Description % Amount M1 M2 M3 M4 M5 M6 M7 M8 M9 M10 M11 M12 1 Earthworks 1 100% 100% 2 Foundation 3 100% 8.1% 8.1% 8.1% 16.7% 20.3% 3 RC Framework 9 100% 2.7% 2.7% 2.7% 5.5% 5.5% 5.5% 12.3% 12.3% 12.3% 4 Walls, Doors & Window Frame 7 100% 5.8% 5.8% 9.9% 9.9% 9.9% 5 Roofing, Elec Wiring & Plumbing 7 100% 8.7% 8.7% 8.7% 6 Internal & External Plastering 8 100% 7.7% 7 Sewerage Works 5 100% 8 Drainage Works 6 100% 9 Road Works 2 100% 10 Infrastructure Works 6 100% Item Description % Amount M1 M2 M3 M4 M5 M6 M7 M8 M9 M10 M11 M12 Sales Proceed 24.2% 16.7% 20.3% 1 Signing of S&P 10.0% 5,506,875 1,331,440 921,239 1,119,487 100.0% 2 Earthworks 3.9% 2,154,864 2,154,864 8.1% 8.1% 8.1% 16.7% 20.3% 3 Foundation 7.8% 4,309,728 347,332 347,332 347,332 720,970 876,120 2.7% 2.7% 2.7% 5.5% 5.5% 5.5% 12.3% 12.3% 12.3% 4 RC Framework 19.6% 10,774,321 289,443 289,443 289,443 589,848 589,848 589,848 1,319,947 1,319,947 1,319,947 5.8% 5.8% 9.9% 9.9% 9.9% 5 Walls, Doors & Window Frame 11.7% 6,464,592 377,778 377,778 640,614 640,614 640,614 8.7% 8.7% 8.7% 6 Roofing, Elec Wiring & Plumbing 11.7% 6,464,592 565,518 565,518 565,518 7.7% 7 Internal & External Plastering 11.7% 6,464,592 494,829 8 Sewerage Works 3.9% 2,154,864 9 Drainage Works 3.9% 2,154,864 10 Road Works 7.8% 4,309,728 11 Infrastructure Works 7.8% 4,309,728 100% 55,068,750 3,833,636 347,332 636,776 289,443 289,443 2,232,056 967,626 967,626 4,521,687 2,526,080 3,020,909 Q1 Q2 Q3 Q4 2013 2013 Q1 Q2 Q3 Q4 2013 Q1 Q2 Q3 Q4
  • 4. CashInflow 2014 2015 Q1 Item Description % Amount M1 M2 M3 M4 M5 M6 M7 M8 M9 M10 M11 M12 M1 Sales Projection 1 Shop/Office 18.3 10,083,700.00 10% 10% 20% 30% 2 Terrace 74.5 41,020,100.00 10% 20% 3 LowCost 7.2 3,964,950.00 50% Monthly Total 100% 55,068,750.00 9.3% 0.0% 0.0% 20.3% 0.0% 0.0% 3.7% 0.0% 0.0% 5.5% 0.0% 0.0% 0 % of cumulative sales 70.5% 70.5% 70.5% 90.8% 90.8% 90.8% 94.5% 94.5% 94.5% 100.0% 100.0% 100.0% 100.0% 2015 Q1 Item Description % Amount M1 M2 M3 M4 M5 M6 M7 M8 M9 M10 M11 M12 M1 1 Earthworks 1 100% 2 Foundation 3 100% 9.3% 20.3% 3.7% 5.5% 3 RC Framework 9 100% 9.3% 20.3% 3.7% 5.5% 4 Walls, Doors & WindowFrame 7 100% 14.5% 14.5% 20.3% 3.7% 5.5% 5 Roofing, Elec Wiring & Plumbing 7 100% 11.1% 11.1% 11.1% 31.4% 3.7% 5.5% 6 Internal& ExternalPlastering 8 100% 9.0% 9.0% 9.0% 14.1% 14.1% 14.1% 17.7% 5.5% 7 Sewerage Works 5 100% 18.9% 18.9% 20.7% 20.7% 20.7% 8 Drainage Works 6 100% 15.1% 15.9% 15.9% 15.9% 18.6% 18.6% 9 Road Works 2 100% 50.0% 50.0% 10 Infrastructure Works 6 100% 15.1% 15.1% 16.1% 16.1% 16.1% 21.5% 2015 Q1 Item Description % Amount M1 M2 M3 M4 M5 M6 M7 M8 M9 M10 M11 M12 M1 Sales Proceed 9.3% 20.3% 3.7% 5.5% 1 Signing of S&P 10.0% 5,506,875 511,038 1,119,487 201,674 302,511 2 Earthworks 3.9% 2,154,864 9.3% 20.3% 3.7% 5.5% 3 Foundation 7.8% 4,309,728 399,943 876,120 157,832 236,748 9.3% 20.3% 3.7% 5.5% 4 RC Framework 19.6% 10,774,321 999,857 2,190,300 394,580 591,869 14.5% 14.5% 20.3% 3.7% 5.5% 5 Walls, Doors & WindowFrame 11.7% 6,464,592 940,572 940,572 1,314,180 236,748 355,122 11.1% 11.1% 11.1% 31.4% 3.7% 5.5% 6 Roofing, Elec Wiring & Plumbing 11.7% 6,464,592 715,497 715,497 715,497 2,029,677 236,748 355,122 9.0% 9.0% 9.0% 14.1% 14.1% 14.1% 17.7% 5.5% 7 Internal& ExternalPlastering 11.7% 6,464,592 580,531 580,531 580,531 909,076 909,076 909,076 1,145,823 355,122 18.9% 18.9% 20.7% 20.7% 20.7% 8 Sewerage Works 3.9% 2,154,864 407,298 407,298 446,756 446,756 446,756 15.1% 15.9% 15.9% 15.9% 18.6% 18.6% 9 Drainage Works 3.9% 2,154,864 326,262 342,046 342,046 342,046 401,233 401,233 50.0% 50.0% 10 Road Works 7.8% 4,309,728 2,154,864 2,154,864 15.1% 15.1% 16.1% 16.1% 16.1% 21.5% 11 Infrastructure Works 7.8% 4,309,728 652,525 652,525 691,983 691,983 691,983 928,730 100% 55,068,750 4,147,437 2,236,599 1,296,028 8,438,838 1,561,600 1,887,863 3,407,433 1,441,326 1,441,326 3,973,212 847,989 2,601,620 2,154,864 2014 Q1 Q2 Q3 Q4 2014 Q1 Q2 Q3 Q4 2014 Q1 Q2 Q3 Q4
  • 5. Cash Outflow 2013-2014 Item Description Months % Amount M1 M2 M3 M4 M5 M6 M7 M8 M9 M10 M11 M12 Construction Cost 1 Earthworks 1 4.3% 865,600.00 865,600.00 2 Foundation 3 8.7% 1,731,200.00 577,066.67 577,066.67 577,066.67 3 RC Framework 9 21.7% 4,328,000.00 480,888.89 480,888.89 480,888.89 480,888.89 480,888.89 480,888.89 480,888.89 480,888.89 480,888.89 4 Walls, Doors & Window Frame 7 13.0% 2,596,800.00 370,971.43 370,971.43 370,971.43 370,971.43 370,971.43 5 Roofing, Elec Wiring & Plumbing 7 13.0% 2,596,800.00 370,971.43 370,971.43 370,971.43 6 Internal & External Plastering 8 13.0% 2,596,800.00 324,600.00 7 Sewerage Works 5 4.3% 865,600.00 8 Drainage Works 6 4.3% 865,600.00 9 Roadworks 2 8.7% 1,731,200.00 10 Infrastructure Works 6 8.7% 1,731,200.00 TOTAL CONSTRUCTION COST 100.0% 19,908,800.00 Monthly Total Cash Outflow (Before Retention) 1,442,666.67 577,066.67 1,057,955.56 480,888.89 480,888.89 480,888.89 851,860.32 851,860.32 1,222,831.75 1,222,831.75 1,547,431.75 Monthly Cumulative Outflow (Before Retention) 1,442,666.67 2,019,733.33 3,077,688.89 3,558,577.78 4,039,466.67 4,520,355.56 5,372,215.87 6,224,076.19 7,446,907.94 8,669,739.68 10,217,171.43 Less Retention (10%, Limit 5%) (995,440.00) (144,266.67) (57,706.67) (105,795.56) (48,088.89) (48,088.89) (48,088.89) (85,186.03) (85,186.03) (122,283.17) (122,283.17) (128,466.03) Monthly Cumulative Outflow (After Retention) 1,298,400.00 1,962,026.67 2,971,893.33 3,510,488.89 3,991,377.78 4,472,266.67 5,287,029.84 6,138,890.16 7,324,624.76 8,547,456.51 10,088,705.40 Monthly Total Cash Outflow (After Retention) 18,047,760.00 1,298,400.00 519,360.00 952,160.00 432,800.00 432,800.00 432,800.00 766,674.29 766,674.29 1,100,548.57 1,100,548.57 1,418,965.71 Item Description Months % Amount M1 M2 M3 M4 M5 M6 M7 M8 M9 M10 M11 M12 Construction Cost 1 Earthworks 1 4.3% 865,600.00 2 Foundation 3 8.7% 1,731,200.00 3 RC Framework 9 21.7% 4,328,000.00 4 Walls, Doors & Window Frame 7 13.0% 2,596,800.00 370,971.43 370,971.43 5 Roofing, Elec Wiring & Plumbing 7 13.0% 2,596,800.00 370,971.43 370,971.43 370,971.43 370,971.43 6 Internal & External Plastering 8 13.0% 2,596,800.00 324,600.00 324,600.00 324,600.00 324,600.00 324,600.00 324,600.00 324,600.00 7 Sewerage Works 5 4.3% 865,600.00 173,120.00 173,120.00 173,120.00 173,120.00 173,120.00 8 Drainage Works 6 4.3% 865,600.00 144,266.67 144,266.67 144,266.67 144,266.67 144,266.67 144,266.67 9 Roadworks 2 8.7% 1,731,200.00 865,600.00 10 Infrastructure Works 6 8.7% 1,731,200.00 288,533.33 288,533.33 288,533.33 288,533.33 288,533.33 288,533.33 TOTAL CONSTRUCTION COST 100.0% 19,908,800.00 Monthly Total Cash Outflow (Before Retention) 1,066,542.86 1,066,542.86 695,571.43 695,571.43 613,133.33 757,400.00 757,400.00 605,920.00 605,920.00 605,920.00 317,386.67 1,038,720.00 Monthly Cumulative Outflow (Before Retention) 11,283,714.29 12,350,257.14 13,045,828.57 13,741,400.00 14,354,533.33 15,111,933.33 15,869,333.33 16,475,253.33 17,081,173.33 17,687,093.33 18,004,480.00 19,043,200.00 Less Retention (10%, Limit 5%) (995,440.00) Monthly Cumulative Outflow (After Retention) 11,283,714.29 12,350,257.14 13,045,828.57 13,741,400.00 14,354,533.33 15,111,933.33 15,869,333.33 16,475,253.33 17,081,173.33 17,687,093.33 18,004,480.00 19,043,200.00 Monthly Total Cash Outflow (After Retention) 18,047,760.00 1,066,542.86 1,066,542.86 695,571.43 695,571.43 613,133.33 757,400.00 757,400.00 605,920.00 605,920.00 605,920.00 317,386.67 1,038,720.00 2013 Q1 Q2 Q3 Q4 2014 Q1 Q2 Q3 Q4
  • 6. Cash Outflow 2015-2016 Item Description Months % Amount M1 M2 M3 M4 M5 M6 M7 M8 M9 M10 M11 M12 Construction Cost 1 Earthworks 1 4.3% 865,600.00 2 Foundation 3 8.7% 1,731,200.00 3 RC Framework 9 21.7% 4,328,000.00 4 Walls, Doors & Window Frame 7 13.0% 2,596,800.00 5 Roofing, Elec Wiring & Plumbing 7 13.0% 2,596,800.00 6 Internal & External Plastering 8 13.0% 2,596,800.00 7 Sewerage Works 5 4.3% 865,600.00 8 Drainage Works 6 4.3% 865,600.00 9 Roadworks 2 8.7% 1,731,200.00 865,600.00 10 Infrastructure Works 6 8.7% 1,731,200.00 TOTAL CONSTRUCTION COST 100.0% 19,908,800.00 Monthly Total Cash Outflow (Before Retention) 865,600.00 - - - - - - - - - - - Monthly Cumulative Outflow (Before Retention) 19,908,800.00 19,908,800.00 19,908,800.00 19,908,800.00 19,908,800.00 19,908,800.00 19,908,800.00 19,908,800.00 19,908,800.00 19,908,800.00 19,908,800.00 19,908,800.00 Less Retention (10%, Limit 5%) (995,440.00) 497,720.00 Monthly Cumulative Outflow (After Retention) 20,406,520.00 20,406,520.00 20,406,520.00 20,406,520.00 20,406,520.00 20,406,520.00 20,406,520.00 20,406,520.00 20,406,520.00 20,406,520.00 20,406,520.00 20,406,520.00 Monthly Total Cash Outflow (After Retention) 18,047,760.00 1,363,320.00 Item Description Months % Amount M1 M2 M3 M4 M5 M6 Construction Cost 1 Earthworks 1 4.3% 865,600.00 2 Foundation 3 8.7% 1,731,200.00 3 RC Framework 9 21.7% 4,328,000.00 4 Walls, Doors & Window Frame 7 13.0% 2,596,800.00 5 Roofing, Elec Wiring & Plumbing 7 13.0% 2,596,800.00 6 Internal & External Plastering 8 13.0% 2,596,800.00 7 Sewerage Works 5 4.3% 865,600.00 8 Drainage Works 6 4.3% 865,600.00 9 Roadworks 2 8.7% 1,731,200.00 10 Infrastructure Works 6 8.7% 1,731,200.00 TOTAL CONSTRUCTION COST 100.0% 19,908,800.00 Monthly Total Cash Outflow (Before Retention) - - - - - - Monthly Cumulative Outflow (Before Retention) 19,908,800.00 19,908,800.00 19,908,800.00 19,908,800.00 19,908,800.00 19,908,800.00 Less Retention (10%, Limit 5%) (995,440.00) 497,720.00 Monthly Cumulative Outflow (After Retention) 20,406,520.00 20,406,520.00 20,406,520.00 20,406,520.00 20,406,520.00 20,406,520.00 Monthly Total Cash Outflow (After Retention) 18,047,760.00 497,720.00 2015 Q1 Q2 Q3 Q1 Q2 2016 Q4
  • 7. Quarter Yearly Cash Flow 2010-2012 Item Description Amount (RM) Q1 Q2 Q3 Q4 Q1 Q2 Q3 Q4 Q1 Q2 Q3 Q4 A CASH INFLOW 1 Bank Loan for Land Purchase 6,500,000.00 6,500,000.00 2 Sales Projection 55,068,750.00 Total Cash Inflow 61,568,750.00 6,500,000.00 - - - - - - - - - - - Cumulative Cash Inflow 6,500,000.00 6,500,000.00 6,500,000.00 6,500,000.00 6,500,000.00 6,500,000.00 6,500,000.00 6,500,000.00 6,500,000.00 6,500,000.00 6,500,000.00 6,500,000.00 Item Description Amount (RM) Q1 Q2 Q3 Q4 Q1 Q2 Q3 Q4 Q1 Q2 Q3 Q4 B CASH OUTFLOW 1 Land Cost 6,738,187.50 6,738,187.50 2 Construction Cost 19,908,800.00 3 Repayment of Land Loan 6,500,000.00 Administrative Cost 4 Professional Fees 1,791,792.00 5 Administrative Fees 1,101,375.00 6 Plan Fees 396,000.00 7 Contribution & Fees 398,176.00 8 Advertising & Marketing 550,687.50 9 Conversion Premium:- a) Commercial 125,400.00 b) Residential 513,000.00 c) Subdivision 297,000.00 d) Legal Fees 495,000.00 Financing Cost 10 Interest on Bridging Finance 2,389,056.00 11 Interest on Land Loan 2,925,000.00 12 Contigencies 995,440.00 Total Cash Outflow 45,124,914.00 6,738,187.50 - - - - - - - - - - - Cumulative Cash Outflow 6,738,187.50 6,738,187.50 6,738,187.50 6,738,187.50 6,738,187.50 6,738,187.50 6,738,187.50 6,738,187.50 6,738,187.50 6,738,187.50 6,738,187.50 6,738,187.50 2010 2011 2012 2010 2011 2012
  • 8. QuarterYearly Cash Flow2013-2015 Item Description Amount (RM) Q1 Q2 Q3 Q4 Q1 Q2 Q3 Q4 Q1 Q2 A CASHINFLOW 1 Bank Loanfor LandPurchase 6,500,000.00 2 Sales Projection 55,068,750.00 13,314,400.00 9,212,390.00 11,194,865.00 5,110,380.00 11,194,865.00 2,016,740.00 3,025,110.00 TotalCash Inflow 61,568,750.00 13,314,400.00 - 9,212,390.00 11,194,865.00 5,110,380.00 11,194,865.00 2,016,740.00 3,025,110.00 - - Cumulative Cash Inflow 19,814,400.00 19,814,400.00 29,026,790.00 40,221,655.00 45,332,035.00 56,526,900.00 58,543,640.00 61,568,750.00 61,568,750.00 61,568,750.00 Item Description Amount (RM) Q1 Q2 Q3 Q4 Q1 Q2 Q3 Q4 Q1 Q2 B CASHOUTFLOW 1 LandCost 6,738,187.50 2 ConstructionCost 19,908,800.00 2,019,733.33 2,019,733.33 2,184,609.52 3,993,095.24 2,828,657.14 2,066,104.76 1,969,240.00 1,962,026.67 865,600.00 3 Repayment of LandLoan 6,500,000.00 6,500,000.00 Administrative Cost 4 Professional Fees 1,791,792.00 1,075,075.20 358,358.40 358,358.40 5 Administrative Fees 1,101,375.00 137,671.88 137,671.88 137,671.88 137,671.88 137,671.88 137,671.88 137,671.88 137,671.88 6 PlanFees 396,000.00 396,000.00 7 Contribution& Fees 398,176.00 398,176.00 8 Advertising& Marketing 550,687.50 68,835.94 68,835.94 68,835.94 68,835.94 68,835.94 68,835.94 68,835.94 68,835.94 9 ConversionPremium:- a)Commercial 125,400.00 125,400.00 b)Residential 513,000.00 513,000.00 c)Subdivision 297,000.00 297,000.00 d)Legal Fees 495,000.00 495,000.00 Financing Cost 10 Interest onBridgingFinance 2,389,056.00 298,632.00 298,632.00 298,632.00 298,632.00 298,632.00 298,632.00 298,632.00 298,632.00 11 Interest onLandLoan 2,925,000.00 365,625.00 365,625.00 365,625.00 365,625.00 365,625.00 365,625.00 365,625.00 365,625.00 12 Contigencies 995,440.00 124,430.00 124,430.00 124,430.00 124,430.00 124,430.00 124,430.00 124,430.00 124,430.00 TotalCash Outflow 45,124,914.00 5,650,322.35 3,014,928.15 3,179,804.34 4,988,290.05 4,182,210.36 3,061,299.57 2,964,434.81 9,457,221.48 1,888,215.40 - Cumulative Cash Outflow 12,388,509.85 15,403,437.99 18,583,242.33 23,571,532.38 27,753,742.73 30,815,042.31 33,779,477.12 43,236,698.60 45,124,914.00 45,124,914.00 2013 2014 2015 2015 2013 2014
  • 9. 2.3 Net Present Value PV = 1/(1+i)^n Year Quarter Quarterly Inflow Quarterly Outflow Net Cash Flow PV Factor (12%) NPV Q1 6,500,000.00 (6,738,187.50) (238,187.50) 0.972 (231,533.83) Q2 - - - 0.945 - Q3 - - - 0.919 - Q4 - - - 0.893 - Q1 - - - 0.868 - Q2 - - - 0.844 - Q3 - - - 0.820 - Q4 - - - 0.797 - Q1 - - - 0.775 - Q2 - - - 0.753 - Q3 - - - 0.732 - Q4 - - - 0.712 - Q1 13,314,400.00 (5,650,322.35) 7,664,077.65 0.692 5,302,752.07 Q2 - (3,014,928.15) (3,014,928.15) 0.673 (2,027,747.56) Q3 9,212,390.00 (3,179,804.34) 6,032,585.66 0.654 3,943,990.97 Q4 11,194,865.00 (4,988,290.05) 6,206,574.95 0.636 3,944,390.59 Q1 5,110,380.00 (4,182,210.36) 928,169.64 0.618 573,390.86 Q2 11,194,865.00 (3,061,299.57) 8,133,565.43 0.601 4,884,272.24 Q3 2,016,740.00 (2,964,434.81) (947,694.81) 0.584 (553,200.92) Q4 3,025,110.00 (9,457,221.48) (6,432,111.48) 0.567 (3,649,752.79) Q1 - (1,888,215.40) (1,888,215.40) 0.552 (1,041,494.35) Q2 - - - 0.536 - Q3 - - - 0.521 - Q4 - - - 0.507 - Q1 - - - 0.492 - Q2 - (497,720.00) (497,720.00) 0.479 (238,269.22) Q3 - - - 0.465 - Q4 - - - 0.452 - 15,946,115.99 10,906,798.06Total 2010 2016 2015 2014 2013 2012 2011
  • 10. 2.4 Build-then-sell Concept ‘Build- then- Sell’ concept in property market known as a project will only open for sales after the issuance of Certificate of Completion and Compliance (CCC). ‘Build- then Sell’ concept is the new concept introduced by the Government to the developers. However, developers have their own decision to choose whether to carry out ‘Build- then Sell’ or ‘Sell- then- Build’ because the cash flow faced by the developer could be different. There are two types of ‘Build- then- Sell’ which are 100% ‘Build- then- Sell’ with CCC and ‘Build- then- Sell’ 10:90 formula. The figure 5.1 shows the graph 100% ‘Build- then- Sell’ with CCC. Figure 5.1 Cash Flow of 100% ‘Build- then- Sell’ with CCC Based on the figure 5.1, the developer do not receive any payment from the purchasers to fund the construction costs or to repay the bridging loans secured by the developer from point A to point C which is during the construction stage. In this case, during the construction
  • 11. stage the developer will face serious financial problems which is the negative cash flow. Thus, the developer has to borrow loans which is the short-term and long-term loan from the bank to cover current obligations by providing immediate cash flow due to the zero cash inflows during the construction stage. At point C, sales only can launched at this time where the project has been completed and issuance by the Certificate of Completion and Compliance (CCC) which allow the purchasers to buy the property first with the payment of 10% of selling price upon signing the sale and purchase agreement. However, the break-even point of cash inflow and outflow for the developer will not meet at this point yet because the net inflows may need longer time to move into profit account where the other 90% of the payment from each purchaser will be paid after3 months from the date of signing sales and purchase agreement with another 1 month extension. In additional, the developer has to ensure that all of the property or housing that has been constructed able to sell out as soon as possible so that they are able to pay the debt to bank to avoid the charge of interest. Once there are the property or housing weren’t sell out yet then the developer is consider loss of profits. The `Build- then- Sell’ with 10:90 formula is where the buyers only required to pay 10% of the total amount of the selling price to the stakeholder as proposed by the Housing Buyers Association (HBA). The 10% payment made by the buyers can be assumed as the booking fees for their selection of property or housing based on their favored. After that, the buyers will not require to make any payment during the construction stage until the issuance of Certificate of Completion and Compliance has been issued only the buyers required to pay the remaining 90% of the selling price of the property. Based on National House Buyer Association (HBA), developer who wanted to adopt this Build then Sell 10:90 formula will be exempted from paying Rm200, 000 deposit for a housing development license. The ‘Build- then –Sell’ concept could bring advantages to the buyers, bank and developer. The main advantage of `Build- then- Sell’ to the buyers is they can avoid from buying properties or houses that might be abandoned during the construction period and property or housing that could not complete at the time as promised and caused major delay problems. If this situation happened, it could decrease the reputation of the developer and the
  • 12. the buyers will losses their trusts on the developer and avoid buying property or housing from the developer. Next, ‘Build- then- Sell’ concept able for the buyers to view the completed design and construction of the houses to make sure the final products are able to reach the satisfaction from the buyers. This is because the design before completion as advertisement might be different from the actual completion design. Buyers also able to examine the quality of the housing in term of finishing, specification and etc. and workmanship during construction the housing project. In financial aspect, buyers only required to pay after the issuance of Certificate of Completion and Compliance to the housing which could increase the confidence of the buyers on purchasing the property or housing. The advantage could be found between the developer and buyers where the developer has the ability to accommodate the specific property or housing that based on the demands and needs from the buyers. Before the completion or during the construction of a project, the buyers may want certain finishes, specifications and design to the property or housing so the developer can conduct a survey to conclude the decision and meet most of the buyer satisfaction which could highly increase the demand of the property or housing. After that, there are advantages for the developer from the government to encourage and helps in decrease financial burden of the developer to who implement the ‘Build- then- Sell’ concept. There are four types of incentives by government to the developer which are:  The banking institution to be given tax exemption on interest income received from the rescuing contractor or developer.  Developer be given a double deduction on interest paid and all direct costs incurred in obtaining loans.  Contractor be given stamp duty exemption on all instruments executed for the purpose of transfer of land or house.
  • 13.  Loan agreements to finance the cost of revival and original house buyer in abandoned project be given stamp duty exemption on all instruments executed for the purpose of obtaining additional finance and the transfer of the house. Lastly, there are advantages for the bank because there are required of bank loan by developer to run or develop the property or housing based on ‘Build- then- Sell’ concept. This allow the bank to gain more interest profits when they released the high amount of loan to the developer. In conclusion, the cash flow of ‘Build- then Sell’ seen like not a good sight for the developer where the developer may faces a lot of financial issues and the developer may need a sufficient or high amount of capital to kick start a construction. However, the implement of `Build- then-Sell’ concept able to provide benefits to the developer, buyers, banker so it is highly recommend to implement the concept of ‘Build- then- Sell’ in a country.