Visiongain launches new report - Top 20 pharmaceutical wholesale & distribution organizations 2018
•
0 likes•13 views

Visiongain launches new report - Top 20 pharmaceutical wholesale & distribution organizations 2018: Branded Drugs, Generic Drugs, Leading Companies For the TOC click on : https://www.visiongain.com/report/top-20-pharmaceutical-wholesale-distribution-organizations-2018/ Please contact abhi.ambi@visiongain.com for a report overview.

Recommended
Recommended
More Related Content
What's hot
What's hot (17)
Similar to Visiongain launches new report - Top 20 pharmaceutical wholesale & distribution organizations 2018
Similar to Visiongain launches new report - Top 20 pharmaceutical wholesale & distribution organizations 2018 (20)
Recently uploaded
Recently uploaded (20)
Visiongain launches new report - Top 20 pharmaceutical wholesale & distribution organizations 2018
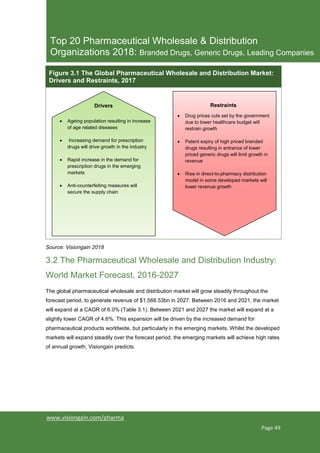
- 1. www.visiongain.com/pharma Page 49 Top 20 Pharmaceutical Wholesale & Distribution Organizations 2018: Branded Drugs, Generic Drugs, Leading Companies Figure 3.1 The Global Pharmaceutical Wholesale and Distribution Market: Drivers and Restraints, 2017 3.2 The Pharmaceutical Wholesale and Distribution Industry: World Market Forecast, 2016-2027 The global pharmaceutical wholesale and distribution market will grow steadily throughout the forecast period, to generate revenue of $1,568.53bn in 2027. Between 2016 and 2021, the market will expand at a CAGR of 6.0% (Table 3.1). Between 2021 and 2027 the market will expand at a slightly lower CAGR of 4.6%. This expansion will be driven by the increased demand for pharmaceutical products worldwide, but particularly in the emerging markets. Whilst the developed markets will expand steadily over the forecast period, the emerging markets will achieve high rates of annual growth, Visiongain predicts. Source: Visiongain 2018 Drivers Restraints • Drug prices cuts set by the government due to lower healthcare budget will restrain growth • Patent expiry of high priced branded drugs resulting in entrance of lower priced generic drugs will limit growth in revenue • Rise in direct-to-pharmacy distribution model in some developed markets will lower revenue growth • Ageing population resulting in increase of age related diseases • Increasing demand for prescription drugs will drive growth in the industry • Rapid increase in the demand for prescription drugs in the emerging markets • Anti-counterfeiting measures will secure the supply chain
- 2. www.visiongain.com/pharma Page 53 Top 20 Pharmaceutical Wholesale & Distribution Organizations 2018: Branded Drugs, Generic Drugs, Leading Companies As a result of this generic substitution, the wholesale and distribution generic drugs will steadily increase over the course of the forecast period (Table 3.2). In 2021, generic drugs will account for 22.7% of the market. In 2027, generic drugs will account for 29.5% of the market. The use of generic drugs will increase over the forecast period, encouraged by government pricing pressures in developed countries. The market for other services provided by pharmaceutical wholesalers and distributors will increase gradually over the forecast period. In 2027, this business segment will claim a market share of 4.0%, an increase from 3.4% on 2016 market share. Technological solutions offered by wholesalers and distributors will be increasingly employed by customers over the forecast period in an effort to keep inventory management costs down and services efficient. In 2027, this sector will generate revenue of $61.96bn. Figure 3.4 Branded Drugs, Generic Drugs and Others: Market Shares (%), 2021 Source: Visiongain 2018
- 3. www.visiongain.com/pharma Page 135 Top 20 Pharmaceutical Wholesale & Distribution Organizations 2018: Branded Drugs, Generic Drugs, Leading Companies 4.8.1 Alfresa Holdings: Historical Performance, 2011-2017 During the historical period 2011 to 2017, Alfresa Holdings saw positive increase in revenue with consolidated sales of ¥2,183.4bn ($27.6bn) in 2011 to ¥2,551.8bn ($22.7bn) in 2017. The highest growth rate attained in this period was 6.9% in 2012 (Table 4.43 and Figure 4.31). The fiscal year 2014 which ended on March 31, 2015 was the first year of the “13-15 Medium-term Management Plan – Advancement and Expansion-Next Stage”. During FY2014 year, Alfresa Holding’s operations generated total revenue of ¥2,504.5bn ($22.78bn), an increase of 4.9% from the previous year. Of this revenue, gross profit amounted to ¥171.54bn ($1.56bn. However, in 2015 growth decreased by -3.3% and gross profit decreased at the same rate. This new management plan will come to fruition and impact the company positively in the next year and will be ending in the fiscal year 2016. The aim of this medium-term plan is to attain 2.6 trillion by 2016 with operating margin more than 1.0%. In addition, the company generated revenue of ¥2,576.41bn ($22.86bn) with growth of 6.4% in the year ended March 31, 2016, demonstrating recovery and growth from declining revenues. In the fiscal year 2015, company formulated new management policy named “Challenge3” to anticipate environmental changes involving internal reforms. Table 4.43 Alfresa Holdings: Historical Revenue (¥bn, $bn), Revenue AGR (%), Revenue CAGR (%), Gross Profit (¥bn, $bn), Gross Profit AGR (%) and Gross Profit CAGR (%), 2011-2017 2011 2012 2013 2014 2015 2016 2017 Revenue ($bn) 27.6 28.1 23.8 22.8 19.2 22.9 22.7 Revenue (¥bn) 2,183.4 2,333.3 2,387.5 2,504.5 2,421.2 2,576.4 2,551.8 Annual Revenue Growth (%) 6.9% 2.3% 4.9% -3.3% 6.4% -1.0% CAGR 2011-2017 2.6% Gross Profit ($bn) 1.8 1.7 1.6 1.6 1.3 1.8 1.6 Gross Profit (¥bn) 143.1 144.0 159.4 171.5 165.8 197.2 182.6 Gross Profit Annual Growth% 0.6% 10.6% 7.6% -3.3% 18.9% -7.4% CAGR 2011-2017 4.1% Source: Visiongain 2018, Alfresa Holdings Annual Report Alfresa Holdings reports their financial data in Japanese Yen (¥). Therefore, for the purpose of this report the annual growth rate were calculated using the revenue value in Japanese Yen (¥) to portray true historical trend. However, we have also included corresponding historical revenue in US Dollars ($). Please note all future forecasts are in US Dollars ($).