1. 1. Channel Analysis:
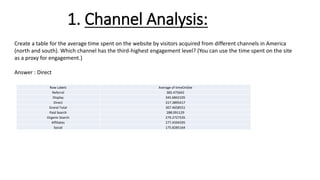
Create a table for the average time spent on the website by visitors acquired from different channels in America
(north and south). Which channel has the third-highest engagement level? (You can use the time spent on the site
as a proxy for engagement.)
Answer : Direct
Row Labels Average of timeOnSite
Referral 385.475642
Display 345.6842105
Direct 317.3895417
Grand Total 307.4658551
Paid Search 288.091129
Organic Search 279.2727535
Affiliates 277.4594595
Social 175.8285164
2. Create a table for the conversion rates of the customers acquired from different channels in
America (north and south). Which channel bring in the highest intent customers?
Answer: Display
Row Labels Count of bounces
Display 266
Affiliates 278
Paid Search 720
Referral 1587
Social 1620
Direct 3565
Organic Search 7538
Grand Total 15574
3. Which channel brings in the highest percentage of new visitors?
Answer : Organic Search
Row Labels Count of newVisits %
Organic Search 13751 52%
Direct 5400 20%
Referral 2951 11%
Social 2397 9%
Paid Search 1283 5%
Affiliates 399 2%
Display 254 1%
4. 2. Visitor tenure vs other metrics:
Does the engagement of the customers from America (north and south) increase with the number of
visits to the website? (You can use the time spent on the site as a proxy for engagement. Use a filter on
the number of visits and analyze the data for the first 10 visits)