Download to read offline
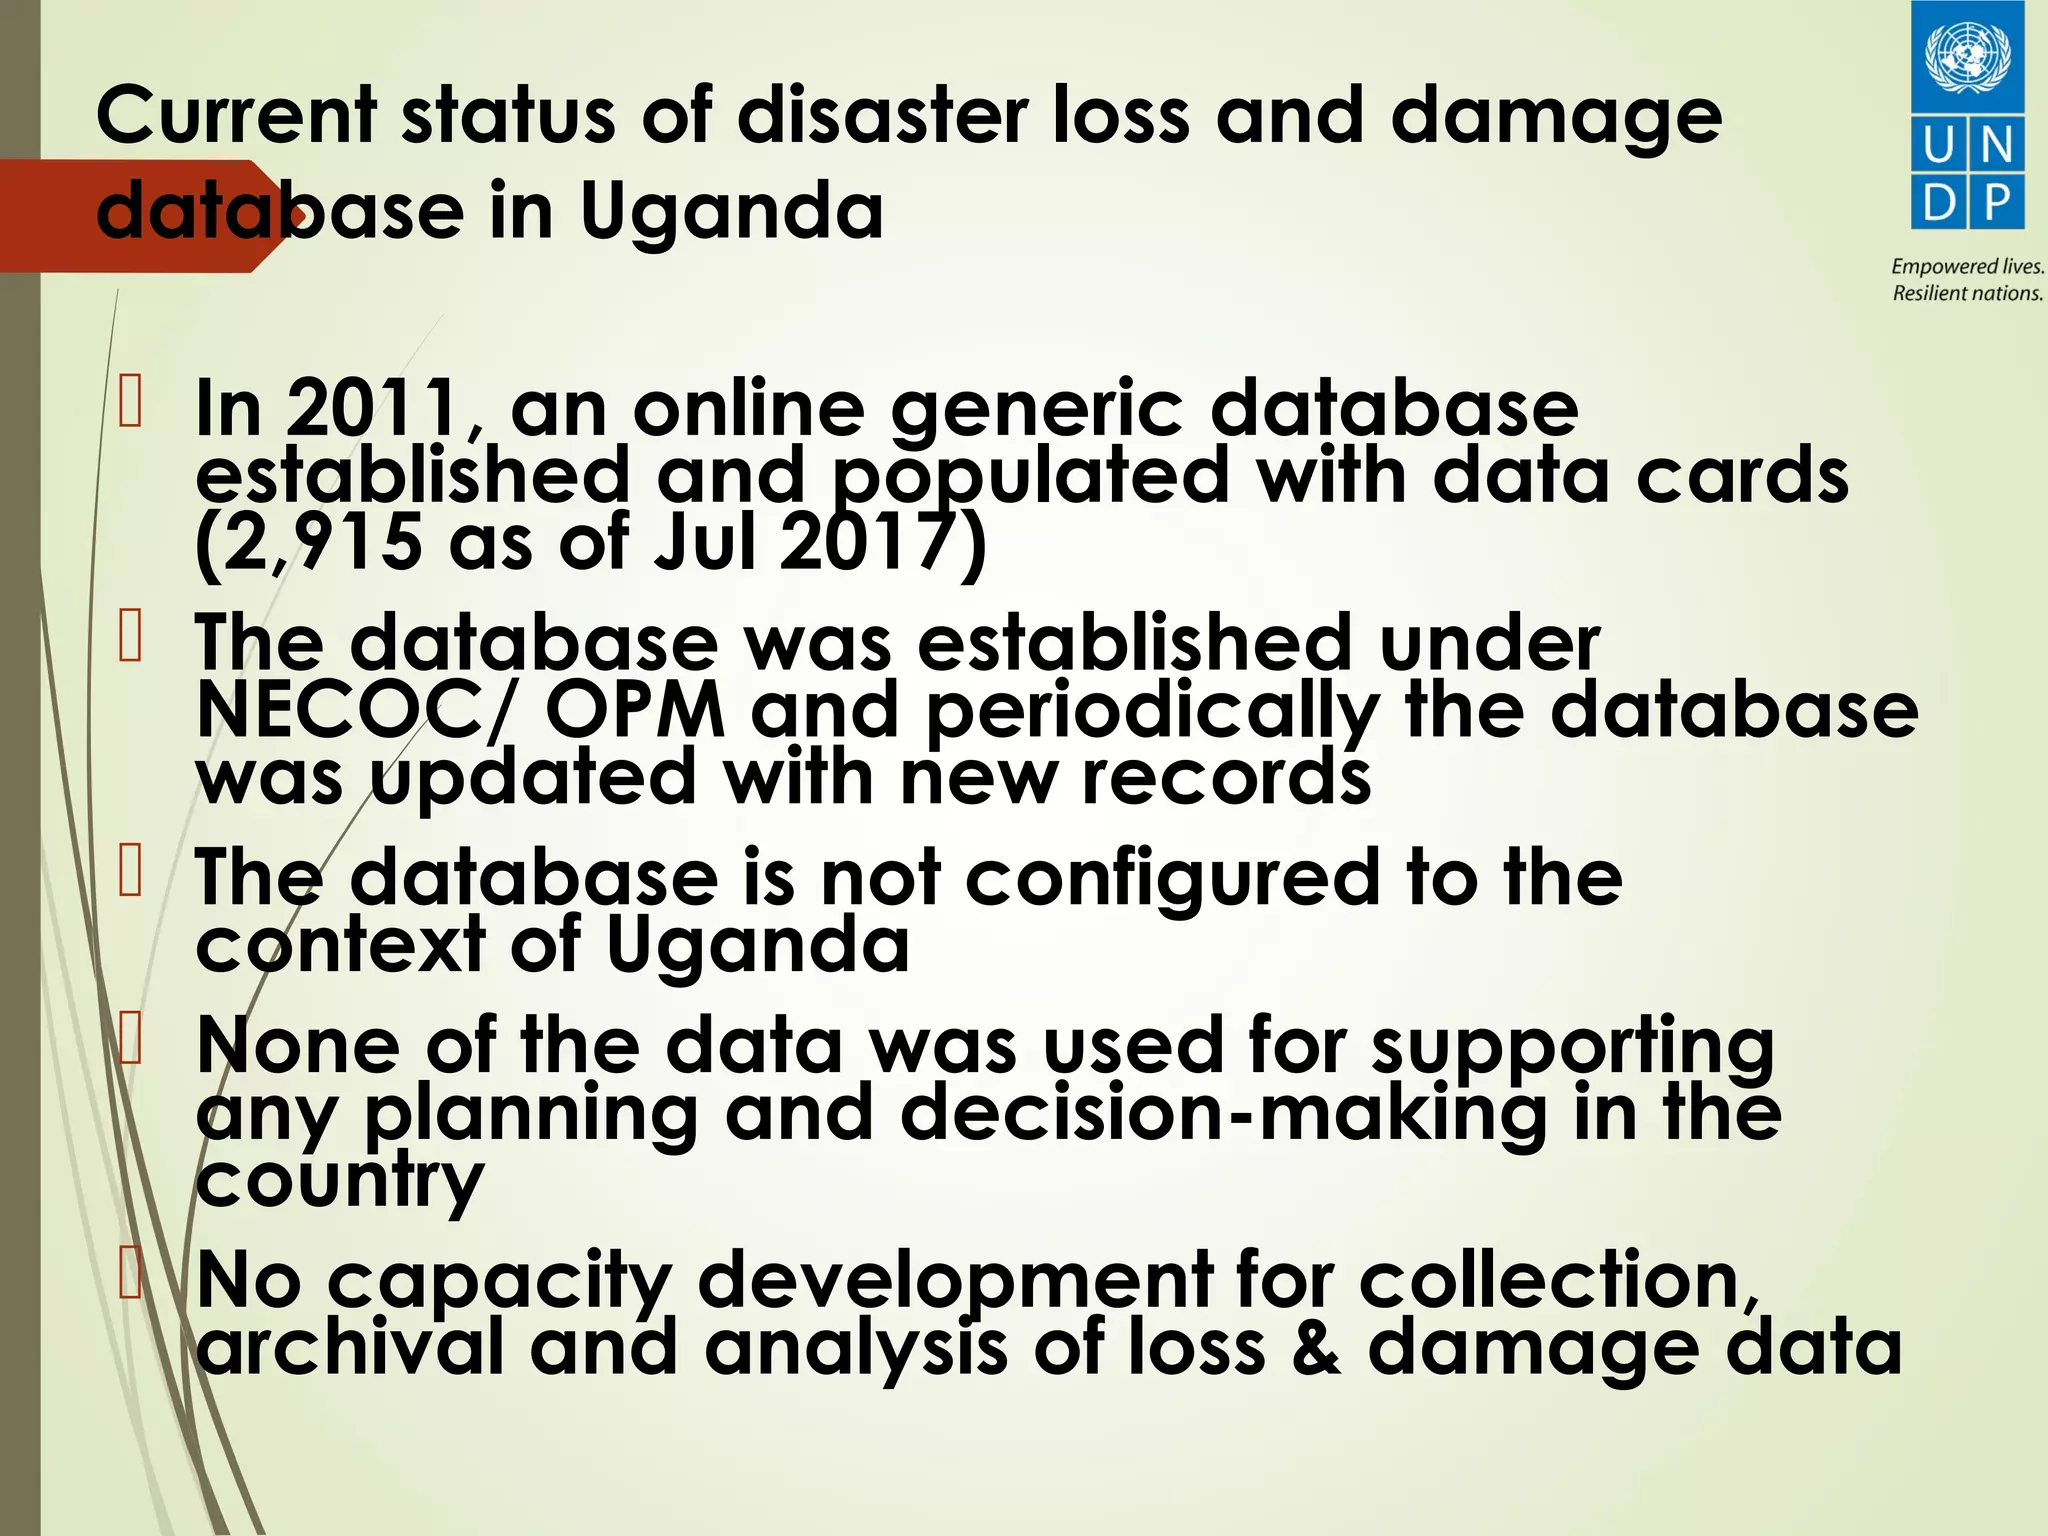
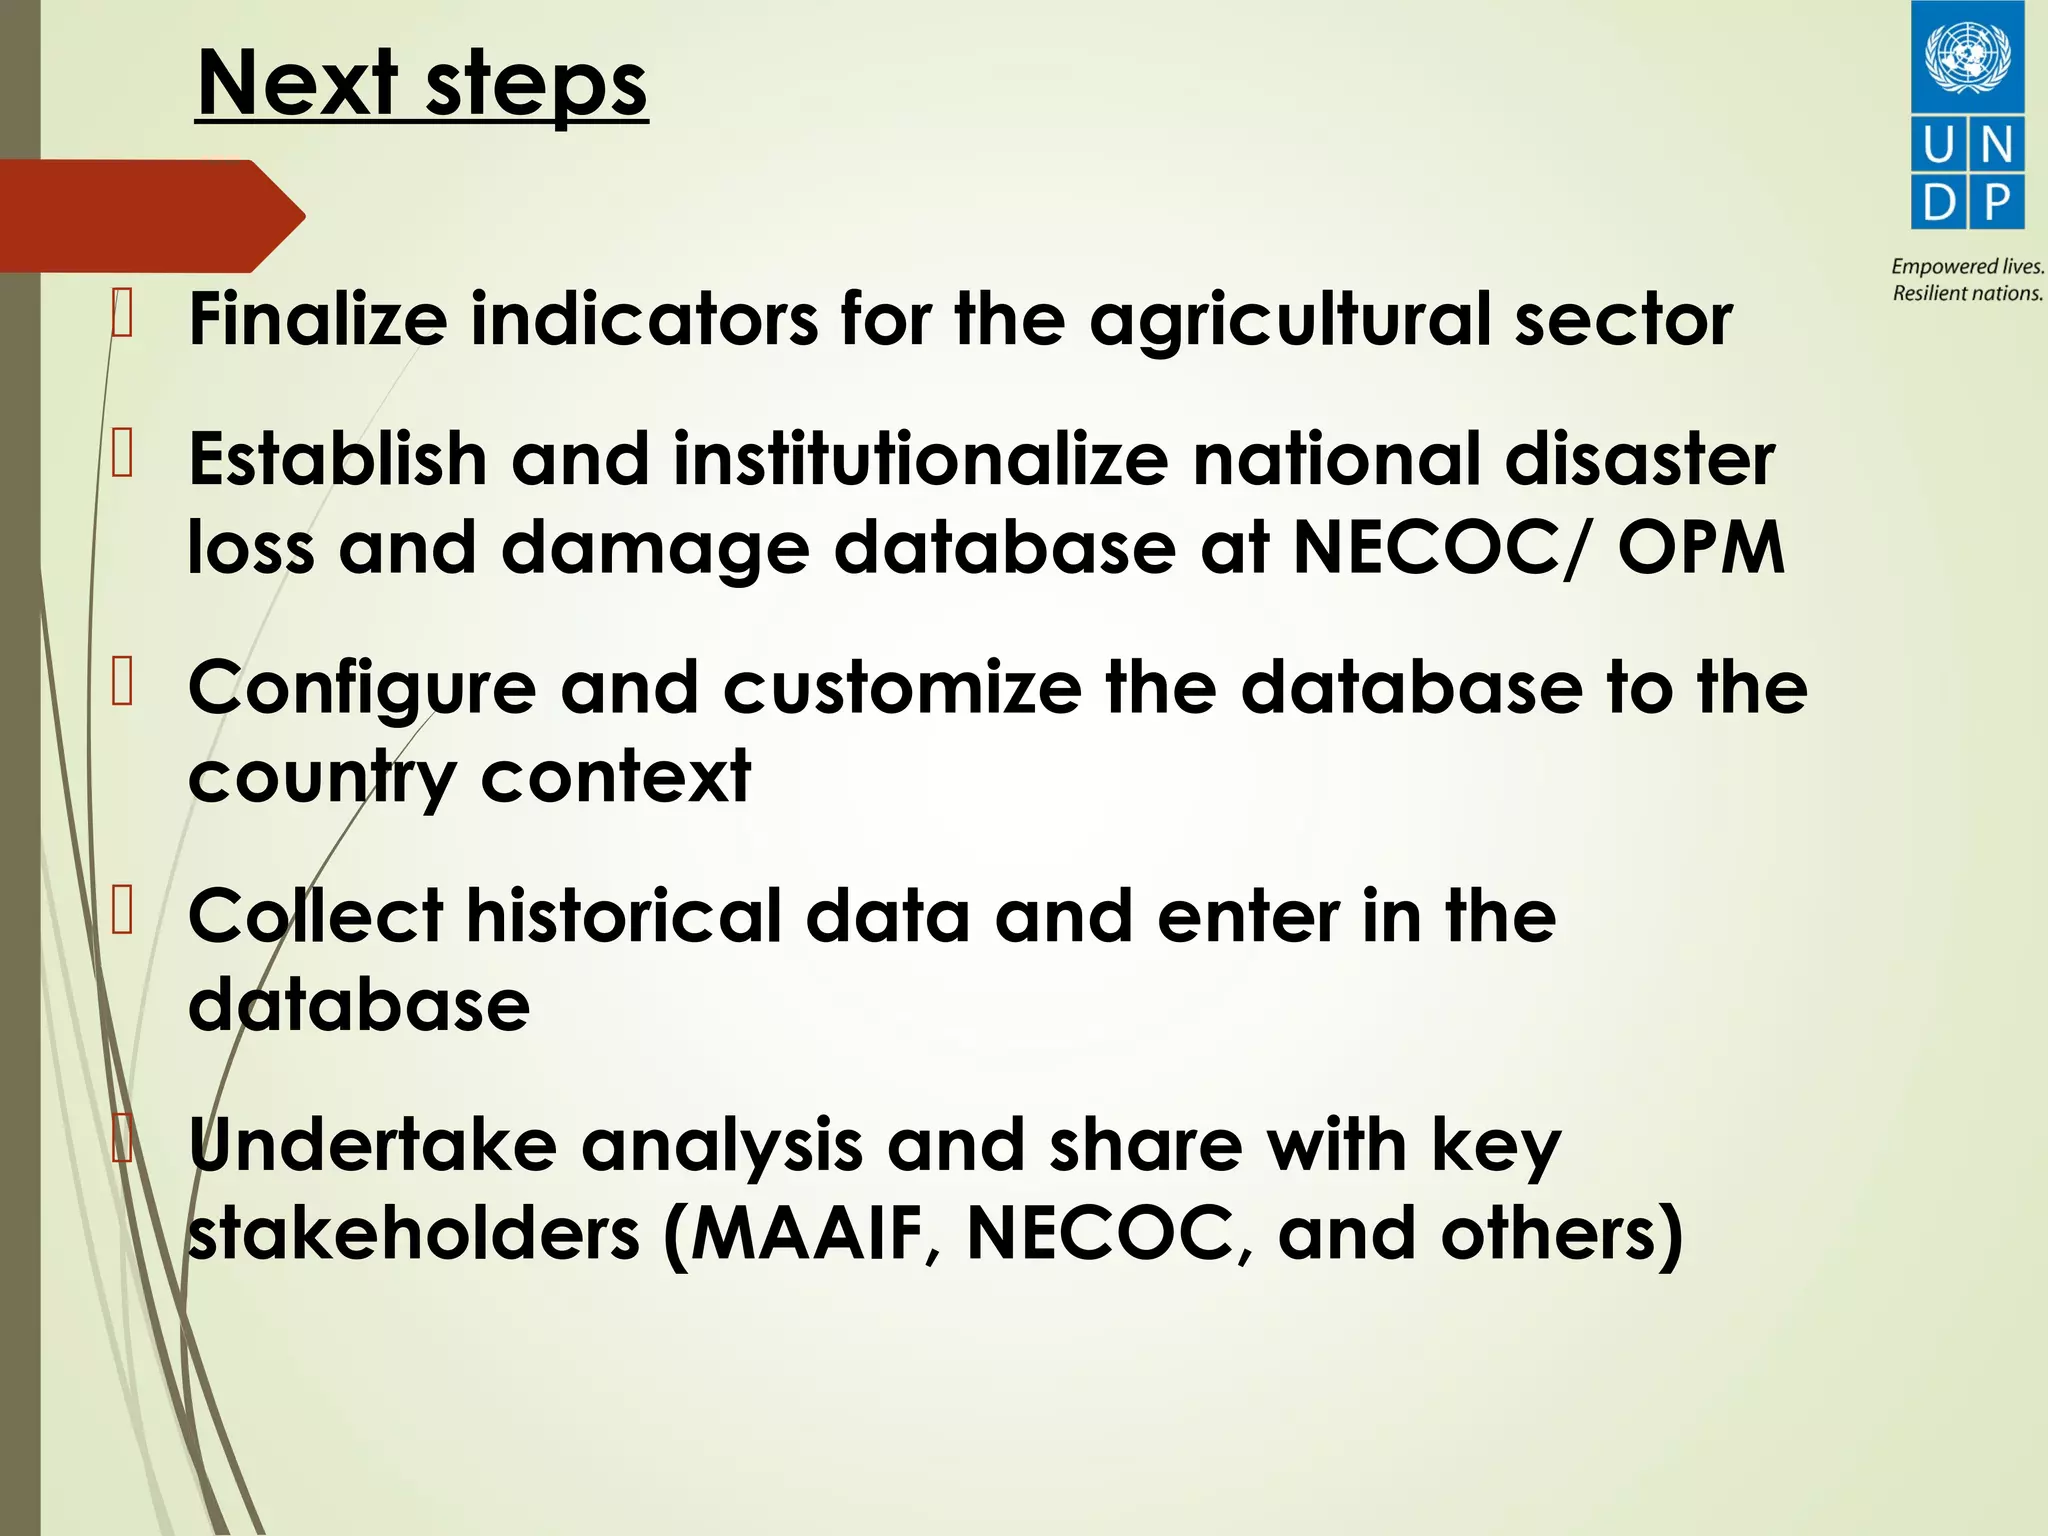


The document outlines a presentation by Rajesh Sharma on integrating agriculture-related indicators into the disaster loss and damage database in Uganda. It discusses the current status of this database, highlighting its establishment in 2011, lack of local adaptation, and insufficient utilization for planning. Next steps include finalizing agricultural indicators, customizing the database, and analyzing historical data for stakeholder sharing.


![[Mohan Singh]shrsogiheriughsierughsiuerg.ppt](https://cdn.slidesharecdn.com/ss_thumbnails/session2-1-2mohansingh-250410112452-296bdb8a-thumbnail.jpg?width=640&height=640&fit=bounds)


