1. Office Snapshot Q1 2016
Hanoi,Vietnam
MARKETBEAT
Economic Indicators
Market Indicators – Grade A
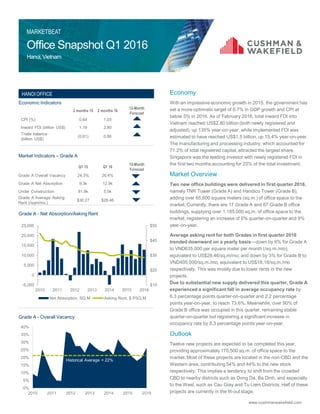
Grade A - Net Absorption/Asking Rent
Grade A - Overall Vacancy
www.cushmanwakefield.com
Economy
With an impressive economic growth in 2015, the government has
set a more optimistic target of 6.7% in GDP growth and CPI at
below 5% in 2016. As of February 2016, total inward FDI into
Vietnam reached US$2.80 billion (both newly registered and
adjusted), up 135% year-on-year, while implemented FDI was
estimated to have reached US$1.5 billion, up 15.4% year-on-year.
The manufacturing and processing industry, which accounted for
71.2% of total registered capital, attracted the largest share.
Singapore was the leading investor with newly registered FDI in
the first two months accounting for 23% of the total investment.
Market Overview
Two new office buildings were delivered in first quarter 2016,
namely TNR Tower (Grade A) and Handico Tower (Grade B),
adding over 65,600 square meters (sq.m.) of office space to the
market. Currently, there are 17 Grade A and 67 Grade B office
buildings, supplying over 1,185,000 sq.m. of office space to the
market, registering an increase of 6% quarter-on-quarter and 9%
year-on-year.
Average asking rent for both Grades in first quarter 2016
trended downward on a yearly basis—down by 6% for Grade A
to VND635,000 per square meter per month (/sq.m./mo),
equivalent to US$28.46/sq.m/mo; and down by 3% for Grade B to
VND405,000/sq.m./mo, equivalent to US$18.18/sq.m./mo
respectively. This was mostly due to lower rents in the new
projects.
Due to substantial new supply delivered this quarter, Grade A
experienced a significant fall in average occupancy rate by
6.3 percentage points quarter-on-quarter and 2.2 percentage
points year-on-year, to reach 73.6%. Meanwhile, over 90% of
Grade B office was occupied in this quarter, remaining stable
quarter-on-quarter but registering a significant increase in
occupancy rate by 8.3 percentage points year-on-year.
Outlook
Twelve new projects are expected to be completed this year,
providing approximately 170,500 sq.m. of office space to the
market. Most of these projects are located in the non-CBD and the
Western area, contributing 54% and 44% to the new stock
respectively. This implies a tendency to shift from the crowded
CBD to nearby districts such as Dong Da, Ba Dinh, and especially
to the West, such as Cau Giay and Tu Liem Districts. Half of these
projects are currently in the fit-out stage.
2 months 15 2 months 16
12-Month
Forecast
CPI (%) 0.64 1.03
Inward FDI (billion US$) 1.19 2.80
Trade balance
(billion US$)
(0.61) 0.86
Q1 15 Q1 16
12-Month
Forecast
Grade A Overall Vacancy 24.3% 26.4%
Grade A Net Absorption 9.3k 12.9k
Under Construction 81.8k 5.0k
Grade A Average Asking
Rent (/sqm/mo.)
$30.27 $28.46
0%
5%
10%
15%
20%
25%
30%
35%
40%
2010 2011 2012 2013 2014 2015 2016
HANOI OFFICE
Historical Average = 22%
$10
$20
$30
$40
$50
-5,000
0
5,000
10,000
15,000
20,000
25,000
2010 2011 2012 2013 2014 2015 2016
Net Absorption, SQ.M Asking Rent, $ PSQ.M
3. Retail Snapshot Q1 2016
Hanoi,Vietnam
MARKETBEAT
Economic Indicators
Market Indicators
Net Absorption/Asking Rent
Overall Vacancy
www.cushmanwakefield.com
Economy
Having achieved an impressive growth rate in 2015, the government
set a more optimistic GDP growth target of 6.7% and CPI at below
5% in 2016. As of February 2016, total inward FDI into Vietnam
reached US$2.80 billion (both newly registered and adjusted), up
135% year-on-year; while implemented FDI was estimated to have
reached US$1.5 billion, up 15.4% year-on-year. The manufacturing
and processing industry, which accounted for 71.2% of total
registered capital, attracted the largest share. Singapore was the
leading investor with newly registered FDI in the first two months,
accounting for 23% of total investment.
Market Overview
With no new retail centres entering the market in the first
quarter of 2016, overall supply remained stable quarter-on-quarter
but still higher by 23% year-on-year, at over 866,300 square meters
(sq.m.) of retail space from 49 projects. Non-CBD supply dominated
the market, accounting for nearly 97% of the market as land
available for development in the CBD remains limited.
The overall market performance continued to experience
gradual improvement, with vacancy rate down by 6 percentage
points year-on-year but unchanged on a quarterly basis at nearly
12% in first quarter 2016. There was an improvement in the CBD on
both a quarterly and yearly basis, with vacancy rate down 3
percentage points quarter-on-quarter and 1 percentage point year-
on-year to 2%, while Non-CBD reached 12%, down by 6% year-on-
year but remained unchanged on a quarterly basis.
The overall average asking rent saw a moderate decrease by nearly
1% quarter-on-quarter, but went up by 8.3% year-on-year, mostly
due to the high rents offered by new projects, reaching VND905,000
per square meter per month (/sq.m./mo) or US$40.6/sq.m./mo. In
terms of rent by location, the average rent in the CBD recorded at
VND2,647,000/sq.m./mo (US$118.7/sq.m./mo), triple those in the
Non-CBD. Average rents in both locations remained stable on a
quarterly basis, but down 6% and up 11% year-on-year,
respectively.
Outlook
Over 175,000 sq.m. of new supply is expected to be completed in
2016, of which nearly 30% of the total stock will comprise the two
Vincom shopping centres in Cau Giay and Dong Da. No additional
retail space in CBD is expected to be completed in 2016. A large
number of projects will also be concentrated in the Western area of
Hanoi. With WTO commitments, FTA participation and the signing of
TPP, the number of retailers into Vietnam is expected to rise in the
future and consequently, intensify competition between domestic
and foreign retailers.
2 months 2015 2 months 2016
12-Month
Forecast
CPI (%) 0.64 1.03
Inward FDI (billion US$) 1.19 2.80
Trade balance
(billion US$)
(0.61) 0.86
Q1 15 Q1 16
12-Month
Forecast
Overall Vacancy 18% 11.6%
Net Absorption (10,716) 3,866
Overall Average Asking
Rent (VND/sq.m/month)
807,000 905,000
0%
10%
20%
30%
2010 2012 2014 2016
HANOI RETAIL
Historical Average = 14%
600
800
1,000
1,200
-10,000
10,000
30,000
50,000
70,000
90,000
110,000
130,000
150,000
2010 2011 2012 2013 2014 2015 2016
Net Absorption, SQ.M Asking Rent, thousand VND PSQ.M
(*) Average rent on the ground level is used as a benchmark to represent the rent of each
retail centre. All rents include Service charge and exclude VAT
5. Industrial Snapshot Q1 2016
Hanoi,Vietnam
MARKETBEAT
Economic Indicators
Market Indicators
Net Absorption/Asking Rent
Overall Vacancy
www.cushmanwakefield.com
Economy
Having achieved an impressive growth rate in 2015, the government
set a more optimistic GDP growth target of 6.7% and CPI at below 5%
in 2016. As of February 2016, total inward FDI into Vietnam reached
US$2.80 billion (both newly registered and adjusted), up 135% year-
on-year; while implemented FDI was estimated to have reached
US$1.5 billion, up 15.4% year-on-year. The manufacturing and
processing industry, which accounted for 71.2% of total registered
capital, attracted the largest share. Singapore was the leading investor
with newly registered FDI in the first two months, accounting for 23%
of total investment.
Market Overview
There was no change in the supply of industrial parks (IPs) in
first quarter 2016. Total net leasable area supplied by 11 IPs in Hanoi
remained the same at more than 1,420 hectares, constituting around
78% of gross land area. Total available land for lease at the end of the
first quarter was 395 hectares, accounting for approximately 28% of
total supply. RBFs were not popular in Hanoi’s IPs.
The overall market performance continued to experience gradual
improvement, with the average occupancy reaching well over 72% in
first quarter 2016, up 2 percentage points year-on-year. Seven out of
11 IPs (54% of the total stock) were fully occupied. Among the
remaining IPs that still had vacant area at the end of this quarter, Hoa
Lac Hi-tech Park recorded the highest vacancy rate (70%) with 346
hectares land available for lease.
The average asking rent of IPs in Hanoi continued to be the
highest compared to all other cities/provinces in the northern region of
Vietnam (about 50% higher than that of Hai Phong and Bac Ninh),
standing at VND2,475,000 per square meter per term (/sq.m./term),
equivalent to US$111/sq.m./term in first quarter 2016, slightly down
1% quarter-on-quarter but still up 12% year-on-year. Management
fees for these IPs averaged at VND9,650/sq.m./month
(US$0.43/sq.m/month) [check if this is in term or month]. Nam Thang
Long Industrial Park offered the highest rent at nearly
VND4,171,000/sq.m./term (US$187/sq.m./term).
* ALL RENTS ARE ASKING RENTS AND VAT EXCLUDED
Outlook
An additional supply of about 6,000 hectares from 14 identified IP
projects is expected to enter the market from now through 2020, which
is equivalent to 400% of current supply. By 2030 with vision to 2050,
Hanoi will have 33 IPs with an area of 8,000 hectares in total. With
labor costs increasing in China, foreign investment in IPs is expected
to grow continually in the medium to long term as manufacturing
companies shift their operations to Vietnam, particularly when the
country has entered into FTAs, AEC and TPP.
2 months 15 2 months 16
12-Month
Forecast
CPI (%) 0.64 1.03
Inward FDI (billion US$) 1.19 2.80
Trade balance
(billion US$)
(0.61) 0.86
Q1 15 Q1 16
12-Month
Forecast
Overall Vacancy 29.6% 27.8%
Net Absorption 0 ha 2.5 ha
Under Construction 0 340
Average Asking Rent
(VND/sq.m/term)
2,212,000 2,475,000
20%
25%
30%
35%
40%
2012 2014
HANOI INDUSTRIALPARK
Historical Average = 31%
0
500,000
1,000,000
1,500,000
2,000,000
2,500,000
3,000,000
-15
-10
-5
0
5
10
15
20
25
30
35
2012 2013 2014 2015 2016
Net Absorption, ha Asking Rent, VND PSQ.M
7. Residential Snapshot Q1 2016
Hanoi,Vietnam
MARKETBEAT
Economic Indicators
Market Indicators
Primary Market Performance
Asking Prices of All Segments
www.cushmanwakefield.com
Economy
Having achieved an impressive growth rate in 2015, the government
set a more optimistic GDP growth target of 6.7% and CPI at below 5%
in 2016. As of February 2016, total inward FDI into Vietnam reached
US$2.80 billion (both newly registered and adjusted), up 135% year-
on-year; while implemented FDI was estimated to have reached
US$1.5 billion, up 15.4% year-on-year. The manufacturing and
processing industry, which accounted for 71.2% of total registered
capital, attracted the largest share. Singapore was the leading investor
with newly registered FDI in the first two months, accounting for 23% of
total investment.
Market Overview
The first quarter of 2016 continued to see positive market momentum,
reflected by strong launches across all Grades from both 24 new and
active projects, with nearly 6,200 units launched. Grade B dominated
the market with 68% of marketshare, followed by Grade C (30%) and
Grade A (2%). The total primary supply in this quarter reached over
14,700 units.
Transaction volume of all Grades fell 19% quarter-on-quarter due to
the long Tet holiday but remained stable year-on-year; 74% of sold
units were Grade B, followed by Grade C with 26%. Several Grade B
projects registered impressive sales rate including Time City Phase II,
Imperia Garden and Vinhomes Gardenia. Thanh Xuan District had the
highest share of over 25% of total sales volume this quarter.
Average price saw a significant increase on both a quarterly and yearly
basis, by 6% quarter-on-quarter and 16% year-on-year, reaching
VND28 million per square meter (/sq.m.) or US$1,250/sq.m. Grade A,
with limited remaining stock, saw a marked decrease on both quarterly
and yearly basis of nearly 10% quarter-on-quarter and 22% year-on-
year due to price adjustment from one project, attaining VND47
million/sq.m. (US$2,087/sq.m.). The average price for Grade B stood
at VND32 million/sq.m. (US$1,400/sq.m.), up nearly 3% quarter-on-
quarter but down 6% year-on-year. Price of Grade C increased to
VND18.5 million/sq.m. (US$820/sq.m.), up nearly 8% quarter-on-
quarter and 10% year-on-year.
* ALL PRICES ARE VAT EXCLUDED
Outlook
Market sentiment is expected to remain positive in 2016, in terms of
both the number of newly launched projects and sale performance as
developers’ credibility improves with substantial support from banks
and policies in favor of buyers. The Western area is expected to see
the highest supply of apartments in 2016. The mid to low-end
segments will continue to dominate due to its liquidity. Care needs to
be exercised to prevent excessive speculation from distorting the
market.
2 months 15 2 months 16
12-Month
Forecast
CPI (%) 0.64 1.03
Inward FDI (billion US$) 1.19 2.80
Trade balance
(billion US$)
(0.61) 0.86
Q1 15 Q1 16
12-Month
Forecast
Primary supply 16,200 14,200
Net Absorption 35% 41%
Overall Average Asking
Price (mil. VND/sq.m)
24 28.1
0
10,000,000
20,000,000
30,000,000
40,000,000
50,000,000
60,000,000
70,000,000
80,000,000
Grade A Grade B Grade C
Lowest asking price (VND/sq.m) Highest asking price (VND/sq.m)
HANOI APARTMENT
0
1,000
2,000
3,000
4,000
5,000
6,000
7,000
8,000
9,000
10,000
Grade A Grade B Grade C
Primary stock Sold units
9. MARKETBEAT
Serviced Apartment Snapshot
Q1 2016
Hanoi,Vietnam
Economic Indicators
Market Indicators
Net Absorption/Asking Rent
Overall Vacancy
www.cushmanwakefield.com
Economy
Having achieved an impressive growth rate in 2015, the
government set a more optimistic GDP growth target of 6.7% and
CPI at below 5% in 2016. As of February 2016, total inward FDI
into Vietnam reached US$2.80 billion (both newly registered and
adjusted), up 135% year-on-year; while implemented FDI was
estimated to have reached US$1.5 billion, up 15.4% year-on-year.
The manufacturing and processing industry, which accounted for
71.2% of total registered capital, attracted the largest share.
Singapore was the leading investor with newly registered FDI in
the first two months, accounting for 23% of total investment.
Market Overview
No new project entered Hanoi’s serviced apartment market in
first quarter 2016. Overall, there are 12 Grade A projects and 19
Grade B projects supplying a total of 3,100 units. Grade A still
takes up the larger share of total stock with nearly 1,940 units
(62%). Serviced apartments are mainly located in Ba Dinh and
Tay Ho Districts, accounting for 30% and 29% of the total supply
respectively. There are a few international operators present in
Hanoi with mainly Grade A projects such as IHG, Ascott Group,
Fraser and Keppel Land Hospitality
Overall market performance showed significant improvement
year-on-year, up 7 percentage points but remaining stable
quarter-on-quarter, with average occupancy reaching 87% in the
first quarter of 2016. Specifically, occupancy in Grade A reached
87.2%, up by 6 percentage points year-on-year, while that of
Grade B improved by 10 percentage points to 87.1%.
Overall average rent showed a slight decrease on both a
quarterly and yearly basis, by 2%, to VND612,000 per square
meter per month (/sq.m./month) or US$27.4/sq.m./mo. Asking
rent of Grade A averaged at VND695,000/sq.m./mo
(US$31.2/sq.m./mo), down 2% both on a quarterly and yearly
basis, while that of Grade B was down 2% quarter-on-quarter and
3% year-on-year to VND474,000/sq.m./mo (US$21.2/sq.m./mo).
* ALL RENTS ARE ASKING RENTS, WITH SERVICE CHARGE INCLUDED AND VAT EXCLUDED
Outlook
In 2016, Hanoi’s serviced apartment market is likely to welcome
only one new project, namely Novotel Suites Hanoi in Cau Giay
district with 100 units. This will be the first project of this brand in
Hanoi. The market will experience more competition from future
Grade A buy-to-let apartments besides the current over-supply
status. Therefore, the asking rents are expected to remain stable
or slightly decrease in order to maintain occupancy.
2 months 15 2 months 16
12-Month
Forecast
CPI (%) 0.64 1.03
Inward FDI (billion US$) 1.19 2.80
Trade balance
(billion US$)
(0.61) 0.86
Q1 15 Q1 16
12-Month
Forecast
Grade A Vacancy 18.5% 12.8%
Grade A Average Rent VND708,000 VND695,000
Grade B Vacancy 22.9% 12.9%
Grade B Average Rent VND490,000 VND474,000
5%
10%
15%
20%
25%
2011 2012 2013 2014 2015 2016
HANOI SERVICED APARTMENT
Historical Average = 16%
0
100,000
200,000
300,000
400,000
500,000
600,000
700,000
800,000
-60
-40
-20
0
20
40
60
80
100
120
140
160
2011 2012 2013 2014 2015 2016
Net Absorption, SQ.M Asking Rent, VND PSQ.M
11. Office Snapshot Q1 2016
Ho ChiMinh City, Vietnam
MARKETBEAT
Economic Indicators
Market Indicators
Grade A Net Absorption/Asking Rent
4Q TRAILING AVERAGE
Grade A Overall Vacancy
www.cushmanwakefield.com
Economy
With impressive economic growth in 2015, the Government has set a
more optimistic target of 6.7% in GDP growth and CPI to be well under
control at below 5% in 2016.
As of February 2016, total inward FDI into Vietnam reached
US$2.80 billion (both newly registered and adjusted), up 135% year-
on-year (y-o-y); implemented FDI was estimated to have reached
US$1.5 billion, up 15.4% y-o-y. The manufacturing and processing
industry, which accounted for 71.2% of total registered capital,
attracted the largest share. Singapore was the leading investor with
newly registered FDI in the first 2 months, accounting for 23% of total
investment.
Market Overview
No new office building entered the market in Q1 2016, however,
one Grade B building converted over 3,200 sq.m of space into office for
lease. Currently, there are 10 Grade A and 48 Grade B office buildings,
providing approximately 193,800 square meters (sq.m.) and 704,600
sq.m. of space to the market respectively.
Average occupancy of Grade A saw a moderate decrease by 2
percentage point (ppt) by quarter and remained stable by year, at
91%. As a result, Grade A net absorption was recorded at minus 4,440
sq.m. Grade B occupancy reached 95%, unchanged by quarter but
rose 1 ppt y-o-y, enjoying an unbroken upward trend in the last 11
quarters. Occupancy for non-CBD Grade B buildings remained slightly
higher than those in the CBD over the last seven quarters, reached
96%, whilst those in the CBD achieved 95%.
In terms of rents, the average rents of both grades remained
stable on a quarterly basis, at around VND1,028,000 per square
meter per month (/sq.m./mo), equivalent to US$46.1/sq.m./mo. for
Grade A, and VND613,200/sq.m./mo (US$27.5/sq.m./mo) for Grade B.
However, on a yearly basis, Grade A rent softened by 1% whilst Grade
B remained unchanged. The decrease was mostly due to the lower
rent offered by the new project. The average rent for CBD was 40%
higher than in the non-CBD. 10/12 buildings that recorded an increase
in average rent by year were in the CBD area.
Outlook
Over 51,000 sq.m. of new supply of both grades is expected to be
completed in 2016. Low historical standards as well as a limited supply
of large spaces will keep rents stable with moderate increases likely by
the end of the year. The balance of power is generally still with the
tenants as occupiers continue to look for ways to reduce costs by
renegotiating with their existing landlords or relocating to alternative
more cost-efficient buildings.
2 months 15 2 months 16
12-Month
Forecast
CPI (%) 0.64 1.03
Inward FDI (billion US$) 1.19 2.80
Trade balance
(billion US$)
(0.61) 0.86
Q1 15 Q1 16
12-Month
Forecast
Grade A Overall Vacancy 6.4% 8.7%
Grade A Net Absorption 34.9k (4.4)k
Under Construction 221.6k 184.5k
Grade A Average Asking
Rent
$45.94 $46.10
5%
10%
15%
20%
25%
30%
35%
2011 2012 2013 2014 2015 Q1 2016
HCMC OFFICE
Historical Average = 14%
$44
$46
$48
$50
$52
$54
$56
-5,000
0
5,000
10,000
15,000
20,000
25,000
30,000
35,000
2011 2012 2013 2014 2015 Q1 2016
Net Absorption, SQM Asking Rent, $ PSQM
13. MARKETBEAT
Retail Snapshot Q1 2016
Ho ChiMinh City, Vietnam
Economic Indicators
Market Indicators
Net Absorption/Asking Rent
4Q TRAILING AVERAGE
Overall Vacancy
www.cushmanwakefield.com
Economy
Having achieved an impressive growth rate in 2015, the government set a
more optimistic GDP growth target of 6.7% and CPI at below 5% in 2016.
As of February 2016, total inward FDI into Vietnam reached US$2.80
billion (both newly registered and adjusted), up 135% year-on-year; while
implemented FDI was estimated to have reached US$1.5 billion, up
15.4% year-on-year. The manufacturing and processing industry, which
accounted for 71.2% of total registered capital, attracted the largest
share. Singapore was the leading investor with newly registered FDI in
the first two months, accounting for 23% of total investment.
Market Overview
Two shopping centres, namely Vincom Plaza Go Vap and Vincom
Plaza Le Van Viet, were completed in the first quarter of 2016 adding
more than 44,000 square meters (sq.m.) of retail space to the market.
This resulted in a net increase of total stock by 4% quarter-on-quarter
and 22% year-on-year. Currently, there are 131 retail centres in the city
with a total area of approximately 1.10 million sq.m. District 1 remains the
most concentrated retail market in the city, accounting for more than 16%
of total supply.
Overall occupancy remained stable on a quarterly basis, but was up
1 percentage point year-on-year, to 92%. The two aforementioned new
completions achieved a high occupancy rate at above 80%. The recent
trend of high profile investments from retailing giants into Non-CBD
areas, establishing large shopping centres and offering aggressive rents,
has paid off with a higher occupancy rate at 93%. This is in contrast to
the CBD, which saw occupancies remaining unchanged quarter-on-
quarter, but down 5 percentage points year-on-year to 86%, due mainly
to the partial renovation of a big shopping centre in District 1.
Average rents continued to trend downwards on both a quarterly and
yearly basis, downed 3% quarter-on-quarter and 6%year-on-year to
VND1.26 million per square meter per month (/sq.m./mo), or
US$56.6/sq.m./mo. due to lower rents at the new projects. All new
projects over the last four quarters were in the non-CBD area. Rents in
the CBD remained stable on a quarterly basis, but fell moderately by 1%
year-on-year, to VND2.37 million/sq.m./mo (US$105/sq.m./mo.). This is
2.5 times higher than in the secondary area and triple those in the
suburban area.
Outlook
Over 150,000 sq.m. of new supply is expected to enter the market by
2016. While demand for CBD retail space is expected to remain high,
limited land for development means that significant future projects will
mainly be located in the non-CBD areas. These will mostly be in the
south and west where much of the infrastructure and residential
developments have been established. Easing tariffs under the TPP,
together with the further liberalization of the retail sector under the
provisions of the WTO, is expected to enhance Vietnam's potential to
international retailers.
2 months 15 2 months 16
12-Month
Forecast
CPI (%) 0.64 1.03
Inward FDI (billion US$) 1.19 2.80
Trade balance
(billion US$)
(0.61) 0.86
Q1 15 Q1 16
12-Month
Forecast
Overall Vacancy 9.3% 8.4%
Net Absorption 22.0k sq.m 36.1k sq.m
Average Asking Rent
(per sq.m. per month)
VND1,297k VND1,261k
0%
5%
10%
15%
20%
2011 2012 2013 2014 2015 2016
HCMC OFFICE
Historical Average = 13%
1,000,000
1,100,000
1,200,000
1,300,000
1,400,000
1,500,000
1,600,000
-10,000
0
10,000
20,000
30,000
40,000
50,000
60,000
70,000
80,000
90,000
2011 2012 2013 2014 2015 2016
Net Absorption, SQM Asking Rent, VND PSQM
(*) Average rent on the ground level is used as a benchmark to represent the rent of each retail
centre. All rents include Service charge and exclude VAT
15. Industrial Snapshot Q1 2016
Ho ChiMinh City, Vietnam
MARKETBEAT
Economic Indicators
Market Indicators
Net Absorption/Asking Rent
4Q TRAILING AVERAGE
Overall Vacancy
www.cushmanwakefield.com
Economy
Having achieved an impressive growth rate in 2015, the government
set a more optimistic GDP growth target of 6.7% and CPI at below 5%
in 2016. As of February 2016, total inward FDI into Vietnam reached
US$2.80 billion (both newly registered and adjusted), up 135% year-
on-year; while implemented FDI was estimated to have reached
US$1.5 billion, up 15.4% year-on-year. The manufacturing and
processing industry, which accounted for 71.2% of total registered
capital, attracted the largest share. Singapore was the leading
investor with newly registered FDI in the first two months, accounting
for 23% of total investment.
Market Overview
No new supply was delivered during the quarter. Currently, there
are 18 operating IPs covering a total area of nearly 3,630 hectares.
The leasable area is estimated to be about 62% of the total land area,
while the average remaining LUR years is 35.
The performance of the IP market in HCMC remained stable on
both a quarterly and yearly basis with average occupancy rate
increasing moderately by 1 percentage point both on a quarterly and
yearly basis, to 72%. The majority of the established IPs reported
robust occupancy rates of above 90%.
Average asking rents in this quarter stood at approximately
VND2,808,000 per square meter per term (/sq.m./term), equivalent to
US$126/sq.m./term, remaining stable both on a quarterly and yearly
basis. This rent was about two times higher than that in the
neighboring provinces, such as Binh Duong and Dong Nai.
Ready-Built Factory rents for areas of about 2,000–3,000 sq.m.
ranged from US$2.50–US$3.50 per square meter per month.
* ALL RENTS ARE ASKING, EXCLUDING VAT
Outlook
The total increase in industrial land in HCMC up to 2030 is projected
at approximately 3,000 hectares, increasing by some 85% from the
current stock. Twelve new IPs are expected to be added to the 18 that
are currently in operation by 2020. However, the majority of future
projects are still in the clearance and compensation stage;
construction progress is expected to be protracted; and only three of
these projects are in under-construction stage.
With the TPP and other free trade agreements that Vietnam has
participated in recently, coupled with stable economic conditions,
favorable government policies and low labor cost, Vietnam will attract
more investments from foreign manufacturers as they shift their
operations to Vietnam. With demand for industrial land on the rise, this
segment will remain a compelling investment.
2 months 15 2 months 16
12-Month
Forecast
CPI (%) 0.64 1.03
Inward FDI (billion US$) 1.19 2.80
Trade balance
(billion US$)
(0.61) 0.86
Q1 15 Q1 16
12-Month
Forecast
Overall Vacancy 29% 28.1%
Net Absorption 5 ha 17.4 ha
Under Construction 1,000 ha 1,000 ha
Overall Average Asking
Rent (/sqm/term)
VND2,696k VND2,808k
20%
25%
30%
35%
40%
2012 2013 2014 2015 2016
HCMC OFFICE
Historical Average = 33%
2,500,000
2,600,000
2,700,000
2,800,000
2,900,000
0
10
20
30
40
50
60
70
80
2012 2013 2014 2015 2016
Net Absorption, ha Asking Rent, VND PSQM
17. Residential For Sale Snapshot
Q1 2016
Ho ChiMinh City, Vietnam
MARKETBEAT
Economic Indicators
Market Indicators
Overall Primary supply/Asking Prices Q1 2016
Primary Stock/Price Range by Grade Q1 2016
www.cushmanwakefield.com
Economy
Having achieved an impressive growth rate in 2015, the government
set a more optimistic GDP growth target of 6.7% and CPI at below 5%
in 2016. As of February 2016, total inward FDI into Vietnam reached
US$2.80 billion (both newly registered and adjusted), up 135% year-on-
year; while implemented FDI was estimated to have reached US$1.5
billion, up 15.4% year-on-year. The manufacturing and processing
industry, which accounted for 71.2% of total registered capital, attracted
the largest share. Singapore was the leading investor with newly
registered FDI in the first two months, accounting for 23% of total
investment.
Market Overview
There was a decrease in new supply in the first quarter of 2016 across
all Grades, totaling over 8,400 units from both new and active projects,
of which more than half are concentrated in the Eastern region. As of
first quarter 2016, there are nearly 21,200 available units for sale
across all Grades in the primary market, of which Grade B accounted
for 40%, while Grade A and Grade C contributed around 33% and 27%
respectively. In this quarter, Districts 2, 7 and Binh Thanh continued to
dominate the market, accounting for around 52% of the total primary
supply.
Transaction volume fell in the residential market, registering a decline
of nearly 10% year-on-year, but rose 6% quarter-on-quarter. Districts
2,7, 8 and Binh Thanh led the market, accounting for nearly a half of
total absorbed units in the quarter. Binh Thanh District continued to
outperform the rest of the other districts, making up 22% in total
transaction volume.
All Grades recorded an increase in price level on a yearly basis, mostly
due to the higher prices offered at new projects. Average price of Grade
B and Grade C increased by 2% and 14% year-on-year respectively but
fell by 1% and nearly 3% quarter-on-quarter to VND30.6 million per
square meter (/sq.m.) or US$1,370/sq.m. for Grade B and VND18.8
million/sq.m. (US$846/sq.m.) for Grade C; Grade A‘s price was up on
both a quarterly and yearly basis, to VND48.5 million/sq.m. (US$2,176/
sq.m.)., up 3% quarter-on-quarter and 7% year-on-year .
Outlook
Small to medium-sized apartments are expected to be the most sought
after. Future supply will largely be in strategic locations which offer easy
access to the CBD such as Districts 2, 4, 7 and Binh Thanh District.
Projects located along the first metro line are attracting more interest.
Buying activity is expected to benefit from lower home loan interest
rates with longer tenures from banks as well as flexible payment terms
from developers. Sentiment in the city’s residential market is expected
to continually improve in the short to medium term.
2 months 15 2 months 16
12-Month
Forecast
CPI (%) 0.64 1.03
Inward FDI (billion US$) 1.19 2.80
Trade balance
(billion US$)
(0.61) 0.86
Q1 15 Q1 16
12-Month
Forecast
Overall Absorption Rate 35% 38%
Overall Average Price VND24,970k VND33,300k
0
1,500
3,000
4,500
6,000
7,500
9,000
0
20
40
60
80
100
120
140
Grade A Grade B Grade C
Primary Stock, UNITS Lowest Price (MIL VND/SQM)
Highest Price (MIL VND/SQM)
HCMC OFFICE
15
20
25
30
35
'-
5,500
11,000
16,500
22,000
2011 2012 2013 2014 2015 2016
Primary Stock, UNITS Aksing Price, MIL VND/SQM
* ALL PRICES ARE VAT EXCLUDED
19. Serviced Apartment Snapshot
Q1 2016
Ho ChiMinh City, Vietnam
MARKETBEAT
Economic Indicators
Market Indicators
Net Absorption/Asking Rent
4Q TRAILING AVERAGE
Overall Vacancy
www.cushmanwakefield.com
Economy
Having achieved an impressive growth rate in 2015, the government set a
more optimistic GDP growth target of 6.7% and CPI at below 5% in 2016.
As of February 2016, total inward FDI into Vietnam reached US$2.80 billion
(both newly registered and adjusted), up 135% year-on-year; while
implemented FDI was estimated to have reached US$1.5 billion, up 15.4%
year-on-year. The manufacturing and processing industry, which accounted
for 71.2% of total registered capital, attracted the largest share. Singapore
was the leading investor with newly registered FDI in the first two months,
accounting for 23% of total investment.
Market Overview
No new projects for either Grades entered the market in the first
quarter of 2016. The remaining units from Reverie Saigon are still under
renovation. In addition, two projects in the CBD have been completed and
are awaiting for inauguration – Ascott Waterfront Saigon and New Pearl
Residence. Currently, the market comprises 700 units from eight Grade A
buildings and 2,290 units from 23 Grade B buildings. Those in District 1
make up 44% of the total supply.
Grade B continued to see gradual improvement with average
occupancy rising on both a quarterly and yearly basis, up nearly 2
percentage points quarter-on-quarter and 5 percentage points year-on-year
to 95%. Meanwhile, Grade A had a softer performance, with occupancy
down moderately by 1 percentage point quarter-on-quarter and nearly 4
percentage points year-on-year to 92%, largely due to the seasonal
fluctuation in short term leases.
District 1 has traditionally outperformed due to its prime location,
accessibility and full range of facilities. However, lower occupancy at the
new project proved a drag as overall occupancy in the district fell to 93%,
while non-CBD occupancy reached 95%.
Average rents of both Grades experienced moderate increases on year.
Grade A rose by 1% quarter-on-quarter and 4% year-on-year, to
VND669,000 per square meter per month* (/sq.m./mo), equivalent to
US$30.0/sq.m./mo, mainly due to the ending of the promotion period of the
new project. Grade B’s rent was stable quarter-on-quarter but up 2% year-
on-year, standing at VND476,000/sq.m./mo. (US$21.3/sq.m./mo). Rents of
1-bedroom units are showing signs of an increase in majority of the projects
in the CBD, indicating increasing demand for such room types in the area.
Outlook
Over 600 units from six projects are expected to enter the market by 2016,
of which more than 60% will be in District 1 as the CBD continues to be the
preferred location of developers. Under the Trans Pacific Partnership
Agreement and the Vietnam-EU Free Trade Agreement, Vietnam ‘s
economic outlook remains positive which will drive prospects n the serviced
apartment market.
2 months 15 2 months 16
12-Month
Forecast
CPI (%) 0.64 1.03
Inward FDI (billion US$) 1.19 2.80
Trade balance
(billion US$)
(0.61) 0.86
Q1 15 Q1 16
12-Month
Forecast
Grade A Vacancy 4.0% 7.8%
Grade A Average Rent VND644k VND669k
Grade B Vacancy 10.5% 5.3%
Grade B Average Rent VND467k VND476k
5%
10%
15%
20%
25%
2010 2011 2012 2013 2014 2015 2016
HCMC SERVICED APARTMENT
Historical Average = 14%
460,000
480,000
500,000
520,000
540,000
560,000
580,000
-40
0
40
80
120
160
200
2011 2012 2013 2014 2015 2016
Net Absorption, units Asking Rent, VND PSQM
* ALL RENTS ARE ASKING RENTS, WITH SERVICE CHARGE INCLUDED AND VAT EXCLUDED