SlideShare a Scribd company logo
1 of 6
Download to read offline
PERFORMANCE
The overall market experienced a downward trend in both rents and
occupancy. Average occupancy across all grades dropped 1.82ppts over
the quarter, staying at 86.4% while net asking rents were reduced to
USD22.8/sqm/month on average, down 2.57ppts q-o-q.
Due to new supply entering the market, Grade A’s occupancy and rents
decreased 5.98 ppts and 3.77ppts respectively compared to the previous
quarter. In contrast, Grade B’s performance recorded improvements,
reaching 91% in occupancy and USD17.65/sqm/month in average net
asking rents.
SUPPLY
The supply pipeline grew significantly in the first quarter of 2016 with
five new office completions, providing approximately 133,921 sqm NLA.
There is only one Grade A project coming online while the other four are
of Grade B standard.
From now until 2018, there is approximately 330,000sqm GFA of office
space entering the market. Most of new supply will be decentralised in
the West and Midtown area, creating intense competition with the existing
CBD.
DEMAND
Expansion and relocation are two key demand drivers of Hanoi office
market. The city west is an ideal option for tenants looking to reduce
operational costs while still securing high quality office space.
Due to an oversupply, the market has been favorable for occupiers, which
enables them to negotiate for better terms and incentives.
OFFICE SECTOR
Q1 2016 | MARKET INSIGHTS
HANOI
ECONOMY OVERVIEW
The combination of slowdown in manufacturing and decrease of
profitability in agricultural sector in Q1-2016 due to weather difficulties
may have caused a slow growth rate of GDP. Vietnam’s GDP grew 5.46%
in Q1-2016, significantly lower than 6.12% in Q1-2015. The Consumer
Price Index (CPI) increased to 0.57% m-o-m in March which resulted in
a 1.25% increment in the first three months of the year.
Export achieved USD37.9 billion, up 4.1% y-o-y while import values
were USD37.1 billion, down 4.8% y-o-y. FDI of newly registered and
supplementary capital was USD4.02 billion which was less than the
amount of USD5.607 billion in Q4 2015 but rose 119% y-o-y. The
disbursement value reached USD3.5 billion, a growth of 14.8% y-o-y.
Credit growth achieved 1.54% which was higher than the growth rate
of 1.25% same period last year. As manufacturing sector showed a
slowdown, the increase in credit growth is contributed by real estate
sector.
If Vietnam aims to set the GDP growth target for this year to at least
match the 2015 growth rate, the nation will have to make great efforts in
the next coming quarters.
DAVID JACKSON
General Director
david.jackson@colliers.com
PLEASE CONTACT US FOR ANY INFORMATION
www.colliers.com/vietnam
Colliers International is a global leader in commercial real estate services, with over 16,300 professionals operating out of more than 502 offices
in 67 countries. Colliers International delivers a full range of services to real estate users, owner and investors worldwide, including global
corporate solutions, brokerage, property and asset, management, hotel investment sales and consulting, valuation, consulting and appraisal
services, mortgage banking and insightful research. The latest annual survey by the Lipsey Company ranked Colliers International as the second-
most recognized commercial real estate firm in the world.
This document has been prepared by Colliers International for advertising and general information only. Colliers International makes no
guarantees, representations or warranties of any kind, expressed or implied, regarding the information including, but not limited to, warranties
of content, accuracy and reliability. Any interested party should undertake their own inquiries as to the accuracy of the information. Colliers
International excludes unequivocally all inferred or implied terms, conditions and warranties arising out of this document and excludes all liability
for loss and damages arising there from. This publication is the copyrighted property of Colliers International and/or its licensor(s).
©2016 Colliers International Research
OUTLOOK
It is forecasted that the overall market performance will continue
to witness imbalance between supply and demand. With ample
supply entering the market, vacancy is expected to be on the rise
while rent will be on downward trend. To attract new tenants,
landlords have to think of various marketing strategies and
promotional incentives.
Figure 1: Average Asking Rent by Grade
Table 1: New Supply in Q1 2016
Figure 2: Occupancy Rate by Grade
Source: Colliers International Research
HA VO
Research Manager
ha.vo@colliers.com
0%
20%
40%
60%
80%
100%
Q1 Q2 Q3 Q4 Q1 Q2 Q3 Q4 Q1 Q2 Q3 Q4 Q1 Q2 Q3 Q4 Q1
2012 2013 2014 2015 2016
Grade A Grade B
Project name District Grade NLA (sqm)
TNR Dong Da A 37,411
789 Hoang Quoc Viet Cau Giay B 39,419
Hadico Tu Liem B 19,091
Diamond Flower Tower Thanh Xuan B 18,000
MD Complex My Dinh Tu Liem B 20,000
0
5
10
15
20
25
30
35
40
Q1 Q2 Q3 Q4 Q1 Q2 Q3 Q4 Q1 Q2 Q3 Q4 Q1 Q2 Q3 Q4 Q1
2012 2013 2014 2015 2016
US$/sqm/month
Grade A Grade B
PERFORMANCE
Overall occupancy rate decreased 0.9ppts q-o-q, staying at 88.5% due to
weak business performance of some retail centers.
The average net asking rents nominally increased 0.2ppts q-o-q. The CBD
and non CBD sub-markets recorded large variances with rent, staying at
USD81.44/sqm/month and USD28.89/sqm/month respectively.
SUPPLY
The retail stock remained stable in the review quarter as no new project
came online. Currently, Hanoi market has approximately 750,000sqm NLA
from 50 buildings.
In terms of retail format, shopping centers take the largest share in the
supply pipeline, accounting for nearly 80% of the total net lettable area.
The market share of department stores and retail podiums are 10% and
11% respectively.
By location, the CBD is home of 4% of total retail supply, providing a
majority of small-scale podiums. The remaining supply is located in
non-CBD districts, including large-scale shopping centers and department
stores.
DEMAND
Vietnam’s young population and rising urban middle-class result in strong
consumer-spending potentials. However, given relatively low average
income across the nation, demand for affordable goods and services
outweighs luxury branded products.
To achieve higher footfall in all retail developments, retailers should focus
on selling mid-end items to customers.
RETAIL SECTOR
Q1 2016 | MARKET INSIGHTS
HANOI
ECONOMY OVERVIEW
The combination of slowdown in manufacturing and decrease of
profitability in agricultural sector in Q1-2016 due to weather difficulties
may have caused a slow growth rate of GDP. Vietnam’s GDP grew 5.46%
in Q1-2016, significantly lower than 6.12% in Q1-2015. The Consumer
Price Index (CPI) increased to 0.57% m-o-m in March which resulted in
a 1.25% increment in the first three months of the year.
Export achieved USD37.9 billion, up 4.1% y-o-y while import values
were USD37.1 billion, down 4.8% y-o-y. FDI of newly registered and
supplementary capital was USD4.02 billion which was less than the
amount of USD5.607 billion in Q4 2015 but rose 119% y-o-y. The
disbursement value reached USD3.5 billion, a growth of 14.8% y-o-y.
Credit growth achieved 1.54% which was higher than the growth rate
of 1.25% same period last year. As manufacturing sector showed a
slowdown, the increase in credit growth is contributed by real estate
sector.
If Vietnam aims to set the GDP growth target for this year to at least
match the 2015 growth rate, the nation will have to make great efforts in
the next coming quarters.
DAVID JACKSON
General Director
david.jackson@colliers.com
PLEASE CONTACT US FOR ANY INFORMATION
www.colliers.com/vietnam
Colliers International is a global leader in commercial real estate services, with over 16,300 professionals operating out of more than 502 offices
in 67 countries. Colliers International delivers a full range of services to real estate users, owner and investors worldwide, including global
corporate solutions, brokerage, property and asset, management, hotel investment sales and consulting, valuation, consulting and appraisal
services, mortgage banking and insightful research. The latest annual survey by the Lipsey Company ranked Colliers International as the second-
most recognized commercial real estate firm in the world.
This document has been prepared by Colliers International for advertising and general information only. Colliers International makes no
guarantees, representations or warranties of any kind, expressed or implied, regarding the information including, but not limited to, warranties
of content, accuracy and reliability. Any interested party should undertake their own inquiries as to the accuracy of the information. Colliers
International excludes unequivocally all inferred or implied terms, conditions and warranties arising out of this document and excludes all liability
for loss and damages arising there from. This publication is the copyrighted property of Colliers International and/or its licensor(s).
©2016 Colliers International Research
OUTLOOK
The general outlook for Hanoi retail in the short term is continued
oversupply, particularly those outside of the CBD. The market will
become more competitive, resulting in pressure on both rents
and occupancy rates. To attract more shoppers and satisfy their
diversified demand, landlords should organize special marketing
events and festivals in their retail centers.
Figure 3: Total Supply
Figure 2: Occupancy Rate
Figure 1: Market Performance
Source: Colliers International Research
HA VO
Research Manager
ha.vo@colliers.com
0
100,000
200,000
300,000
400,000
500,000
600,000
700,000
800,000
2010 2011 2012 2013 2014 2015 Q1 2016
sqm
CBD Non-CBD
75
80
85
90
95
100
2011 2012 2013 2014 2015 2016
%
CBD Non-CBD
0
10
20
30
40
50
60
70
80
75%
80%
85%
90%
95%
100%
2008 2009 2010 2011 2012 2013 2014 2015 Q1
2016
US$/sqm/month
Rental rate Occupancy
PERFORMANCE
The review quarter recorded 3,980 successful transactions, down 34%
compared to the previous quarter. Sales momentum continued to be
strong in high-end and mid-end segments.
On the primary market, price growth of 2.9% q-o-q was recorded in the
mid-end segment. Asking price was soften in high-end and low-end
projects, a drop of 0.3% and 7.8% q-o-q respectively. Projects with
convenient traffic & location, reputable developers and well-established
facilities and amenities tend to increase their sale price.
SUPPLY
New supply was ample in Q1 2016 with approximately 4,479 units from 13
projects. Ha Dong, Tu Liem and West Lake are top three locations for new
condominium developments during the review quarter.
With the ongoing establishment of new townships in sub-urban districts,
Hanoi residential market will be abundant with more launches in coming
quarters of 2016.
DEMAND
According to Hanoi Statistics Office, the capital city’s population was 7.21
million in 2013. The number is expected to reach 8 million in 2020 and
young population of less than 35 years old will account for 50%. This
trend reflects strong potential for the apartment market.
CONDOMINIUM SECTOR
Q1 2016 | MARKET INSIGHTS
HANOI
ECONOMY OVERVIEW
The combination of slowdown in manufacturing and decrease of
profitability in agricultural sector in Q1-2016 due to weather difficulties
may have caused a slow growth rate of GDP. Vietnam’s GDP grew 5.46%
in Q1-2016, significantly lower than 6.12% in Q1-2015. The Consumer
Price Index (CPI) increased to 0.57% m-o-m in March which resulted in
a 1.25% increment in the first three months of the year.
Export achieved USD37.9 billion, up 4.1% y-o-y while import values
were USD37.1 billion, down 4.8% y-o-y. FDI of newly registered and
supplementary capital was USD4.02 billion which was less than the
amount of USD5.607 billion in Q4 2015 but rose 119% y-o-y. The
disbursement value reached USD3.5 billion, a growth of 14.8% y-o-y.
Credit growth achieved 1.54% which was higher than the growth rate
of 1.25% same period last year. As manufacturing sector showed a
slowdown, the increase in credit growth is contributed by real estate
sector.
If Vietnam aims to set the GDP growth target for this year to at least
match the 2015 growth rate, the nation will have to make great efforts in
the next coming quarters.
DAVID JACKSON
General Director
david.jackson@colliers.com
PLEASE CONTACT US FOR ANY INFORMATION
www.colliers.com/vietnam
Colliers International is a global leader in commercial real estate services, with over 16,300 professionals operating out of more than 502 offices
in 67 countries. Colliers International delivers a full range of services to real estate users, owner and investors worldwide, including global
corporate solutions, brokerage, property and asset, management, hotel investment sales and consulting, valuation, consulting and appraisal
services, mortgage banking and insightful research. The latest annual survey by the Lipsey Company ranked Colliers International as the second-
most recognized commercial real estate firm in the world.
This document has been prepared by Colliers International for advertising and general information only. Colliers International makes no
guarantees, representations or warranties of any kind, expressed or implied, regarding the information including, but not limited to, warranties
of content, accuracy and reliability. Any interested party should undertake their own inquiries as to the accuracy of the information. Colliers
International excludes unequivocally all inferred or implied terms, conditions and warranties arising out of this document and excludes all liability
for loss and damages arising there from. This publication is the copyrighted property of Colliers International and/or its licensor(s).
©2016 Colliers International Research
OUTLOOK
As buyers and investors have regained their market
confidence, demand for mid-end and high-end segment is
expected to remain higher in the next quarters. Affordable
units will achieve stable sales volume on the back of
reasonable price and strong demand from end-users.
Figure 3: Launch Supply by Year
Figure 1: Sales by Quarter and Segment
Source: Colliers International Research
HA VO
Research Manager
ha.vo@colliers.com
Source: Colliers International Research
Figure 2: Changes in Secondary Prices by Quarter
-8
-6
-4
-2
0
2
4
6
8
2008 2009 2010 2011 2012 2013 2014 2015 2016
%
0
1,000
2,000
3,000
4,000
5,000
6,000
7,000
Q1 Q2 Q3 Q4 Q1 Q2 Q3 Q4 Q1 Q2 Q3 Q4 Q1 Q2 Q3 Q4 Q1
2012 2013 2014 2015 2016
units
Luxury High-end Mid-end Affordable
0
5000
10000
15000
20000
25000
30000
2007 2008 2009 2010 2011 2012 2013 2014 2015 Q1
2016
sqm
PERFORMANCE
Townhouses dominated sale transactions as 70% of launched dwellings
were sold in the first quarter of 2016.
On the primary market, sale price remained stable. The average
secondary price dropped 0.8% q-o-q for villas but increased 1.3% q-o-q
for townhouses. By location, projects in decentralised districts witnessed
higher sale price. Compared to the previous quarter, Ha Dong District
recorded the highest price growth of 5.5% while Cau Giay and Hoai Duc
district had positive price increases of under 5%.
SUPPLY
The stock increased 1.9% q-o-q in the first quarter of 2016 with the
launch of five new projects, providing 859 dwellings. Due to large land
availability, Ha Dong district takes the largest market share, representing
27% of supply pipeline. Well-established infrastructure and convenient
traffic connection has attracted homebuyers to settle in this area.
DEMAND
Landed properties are preferred by Vietnamese people as this type of
accommodation is believed to increase value over time. Investors and
end-users are key demand drivers of the market with purposes of rental
income and owner occupation. Speculators who buy a property for
capital appreciation account for a small proportion in the buyer profile.
Demand for landed houses is expected to become stronger on the back of
high urbanization rate and rapid development of infrastructure in Hanoi.
VILLA & TOWNHOUSE SECTOR
Q1 2016 | MARKET INSIGHTS
HANOI
ECONOMY OVERVIEW
The combination of slowdown in manufacturing and decrease of
profitability in agricultural sector in Q1-2016 due to weather difficulties
may have caused a slow growth rate of GDP. Vietnam’s GDP grew 5.46%
in Q1-2016, significantly lower than 6.12% in Q1-2015. The Consumer
Price Index (CPI) increased to 0.57% m-o-m in March which resulted in
a 1.25% increment in the first three months of the year.
Export achieved USD37.9 billion, up 4.1% y-o-y while import values
were USD37.1 billion, down 4.8% y-o-y. FDI of newly registered and
supplementary capital was USD4.02 billion which was less than the
amount of USD5.607 billion in Q4 2015 but rose 119% y-o-y. The
disbursement value reached USD3.5 billion, a growth of 14.8% y-o-y.
Credit growth achieved 1.54% which was higher than the growth rate
of 1.25% same period last year. As manufacturing sector showed a
slowdown, the increase in credit growth is contributed by real estate
sector.
If Vietnam aims to set the GDP growth target for this year to at least
match the 2015 growth rate, the nation will have to make great efforts in
the next coming quarters.
DAVID JACKSON
General Director
david.jackson@colliers.com
PLEASE CONTACT US FOR ANY INFORMATION
www.colliers.com/vietnam
Colliers International is a global leader in commercial real estate services, with over 16,300 professionals operating out of more than 502 offices in
67 countries. Colliers International delivers a full range of services to real estate users, owner and investors worldwide, including global corporate
solutions, brokerage, property and asset, management, hotel investment sales and consulting, valuation, consulting and appraisal services,
mortgage banking and insightful research. The latest annual survey by the Lipsey Company ranked Colliers International as the second-most
recognized commercial real estate firm in the world.
This document has been prepared by Colliers International for advertising and general information only. Colliers International makes no
guarantees, representations or warranties of any kind, expressed or implied, regarding the information including, but not limited to, warranties
of content, accuracy and reliability. Any interested party should undertake their own inquiries as to the accuracy of the information. Colliers
International excludes unequivocally all inferred or implied terms, conditions and warranties arising out of this document and excludes all liability
for loss and damages arising there from. This publication is the copyrighted property of Colliers International and/or its licensor(s).
©2016 Colliers International Research
Figure 3: Landed Property, Supply by Quarter
Source: Colliers International Research
Figure 1: Q-o-Q Changes in Secondary price
Source: Colliers International Research
Figure 2: Secondary Price by District
Source: Colliers International Research
OUTLOOK
Next quarters of 2016 is expected to have 10 projects coming
online and approximately 40 projects under planning stage. Some
projects that have been delayed for a long time will be restarted
to catch the new market cycle. Projects with reasonable price
and good supporting infrastructure will potentially achieve
stronger sales volume than others.
HA VO
Research Manager
ha.vo@colliers.com
95
100
105
110
115
120
125
130
26,000
27,000
28,000
29,000
30,000
31,000
32,000
33,000
34,000
Q3 Q4 Q1 Q2 Q3 Q4 Q1
2014 2015 2016
dwellings
No. of Dwellings No. of Projects
0
20
40
60
80
100
120
140
160
180
200
Thanh
Xuan
Cau
Giay
Tay Ho Tu Liem Hoang
Mai
Ha
Dong
Long
Bien
Thanh
Tri
Hoai
Duc
Gia Lam Me Linh
USD/sqm
Q4-2015 Average Q1-2016 Average Market average price Q4 2015
-15
-10
-5
0
5
10
15
20
0
1000
2000
3000
4000
5000
6000
7000
Q1 Q2 Q3 Q4 Q1 Q2 Q3 Q4 Q1 Q2 Q3 Q4 Q1 Q2 Q3 Q4 Q1 Q2 Q3 Q4 Q1
2011 2012 2013 2014 2015 2016
%
USD/sqm
Market average price Q4 2015 Q-o-Q changes
PERFORMANCE
Grade A dropped 1.9ppts q-o-q in rents and 2.4ppts q-o-q in occupancy
rates, averaging at USD31.4/sqm/month and 84% respectively. Grade
B slightly increased 0.45ppts q-o-q in rents and remained stable in
occupancy rates, reaching at USD22.1/sqm/month and 84% respectively.
The highest average asking rent for both two Grades was recorded in
West Lake and Hoan Kiem district, followed by Cau Giay District and Ba
Dinh District.
SUPPLY
Hanoi serviced apartment market consists of approximately 3,500 units
from 38 projects.
Grade A accounts for 59% of the total supply, providing 2,054 units from
15 projects. The majority of Grade A supply was located in Ba Dinh,
West Lake and Tu Liem district. Grade B takes 41% of the market share
with1,442 units from 23 projects. A significant proportion of Grade B is
located in Ba Dinh and Hai Ba Trung Districts.
DEMAND
Expatriates working for multinational enterprises, embassies and
consulates, international schools and universities are major occupiers in
Hanoi serviced apartments.
With increasing FDI inflows to industrial parks scattered around the capital
city and Bac Ninh, there is growing demand for serviced accommodation
for foreign experts. Despite having to commute everyday between the
two cities, expatriates still prefer to stay in Hanoi due to its convenient
facilities and attractive social entertainments.
SERVICED APARTMENT SECTOR
Q1 2016 | MARKET INSIGHTS
HANOI
ECONOMY OVERVIEW
The combination of slowdown in manufacturing and decrease of
profitability in agricultural sector in Q1-2016 due to weather difficulties
may have caused a slow growth rate of GDP. Vietnam’s GDP grew 5.46%
in Q1-2016, significantly lower than 6.12% in Q1-2015. The Consumer
Price Index (CPI) increased to 0.57% m-o-m in March which resulted in
a 1.25% increment in the first three months of the year.
Export achieved USD37.9 billion, up 4.1% y-o-y while import values
were USD37.1 billion, down 4.8% y-o-y. FDI of newly registered and
supplementary capital was USD4.02 billion which was less than the
amount of USD5.607 billion in Q4 2015 but rose 119% y-o-y. The
disbursement value reached USD3.5 billion, a growth of 14.8% y-o-y.
Credit growth achieved 1.54% which was higher than the growth rate
of 1.25% same period last year. As manufacturing sector showed a
slowdown, the increase in credit growth is contributed by real estate
sector.
If Vietnam aims to set the GDP growth target for this year to at least
match the 2015 growth rate, the nation will have to make great efforts in
the next coming quarters.
DAVID JACKSON
General Director
david.jackson@colliers.com
PLEASE CONTACT US FOR ANY INFORMATION
www.colliers.com/vietnam
Colliers International is a global leader in commercial real estate services, with over 16,300 professionals operating out of more than 502 offices
in 67 countries. Colliers International delivers a full range of services to real estate users, owner and investors worldwide, including global
corporate solutions, brokerage, property and asset, management, hotel investment sales and consulting, valuation, consulting and appraisal
services, mortgage banking and insightful research. The latest annual survey by the Lipsey Company ranked Colliers International as the second-
most recognized commercial real estate firm in the world.
This document has been prepared by Colliers International for advertising and general information only. Colliers International makes no
guarantees, representations or warranties of any kind, expressed or implied, regarding the information including, but not limited to, warranties
of content, accuracy and reliability. Any interested party should undertake their own inquiries as to the accuracy of the information. Colliers
International excludes unequivocally all inferred or implied terms, conditions and warranties arising out of this document and excludes all liability
for loss and damages arising there from. This publication is the copyrighted property of Colliers International and/or its licensor(s).
©2016 Colliers International Research
OUTLOOK
Due to large existing supply from the market, landlords will be
under pressure of reducing asking rents in the coming period.
Demand for this type of accommodation will sustainably grow
thanks to the rising number of foreign skilled workers in
industrial zones in Hanoi and neighboring provinces.
Figure 1: Average Asking Rent by Grade
Source: Colliers International Research
Figure 2: Occupancy Rate by Grade
Source: Colliers International Research
HA VO
Research Manager
ha.vo@colliers.com
Source: Colliers International Research
Figure 3: Supply by Segment
-
500
1,000
1,500
2,000
2,500
3,000
3,500
2000 2005 2010 2011 2012 2013 2014 Q4 2015 Q1 2016
Grade A Grade B
units
60%
70%
80%
90%
100%
Q1 Q2 Q3 Q4 Q1 Q2 Q3 Q4 Q1 Q2 Q3 Q4 Q1 Q2 Q3 Q4 Q1
2012 2013 2014 2015 2016
Grade A Grade B
0
5
10
15
20
25
30
35
40
Q1 Q2 Q3 Q4 Q1 Q2 Q3 Q4 Q1 Q2 Q3 Q4 Q1 Q2 Q3 Q4 Q1
2012 2013 2014 2015 2016
USD/sqm/month
Grade A Grade B
PERFORMANCE
Average gross asking rent in Hanoi’s IPs reached USD83/sqm/term and
the remaining Land Use Right was 34.8 years.
IPs in Hanoi had the average occupancy rate of 61.6%. Hoa Lac High- tech
park has the lowest occupancy rate of 18%-22%. If the 1,586ha high tech
park is being excluded from the calculation, the average occupancy rate
would be 91% while the average rent would be increased to USD103.5/
sqm/term. Rent of ready-built factory in Hanoi range from USD1.5 –
USD2.5/sqm/month.
SUPPLY
Hanoi has 11 IPs and more than 3,800ha of industrial area.
Under the socioeconomic development plan by 2020 with visions until
2030, Hanoi will be home of 33 industrial and hi tech parks.
DEMAND
According to the Ministry of Planning and Investment, the city attracted
USD303 million of new and supplementary FDI capital in the first quarter
of 2016. The majority of investments are flown into industries such as
intermediate goods, machinery, spare parts and accessories, electronics.
Infrastructures are being developed to connect Northern provinces with
Hanoi which will significantly reduce time and costs of transportation
and commercial traffic. These will positively contribute to improve the
occupancy rate and asking rate of IPs.
OUTLOOK
Prices and occupancy rate are expected to increase steadily in the next
coming quarters as the inflow of foreign investments is expected to
continue. In the master plan for Hanoi, the capital city will have 24 industrial
parks in 2020 and 33 industrial parks in 2030. The industrial area at that
time will also be increased to 6,100ha and 8,000ha respectively.
INDUSTRIAL SECTOR
Q1 2016 | MARKET INSIGHTS
ECONOMY OVERVIEW
The combination of slowdown in manufacturing and decrease of
profitability in agricultural sector in Q1-2016 due to weather difficulties
may have caused a slow growth rate of GDP. Vietnam’s GDP grew 5.46%
in Q1-2016, significantly lower than 6.12% in Q1-2015. The Consumer
Price Index (CPI) increased to 0.57% m-o-m in March which resulted in
a 1.25% increment in the first three months of the year.
Export achieved USD37.9 billion, up 4.1% y-o-y while import values
were USD37.1 billion, down 4.8% y-o-y. FDI of newly registered and
supplementary capital was USD4.02 billion which was less than the
amount of USD5.607 billion in Q4 2015 but rose 119% y-o-y. The
disbursement value reached USD3.5 billion, a growth of 14.8% y-o-y.
Credit growth achieved 1.54% which was higher than the growth rate
of 1.25% same period last year. As manufacturing sector showed a
slowdown, the increase in credit growth is contributed by real estate
sector.
If Vietnam aims to set the GDP growth target for this year to at least
match the 2015 growth rate, the nation will have to make great efforts in
the next coming quarters.
DAVID JACKSON
General Director
david.jackson@colliers.com
PLEASE CONTACT US FOR ANY INFORMATION
www.colliers.com/vietnam
Colliers International is a global leader in commercial real estate services, with over 16,300 professionals operating out of more than 502 offices
in 67 countries. Colliers International delivers a full range of services to real estate users, owner and investors worldwide, including global
corporate solutions, brokerage, property and asset, management, hotel investment sales and consulting, valuation, consulting and appraisal
services, mortgage banking and insightful research. The latest annual survey by the Lipsey Company ranked Colliers International as the second-
most recognized commercial real estate firm in the world.
This document has been prepared by Colliers International for advertising and general information only. Colliers International makes no
guarantees, representations or warranties of any kind, expressed or implied, regarding the information including, but not limited to, warranties
of content, accuracy and reliability. Any interested party should undertake their own inquiries as to the accuracy of the information. Colliers
International excludes unequivocally all inferred or implied terms, conditions and warranties arising out of this document and excludes all liability
for loss and damages arising there from. This publication is the copyrighted property of Colliers International and/or its licensor(s).
©2016 Colliers International Research
In general, infrastructure and associated services of
Hanoi’s IPs are not as satisfactorily as those of HCMC’s IPs.
Therefore, IPs’ developers should concentrate on building
more associated infrastructures and utilities as banks,
shopping malls, schools, hospitals, in order to improve the
quality of life of IP’s employees.
Figure 2: Supply by District
Source: Colliers International Research
Figure 1: Net Absorption
Source: Colliers International Research
HA VO
Research Manager
ha.vo@colliers.com
Source: Colliers International Research
Table 1: Future Supply
HANOI
-15
-10
-5
0
5
10
15
20
25
30
35
Q1 Q2 Q3 Q4 Q1 Q2 Q3 Q4 Q1 Q2 Q3 Q4 Q1 Q2 Q3 Q4 Q1
2012 2013 2014 2015 2016
ha
Industrial Park Name District GFA (ha)
Quang Minh II Industrial park Me Linh 266
Phuc Tho Industrial park Phuc Tho 74
Phu Xuyen Industrial park Phu Xuyen 488
Thanh My - Xuan Son Industrial park Son Tay 108
Soc Son Industrial park Soc Son 340
Soc Son II Industrial park Soc Son 204
Soc Son III Industrial park Soc Son 180
Soc Son IV Industrial park Soc Son 216
Thanh Oai II Industrial park Thanh Oai 480
Habeco Industrial park Thuong Tin 300
Dong Anh
35%
Thanh That
23%
Chuong My
12%
Me Linh
12%
Tu Liem
9%
Others
9%

More Related Content

What's hot

Weekly media update 22.02.2016
Weekly media update 22.02.2016Weekly media update 22.02.2016
Weekly media update 22.02.2016BalmerLawrie
 
Ulster Bank Slide Pack October 2016
Ulster Bank Slide Pack October 2016Ulster Bank Slide Pack October 2016
Ulster Bank Slide Pack October 2016Richard Ramsey
 
Slide pack Ulster Bank NI PMI March 2016
Slide pack Ulster Bank NI PMI March 2016Slide pack Ulster Bank NI PMI March 2016
Slide pack Ulster Bank NI PMI March 2016Richard Ramsey
 
RBI Monetary Policy 2013-14
RBI Monetary Policy 2013-14RBI Monetary Policy 2013-14
RBI Monetary Policy 2013-14BFSICM
 
Rong Viet Securities - Investment Strategy Report November 2017
Rong Viet Securities - Investment Strategy Report November 2017Rong Viet Securities - Investment Strategy Report November 2017
Rong Viet Securities - Investment Strategy Report November 2017Thomas Farthofer
 
The World This Week - 16th to 20th May, 2016
The World This Week - 16th to 20th May, 2016The World This Week - 16th to 20th May, 2016
The World This Week - 16th to 20th May, 2016Karvy Private Wealth
 
Olivier Desbarres: Brexit what happens next?
Olivier Desbarres: Brexit what happens next?Olivier Desbarres: Brexit what happens next?
Olivier Desbarres: Brexit what happens next?Olivier Desbarres
 
The World This Week - 23rd to 27th May, 2016
The World This Week -  23rd to 27th May, 2016The World This Week -  23rd to 27th May, 2016
The World This Week - 23rd to 27th May, 2016Karvy Private Wealth
 
Weekly media update 04.01.2016
Weekly media update 04.01.2016Weekly media update 04.01.2016
Weekly media update 04.01.2016BalmerLawrie
 
Economic and social survey of Asia Pacific 2016
Economic and social survey of Asia Pacific 2016Economic and social survey of Asia Pacific 2016
Economic and social survey of Asia Pacific 2016Ira Kristina Lumban Tobing
 
The World This Week - 11th to 15th July, 2016
The World This Week - 11th to 15th July, 2016The World This Week - 11th to 15th July, 2016
The World This Week - 11th to 15th July, 2016Karvy Private Wealth
 
The World This Week - 25 to 29th July, 2016
The World This Week - 25 to 29th July, 2016The World This Week - 25 to 29th July, 2016
The World This Week - 25 to 29th July, 2016Karvy Private Wealth
 
The World This Week - 25th to 29th April, 2016
The World This Week - 25th to 29th April, 2016The World This Week - 25th to 29th April, 2016
The World This Week - 25th to 29th April, 2016Karvy Private Wealth
 

What's hot (19)

Economy Matters
Economy MattersEconomy Matters
Economy Matters
 
MNI Russia Business Report 2014-03
MNI Russia Business Report 2014-03MNI Russia Business Report 2014-03
MNI Russia Business Report 2014-03
 
Weekly media update 22.02.2016
Weekly media update 22.02.2016Weekly media update 22.02.2016
Weekly media update 22.02.2016
 
Ulster Bank Slide Pack October 2016
Ulster Bank Slide Pack October 2016Ulster Bank Slide Pack October 2016
Ulster Bank Slide Pack October 2016
 
Slide pack Ulster Bank NI PMI March 2016
Slide pack Ulster Bank NI PMI March 2016Slide pack Ulster Bank NI PMI March 2016
Slide pack Ulster Bank NI PMI March 2016
 
Advice for the Wise - May 2016
Advice for the Wise - May 2016Advice for the Wise - May 2016
Advice for the Wise - May 2016
 
RBI Monetary Policy 2013-14
RBI Monetary Policy 2013-14RBI Monetary Policy 2013-14
RBI Monetary Policy 2013-14
 
Advice for the Wise - August 2016
Advice for the Wise - August 2016Advice for the Wise - August 2016
Advice for the Wise - August 2016
 
Rong Viet Securities - Investment Strategy Report November 2017
Rong Viet Securities - Investment Strategy Report November 2017Rong Viet Securities - Investment Strategy Report November 2017
Rong Viet Securities - Investment Strategy Report November 2017
 
The World This Week - 16th to 20th May, 2016
The World This Week - 16th to 20th May, 2016The World This Week - 16th to 20th May, 2016
The World This Week - 16th to 20th May, 2016
 
Olivier Desbarres: Brexit what happens next?
Olivier Desbarres: Brexit what happens next?Olivier Desbarres: Brexit what happens next?
Olivier Desbarres: Brexit what happens next?
 
The World This Week - 23rd to 27th May, 2016
The World This Week -  23rd to 27th May, 2016The World This Week -  23rd to 27th May, 2016
The World This Week - 23rd to 27th May, 2016
 
Weekly media update 04.01.2016
Weekly media update 04.01.2016Weekly media update 04.01.2016
Weekly media update 04.01.2016
 
Economic and social survey of Asia Pacific 2016
Economic and social survey of Asia Pacific 2016Economic and social survey of Asia Pacific 2016
Economic and social survey of Asia Pacific 2016
 
The World This Week - 11th to 15th July, 2016
The World This Week - 11th to 15th July, 2016The World This Week - 11th to 15th July, 2016
The World This Week - 11th to 15th July, 2016
 
The World This Week - 25 to 29th July, 2016
The World This Week - 25 to 29th July, 2016The World This Week - 25 to 29th July, 2016
The World This Week - 25 to 29th July, 2016
 
Economy Matters September- October 2014
Economy Matters September- October 2014 Economy Matters September- October 2014
Economy Matters September- October 2014
 
LPL Research 2014 Mid-Year
LPL Research 2014 Mid-Year LPL Research 2014 Mid-Year
LPL Research 2014 Mid-Year
 
The World This Week - 25th to 29th April, 2016
The World This Week - 25th to 29th April, 2016The World This Week - 25th to 29th April, 2016
The World This Week - 25th to 29th April, 2016
 

Viewers also liked

Viewers also liked (16)

HCMC Quarterly Knowledge Report | Q1 2016
HCMC Quarterly Knowledge Report | Q1 2016 HCMC Quarterly Knowledge Report | Q1 2016
HCMC Quarterly Knowledge Report | Q1 2016
 
Vietnam Quarterly Knowledge Report | Q1 2016
Vietnam Quarterly Knowledge Report | Q1 2016 Vietnam Quarterly Knowledge Report | Q1 2016
Vietnam Quarterly Knowledge Report | Q1 2016
 
HCMC Quarterly Knowledge Report | Q2 2016
HCMC Quarterly Knowledge Report | Q2 2016 HCMC Quarterly Knowledge Report | Q2 2016
HCMC Quarterly Knowledge Report | Q2 2016
 
Hanoi Quarterly Knowledge Report | Q3 2016
Hanoi Quarterly Knowledge Report | Q3 2016 Hanoi Quarterly Knowledge Report | Q3 2016
Hanoi Quarterly Knowledge Report | Q3 2016
 
2014 Colliers Global Investor Sentiment
2014 Colliers Global Investor Sentiment2014 Colliers Global Investor Sentiment
2014 Colliers Global Investor Sentiment
 
Asia Property Capital Quarterly - September 2016
Asia Property Capital Quarterly - September 2016Asia Property Capital Quarterly - September 2016
Asia Property Capital Quarterly - September 2016
 
HCMC CBD Market Report | Apr 2016 (VN)
HCMC CBD Market Report | Apr 2016 (VN)HCMC CBD Market Report | Apr 2016 (VN)
HCMC CBD Market Report | Apr 2016 (VN)
 
HCMC Quarterly Knowledge Report | Q3 2016
HCMC Quarterly Knowledge Report | Q3 2016 HCMC Quarterly Knowledge Report | Q3 2016
HCMC Quarterly Knowledge Report | Q3 2016
 
CBD Monthly Report | January 2016
CBD Monthly Report | January 2016CBD Monthly Report | January 2016
CBD Monthly Report | January 2016
 
CBD Monthly Report | January 2016 (VN)
CBD Monthly Report | January 2016 (VN)CBD Monthly Report | January 2016 (VN)
CBD Monthly Report | January 2016 (VN)
 
Hanoi Market Insights Q1 2016 (VN)
Hanoi Market Insights Q1 2016 (VN)Hanoi Market Insights Q1 2016 (VN)
Hanoi Market Insights Q1 2016 (VN)
 
Hanoi Quarterly Knowledge Report | Q2 2016
Hanoi Quarterly Knowledge Report | Q2 2016 Hanoi Quarterly Knowledge Report | Q2 2016
Hanoi Quarterly Knowledge Report | Q2 2016
 
HCMC Market Insights Q1 2016 (EN)
HCMC Market Insights Q1 2016 (EN)HCMC Market Insights Q1 2016 (EN)
HCMC Market Insights Q1 2016 (EN)
 
Asia Pacific: Colliers Radar - The dragons rise anew
Asia Pacific: Colliers Radar - The dragons rise anewAsia Pacific: Colliers Radar - The dragons rise anew
Asia Pacific: Colliers Radar - The dragons rise anew
 
Vietnam Quarterly Knowledge Report | Q3 2016
Vietnam Quarterly Knowledge Report | Q3 2016 Vietnam Quarterly Knowledge Report | Q3 2016
Vietnam Quarterly Knowledge Report | Q3 2016
 
Vietnam Quarterly Knowledge Report | Q2 2016
Vietnam Quarterly Knowledge Report | Q2 2016 Vietnam Quarterly Knowledge Report | Q2 2016
Vietnam Quarterly Knowledge Report | Q2 2016
 

Similar to Hanoi Market Insights Q1 2016 (EN)

Cushman & Wakefield market beat report Q.2 2013
Cushman & Wakefield market beat report Q.2 2013Cushman & Wakefield market beat report Q.2 2013
Cushman & Wakefield market beat report Q.2 2013Trang Le
 
CW_MarketBeat_Vietnam_4Q15
CW_MarketBeat_Vietnam_4Q15CW_MarketBeat_Vietnam_4Q15
CW_MarketBeat_Vietnam_4Q15Trang Le
 
Q3.2015.Vietnam.Marketreport.Cushman&Wakefield.Eng
Q3.2015.Vietnam.Marketreport.Cushman&Wakefield.EngQ3.2015.Vietnam.Marketreport.Cushman&Wakefield.Eng
Q3.2015.Vietnam.Marketreport.Cushman&Wakefield.EngTrang Le
 
Q.3 2015 Vietnam real estate market report (English)
Q.3 2015 Vietnam real estate market report (English)Q.3 2015 Vietnam real estate market report (English)
Q.3 2015 Vietnam real estate market report (English)Trang Le
 
4Q_2015_RetailReport_email
4Q_2015_RetailReport_email4Q_2015_RetailReport_email
4Q_2015_RetailReport_emailPatrick Anthon
 
Q.1 2016 Vietnam Market beat report_ Eng
Q.1 2016 Vietnam Market beat report_ EngQ.1 2016 Vietnam Market beat report_ Eng
Q.1 2016 Vietnam Market beat report_ EngTrang Le
 
Metro Manila Property Outlook 2015
Metro Manila Property Outlook 2015Metro Manila Property Outlook 2015
Metro Manila Property Outlook 2015KMC Savills, Inc.
 
Prak avenue raymond porter's five model 4ps
Prak avenue raymond porter's five model 4psPrak avenue raymond porter's five model 4ps
Prak avenue raymond porter's five model 4psKshitijPathak15
 
Final project report on - Raymonds - Park Avenue Deo
Final project report on - Raymonds - Park Avenue DeoFinal project report on - Raymonds - Park Avenue Deo
Final project report on - Raymonds - Park Avenue DeoSabyasachi Das
 
Vietnam MB Q2 2015 English
Vietnam MB Q2 2015 EnglishVietnam MB Q2 2015 English
Vietnam MB Q2 2015 EnglishTrang Le
 
Philippine Real Estate Market Insight Report - 3rd Quarter 2017: To Build or ...
Philippine Real Estate Market Insight Report - 3rd Quarter 2017: To Build or ...Philippine Real Estate Market Insight Report - 3rd Quarter 2017: To Build or ...
Philippine Real Estate Market Insight Report - 3rd Quarter 2017: To Build or ...Bryan Barredo
 
Vietnam Research Forecast Report 2Q2013 EN
Vietnam Research Forecast Report 2Q2013 ENVietnam Research Forecast Report 2Q2013 EN
Vietnam Research Forecast Report 2Q2013 ENKyNam Doan
 

Similar to Hanoi Market Insights Q1 2016 (EN) (20)

Hanoi Market Insights Q42015 (EN)
Hanoi Market Insights Q42015 (EN)Hanoi Market Insights Q42015 (EN)
Hanoi Market Insights Q42015 (EN)
 
HCMC Market Insights Q42015 (EN)
HCMC Market Insights Q42015 (EN)HCMC Market Insights Q42015 (EN)
HCMC Market Insights Q42015 (EN)
 
HCMC Market Insights Q32015 (English version)
HCMC Market Insights Q32015 (English version)HCMC Market Insights Q32015 (English version)
HCMC Market Insights Q32015 (English version)
 
Ha Noi Market Insights Q32015 - Retail Sector (ENG)
Ha Noi Market Insights Q32015 - Retail Sector (ENG)Ha Noi Market Insights Q32015 - Retail Sector (ENG)
Ha Noi Market Insights Q32015 - Retail Sector (ENG)
 
Cushman & Wakefield market beat report Q.2 2013
Cushman & Wakefield market beat report Q.2 2013Cushman & Wakefield market beat report Q.2 2013
Cushman & Wakefield market beat report Q.2 2013
 
HN Market Insights Q22015 - Retail Sector (ENG)
HN Market Insights Q22015 - Retail Sector (ENG)HN Market Insights Q22015 - Retail Sector (ENG)
HN Market Insights Q22015 - Retail Sector (ENG)
 
CW_MarketBeat_Vietnam_4Q15
CW_MarketBeat_Vietnam_4Q15CW_MarketBeat_Vietnam_4Q15
CW_MarketBeat_Vietnam_4Q15
 
Q3.2015.Vietnam.Marketreport.Cushman&Wakefield.Eng
Q3.2015.Vietnam.Marketreport.Cushman&Wakefield.EngQ3.2015.Vietnam.Marketreport.Cushman&Wakefield.Eng
Q3.2015.Vietnam.Marketreport.Cushman&Wakefield.Eng
 
Q.3 2015 Vietnam real estate market report (English)
Q.3 2015 Vietnam real estate market report (English)Q.3 2015 Vietnam real estate market report (English)
Q.3 2015 Vietnam real estate market report (English)
 
4Q_2015_RetailReport_email
4Q_2015_RetailReport_email4Q_2015_RetailReport_email
4Q_2015_RetailReport_email
 
Q.1 2016 Vietnam Market beat report_ Eng
Q.1 2016 Vietnam Market beat report_ EngQ.1 2016 Vietnam Market beat report_ Eng
Q.1 2016 Vietnam Market beat report_ Eng
 
HCMC Market Insights Q22015 - Retail Sector (ENG)
HCMC Market Insights Q22015 - Retail Sector (ENG)HCMC Market Insights Q22015 - Retail Sector (ENG)
HCMC Market Insights Q22015 - Retail Sector (ENG)
 
Metro Manila Property Outlook 2015
Metro Manila Property Outlook 2015Metro Manila Property Outlook 2015
Metro Manila Property Outlook 2015
 
Prak avenue raymond porter's five model 4ps
Prak avenue raymond porter's five model 4psPrak avenue raymond porter's five model 4ps
Prak avenue raymond porter's five model 4ps
 
Final project report on - Raymonds - Park Avenue Deo
Final project report on - Raymonds - Park Avenue DeoFinal project report on - Raymonds - Park Avenue Deo
Final project report on - Raymonds - Park Avenue Deo
 
Vietnam MB Q2 2015 English
Vietnam MB Q2 2015 EnglishVietnam MB Q2 2015 English
Vietnam MB Q2 2015 English
 
Philippine Real Estate Market Insight Report - 3rd Quarter 2017: To Build or ...
Philippine Real Estate Market Insight Report - 3rd Quarter 2017: To Build or ...Philippine Real Estate Market Insight Report - 3rd Quarter 2017: To Build or ...
Philippine Real Estate Market Insight Report - 3rd Quarter 2017: To Build or ...
 
Vietnam Research & Forecast Report | Q22013 (EN)
Vietnam Research & Forecast Report | Q22013 (EN)Vietnam Research & Forecast Report | Q22013 (EN)
Vietnam Research & Forecast Report | Q22013 (EN)
 
Vietnam Research Forecast Report 2Q2013 EN
Vietnam Research Forecast Report 2Q2013 ENVietnam Research Forecast Report 2Q2013 EN
Vietnam Research Forecast Report 2Q2013 EN
 
Market report q4 2021
Market report q4 2021Market report q4 2021
Market report q4 2021
 

More from Colliers International | Vietnam (13)

Vietnam Quarterly Knowledge Report | Q4 2016
Vietnam Quarterly Knowledge Report | Q4 2016 Vietnam Quarterly Knowledge Report | Q4 2016
Vietnam Quarterly Knowledge Report | Q4 2016
 
Hanoi Quarterly Knowledge Report | Q4 2016
Hanoi Quarterly Knowledge Report | Q4 2016 Hanoi Quarterly Knowledge Report | Q4 2016
Hanoi Quarterly Knowledge Report | Q4 2016
 
HCMC Quarterly Knowledge Report | Q4 2016
HCMC Quarterly Knowledge Report | Q4 2016 HCMC Quarterly Knowledge Report | Q4 2016
HCMC Quarterly Knowledge Report | Q4 2016
 
IHG - General Information
IHG - General InformationIHG - General Information
IHG - General Information
 
IRS - Aparments
IRS - AparmentsIRS - Aparments
IRS - Aparments
 
IRS - General Information
IRS - General InformationIRS - General Information
IRS - General Information
 
HCMC CBD Market Report | Apr 2016 (EN)
HCMC CBD Market Report | Apr 2016 (EN)HCMC CBD Market Report | Apr 2016 (EN)
HCMC CBD Market Report | Apr 2016 (EN)
 
HCMC CBD Market Report | Feb 2016 (VN)
HCMC CBD Market Report | Feb 2016 (VN)HCMC CBD Market Report | Feb 2016 (VN)
HCMC CBD Market Report | Feb 2016 (VN)
 
HCMC CBD Market Report | Feb 2016 (EN)
HCMC CBD Market Report | Feb 2016 (EN)HCMC CBD Market Report | Feb 2016 (EN)
HCMC CBD Market Report | Feb 2016 (EN)
 
HCMC Residential Launch Update | Feb 2016 (EN)
HCMC Residential Launch Update | Feb 2016 (EN)HCMC Residential Launch Update | Feb 2016 (EN)
HCMC Residential Launch Update | Feb 2016 (EN)
 
HCMC CBD Market Report | Jan 2016 (VN)
HCMC CBD Market Report | Jan 2016 (VN)HCMC CBD Market Report | Jan 2016 (VN)
HCMC CBD Market Report | Jan 2016 (VN)
 
HCMC CBD Market Report | Jan 2016 (EN)
HCMC CBD Market Report | Jan 2016 (EN)HCMC CBD Market Report | Jan 2016 (EN)
HCMC CBD Market Report | Jan 2016 (EN)
 
4Q 2015 Asia Pacific Office Market Map
4Q 2015 Asia Pacific Office Market Map4Q 2015 Asia Pacific Office Market Map
4Q 2015 Asia Pacific Office Market Map
 

Recently uploaded

Puravankara Mundhwa Pune E-Brochure.pdf
Puravankara Mundhwa Pune  E-Brochure.pdfPuravankara Mundhwa Pune  E-Brochure.pdf
Puravankara Mundhwa Pune E-Brochure.pdfManishSaxena95
 
Call Girls In Madipur Metro Delhi꧁ +91)8447779280꧂Low Rate 2 short 2000 full ...
Call Girls In Madipur Metro Delhi꧁ +91)8447779280꧂Low Rate 2 short 2000 full ...Call Girls In Madipur Metro Delhi꧁ +91)8447779280꧂Low Rate 2 short 2000 full ...
Call Girls In Madipur Metro Delhi꧁ +91)8447779280꧂Low Rate 2 short 2000 full ...asmaqueen5
 
Call Girls In Vasundhara Ghaziabad ❤️8860477959 Low Rate Escorts Service In 2...
Call Girls In Vasundhara Ghaziabad ❤️8860477959 Low Rate Escorts Service In 2...Call Girls In Vasundhara Ghaziabad ❤️8860477959 Low Rate Escorts Service In 2...
Call Girls In Vasundhara Ghaziabad ❤️8860477959 Low Rate Escorts Service In 2...lizamodels9
 
Low Rate Call Girls in Tughlakabad Delhi Call 9990771857
Low Rate Call Girls in Tughlakabad Delhi Call 9990771857Low Rate Call Girls in Tughlakabad Delhi Call 9990771857
Low Rate Call Girls in Tughlakabad Delhi Call 9990771857delhimodel235
 
Call Girls In Mundka Industrial Metro@꧂8447779280 ↬Enjoy ꧂Escort Service in ...
Call Girls In Mundka Industrial Metro@꧂8447779280 ↬Enjoy ꧂Escort Service in  ...Call Girls In Mundka Industrial Metro@꧂8447779280 ↬Enjoy ꧂Escort Service in  ...
Call Girls In Mundka Industrial Metro@꧂8447779280 ↬Enjoy ꧂Escort Service in ...asmaqueen5
 
Call Girls In Mayur Vihar-1 Delhi ❤️8860477959 Good Looking Escorts In 24/7 D...
Call Girls In Mayur Vihar-1 Delhi ❤️8860477959 Good Looking Escorts In 24/7 D...Call Girls In Mayur Vihar-1 Delhi ❤️8860477959 Good Looking Escorts In 24/7 D...
Call Girls In Mayur Vihar-1 Delhi ❤️8860477959 Good Looking Escorts In 24/7 D...lizamodels9
 
How to Build Multifamily and Laneway Suites in Toronto!! (feat. Expert Archi...
How to Build Multifamily and Laneway Suites  in Toronto!! (feat. Expert Archi...How to Build Multifamily and Laneway Suites  in Toronto!! (feat. Expert Archi...
How to Build Multifamily and Laneway Suites in Toronto!! (feat. Expert Archi...Volition Properties
 
What Is Biophilic Design .pdf
What Is Biophilic Design            .pdfWhat Is Biophilic Design            .pdf
What Is Biophilic Design .pdfyamunaNMH
 
Call Girls in Sarai Kale Khan Delhi 💯Call Us 🔝8264348440🔝
Call Girls in Sarai Kale Khan Delhi 💯Call Us 🔝8264348440🔝Call Girls in Sarai Kale Khan Delhi 💯Call Us 🔝8264348440🔝
Call Girls in Sarai Kale Khan Delhi 💯Call Us 🔝8264348440🔝soniya singh
 
Building Dreams: Newman Leech's Visionary Approach to Real Estate Investment
Building Dreams: Newman Leech's Visionary Approach to Real Estate InvestmentBuilding Dreams: Newman Leech's Visionary Approach to Real Estate Investment
Building Dreams: Newman Leech's Visionary Approach to Real Estate InvestmentNewman George Leech
 
Eco-Efficient Living: Redefining Sustainability through Leech's Green Design ...
Eco-Efficient Living: Redefining Sustainability through Leech's Green Design ...Eco-Efficient Living: Redefining Sustainability through Leech's Green Design ...
Eco-Efficient Living: Redefining Sustainability through Leech's Green Design ...Newman George Leech
 
Call Girls In The Lalit New Delhi ❤️8860477959 Good Looking Escorts In 24/7 D...
Call Girls In The Lalit New Delhi ❤️8860477959 Good Looking Escorts In 24/7 D...Call Girls In The Lalit New Delhi ❤️8860477959 Good Looking Escorts In 24/7 D...
Call Girls In The Lalit New Delhi ❤️8860477959 Good Looking Escorts In 24/7 D...lizamodels9
 
Low Rate Call Girls in Akshardham Delhi Call 9990771857
Low Rate Call Girls in Akshardham   Delhi Call 9990771857Low Rate Call Girls in Akshardham   Delhi Call 9990771857
Low Rate Call Girls in Akshardham Delhi Call 9990771857delhimodel235
 
8 Key Elements for Comfortable Farmland Living
8 Key Elements for Comfortable Farmland Living 8 Key Elements for Comfortable Farmland Living
8 Key Elements for Comfortable Farmland Living Farmland Bazaar
 
The Omaxe State Dwarka Delhi-broucher.pdf.pdf
The Omaxe State Dwarka Delhi-broucher.pdf.pdfThe Omaxe State Dwarka Delhi-broucher.pdf.pdf
The Omaxe State Dwarka Delhi-broucher.pdf.pdfkratirudram
 
Rustomjee The Panorama At Pali Hill, Bandra West, Mumbai - Brochure.pdf
Rustomjee The Panorama At Pali Hill, Bandra West, Mumbai - Brochure.pdfRustomjee The Panorama At Pali Hill, Bandra West, Mumbai - Brochure.pdf
Rustomjee The Panorama At Pali Hill, Bandra West, Mumbai - Brochure.pdfmonikasharma630
 
Call Girls in Inderpuri Delhi 💯Call Us 🔝8264348440🔝
Call Girls in Inderpuri Delhi 💯Call Us 🔝8264348440🔝Call Girls in Inderpuri Delhi 💯Call Us 🔝8264348440🔝
Call Girls in Inderpuri Delhi 💯Call Us 🔝8264348440🔝soniya singh
 
)_Call Girls In Radisson Blu Plaza Hotel, Delhi Airport ❤️8860477959 _Indepen...
)_Call Girls In Radisson Blu Plaza Hotel, Delhi Airport ❤️8860477959 _Indepen...)_Call Girls In Radisson Blu Plaza Hotel, Delhi Airport ❤️8860477959 _Indepen...
)_Call Girls In Radisson Blu Plaza Hotel, Delhi Airport ❤️8860477959 _Indepen...lizamodels9
 
Call Girls in Kashmiri Gate Delhi 💯Call Us 🔝8264348440🔝
Call Girls in Kashmiri Gate Delhi 💯Call Us 🔝8264348440🔝Call Girls in Kashmiri Gate Delhi 💯Call Us 🔝8264348440🔝
Call Girls in Kashmiri Gate Delhi 💯Call Us 🔝8264348440🔝soniya singh
 

Recently uploaded (20)

Puravankara Mundhwa Pune E-Brochure.pdf
Puravankara Mundhwa Pune  E-Brochure.pdfPuravankara Mundhwa Pune  E-Brochure.pdf
Puravankara Mundhwa Pune E-Brochure.pdf
 
Call Girls In Madipur Metro Delhi꧁ +91)8447779280꧂Low Rate 2 short 2000 full ...
Call Girls In Madipur Metro Delhi꧁ +91)8447779280꧂Low Rate 2 short 2000 full ...Call Girls In Madipur Metro Delhi꧁ +91)8447779280꧂Low Rate 2 short 2000 full ...
Call Girls In Madipur Metro Delhi꧁ +91)8447779280꧂Low Rate 2 short 2000 full ...
 
Call Girls In Vasundhara Ghaziabad ❤️8860477959 Low Rate Escorts Service In 2...
Call Girls In Vasundhara Ghaziabad ❤️8860477959 Low Rate Escorts Service In 2...Call Girls In Vasundhara Ghaziabad ❤️8860477959 Low Rate Escorts Service In 2...
Call Girls In Vasundhara Ghaziabad ❤️8860477959 Low Rate Escorts Service In 2...
 
Low Rate Call Girls in Tughlakabad Delhi Call 9990771857
Low Rate Call Girls in Tughlakabad Delhi Call 9990771857Low Rate Call Girls in Tughlakabad Delhi Call 9990771857
Low Rate Call Girls in Tughlakabad Delhi Call 9990771857
 
Call Girls In Mundka Industrial Metro@꧂8447779280 ↬Enjoy ꧂Escort Service in ...
Call Girls In Mundka Industrial Metro@꧂8447779280 ↬Enjoy ꧂Escort Service in  ...Call Girls In Mundka Industrial Metro@꧂8447779280 ↬Enjoy ꧂Escort Service in  ...
Call Girls In Mundka Industrial Metro@꧂8447779280 ↬Enjoy ꧂Escort Service in ...
 
Call Girls In Mayur Vihar-1 Delhi ❤️8860477959 Good Looking Escorts In 24/7 D...
Call Girls In Mayur Vihar-1 Delhi ❤️8860477959 Good Looking Escorts In 24/7 D...Call Girls In Mayur Vihar-1 Delhi ❤️8860477959 Good Looking Escorts In 24/7 D...
Call Girls In Mayur Vihar-1 Delhi ❤️8860477959 Good Looking Escorts In 24/7 D...
 
How to Build Multifamily and Laneway Suites in Toronto!! (feat. Expert Archi...
How to Build Multifamily and Laneway Suites  in Toronto!! (feat. Expert Archi...How to Build Multifamily and Laneway Suites  in Toronto!! (feat. Expert Archi...
How to Build Multifamily and Laneway Suites in Toronto!! (feat. Expert Archi...
 
What Is Biophilic Design .pdf
What Is Biophilic Design            .pdfWhat Is Biophilic Design            .pdf
What Is Biophilic Design .pdf
 
Call Girls in Sarai Kale Khan Delhi 💯Call Us 🔝8264348440🔝
Call Girls in Sarai Kale Khan Delhi 💯Call Us 🔝8264348440🔝Call Girls in Sarai Kale Khan Delhi 💯Call Us 🔝8264348440🔝
Call Girls in Sarai Kale Khan Delhi 💯Call Us 🔝8264348440🔝
 
Building Dreams: Newman Leech's Visionary Approach to Real Estate Investment
Building Dreams: Newman Leech's Visionary Approach to Real Estate InvestmentBuilding Dreams: Newman Leech's Visionary Approach to Real Estate Investment
Building Dreams: Newman Leech's Visionary Approach to Real Estate Investment
 
Eco-Efficient Living: Redefining Sustainability through Leech's Green Design ...
Eco-Efficient Living: Redefining Sustainability through Leech's Green Design ...Eco-Efficient Living: Redefining Sustainability through Leech's Green Design ...
Eco-Efficient Living: Redefining Sustainability through Leech's Green Design ...
 
Call Girls In The Lalit New Delhi ❤️8860477959 Good Looking Escorts In 24/7 D...
Call Girls In The Lalit New Delhi ❤️8860477959 Good Looking Escorts In 24/7 D...Call Girls In The Lalit New Delhi ❤️8860477959 Good Looking Escorts In 24/7 D...
Call Girls In The Lalit New Delhi ❤️8860477959 Good Looking Escorts In 24/7 D...
 
Low Rate Call Girls in Akshardham Delhi Call 9990771857
Low Rate Call Girls in Akshardham   Delhi Call 9990771857Low Rate Call Girls in Akshardham   Delhi Call 9990771857
Low Rate Call Girls in Akshardham Delhi Call 9990771857
 
8 Key Elements for Comfortable Farmland Living
8 Key Elements for Comfortable Farmland Living 8 Key Elements for Comfortable Farmland Living
8 Key Elements for Comfortable Farmland Living
 
The Omaxe State Dwarka Delhi-broucher.pdf.pdf
The Omaxe State Dwarka Delhi-broucher.pdf.pdfThe Omaxe State Dwarka Delhi-broucher.pdf.pdf
The Omaxe State Dwarka Delhi-broucher.pdf.pdf
 
Rustomjee The Panorama At Pali Hill, Bandra West, Mumbai - Brochure.pdf
Rustomjee The Panorama At Pali Hill, Bandra West, Mumbai - Brochure.pdfRustomjee The Panorama At Pali Hill, Bandra West, Mumbai - Brochure.pdf
Rustomjee The Panorama At Pali Hill, Bandra West, Mumbai - Brochure.pdf
 
Call Girls in Inderpuri Delhi 💯Call Us 🔝8264348440🔝
Call Girls in Inderpuri Delhi 💯Call Us 🔝8264348440🔝Call Girls in Inderpuri Delhi 💯Call Us 🔝8264348440🔝
Call Girls in Inderpuri Delhi 💯Call Us 🔝8264348440🔝
 
Call Girls in Mahavir Nagar whatsaap call US +919953056974
Call Girls in Mahavir Nagar  whatsaap call US  +919953056974Call Girls in Mahavir Nagar  whatsaap call US  +919953056974
Call Girls in Mahavir Nagar whatsaap call US +919953056974
 
)_Call Girls In Radisson Blu Plaza Hotel, Delhi Airport ❤️8860477959 _Indepen...
)_Call Girls In Radisson Blu Plaza Hotel, Delhi Airport ❤️8860477959 _Indepen...)_Call Girls In Radisson Blu Plaza Hotel, Delhi Airport ❤️8860477959 _Indepen...
)_Call Girls In Radisson Blu Plaza Hotel, Delhi Airport ❤️8860477959 _Indepen...
 
Call Girls in Kashmiri Gate Delhi 💯Call Us 🔝8264348440🔝
Call Girls in Kashmiri Gate Delhi 💯Call Us 🔝8264348440🔝Call Girls in Kashmiri Gate Delhi 💯Call Us 🔝8264348440🔝
Call Girls in Kashmiri Gate Delhi 💯Call Us 🔝8264348440🔝
 

Hanoi Market Insights Q1 2016 (EN)

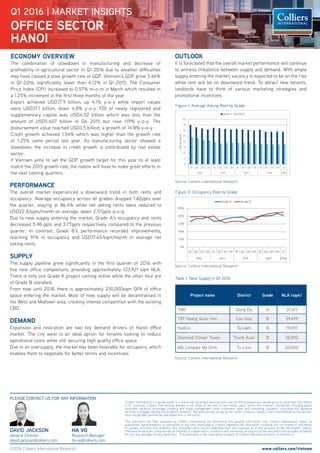
  • 1. PERFORMANCE The overall market experienced a downward trend in both rents and occupancy. Average occupancy across all grades dropped 1.82ppts over the quarter, staying at 86.4% while net asking rents were reduced to USD22.8/sqm/month on average, down 2.57ppts q-o-q. Due to new supply entering the market, Grade A’s occupancy and rents decreased 5.98 ppts and 3.77ppts respectively compared to the previous quarter. In contrast, Grade B’s performance recorded improvements, reaching 91% in occupancy and USD17.65/sqm/month in average net asking rents. SUPPLY The supply pipeline grew significantly in the first quarter of 2016 with five new office completions, providing approximately 133,921 sqm NLA. There is only one Grade A project coming online while the other four are of Grade B standard. From now until 2018, there is approximately 330,000sqm GFA of office space entering the market. Most of new supply will be decentralised in the West and Midtown area, creating intense competition with the existing CBD. DEMAND Expansion and relocation are two key demand drivers of Hanoi office market. The city west is an ideal option for tenants looking to reduce operational costs while still securing high quality office space. Due to an oversupply, the market has been favorable for occupiers, which enables them to negotiate for better terms and incentives. OFFICE SECTOR Q1 2016 | MARKET INSIGHTS HANOI ECONOMY OVERVIEW The combination of slowdown in manufacturing and decrease of profitability in agricultural sector in Q1-2016 due to weather difficulties may have caused a slow growth rate of GDP. Vietnam’s GDP grew 5.46% in Q1-2016, significantly lower than 6.12% in Q1-2015. The Consumer Price Index (CPI) increased to 0.57% m-o-m in March which resulted in a 1.25% increment in the first three months of the year. Export achieved USD37.9 billion, up 4.1% y-o-y while import values were USD37.1 billion, down 4.8% y-o-y. FDI of newly registered and supplementary capital was USD4.02 billion which was less than the amount of USD5.607 billion in Q4 2015 but rose 119% y-o-y. The disbursement value reached USD3.5 billion, a growth of 14.8% y-o-y. Credit growth achieved 1.54% which was higher than the growth rate of 1.25% same period last year. As manufacturing sector showed a slowdown, the increase in credit growth is contributed by real estate sector. If Vietnam aims to set the GDP growth target for this year to at least match the 2015 growth rate, the nation will have to make great efforts in the next coming quarters. DAVID JACKSON General Director david.jackson@colliers.com PLEASE CONTACT US FOR ANY INFORMATION www.colliers.com/vietnam Colliers International is a global leader in commercial real estate services, with over 16,300 professionals operating out of more than 502 offices in 67 countries. Colliers International delivers a full range of services to real estate users, owner and investors worldwide, including global corporate solutions, brokerage, property and asset, management, hotel investment sales and consulting, valuation, consulting and appraisal services, mortgage banking and insightful research. The latest annual survey by the Lipsey Company ranked Colliers International as the second- most recognized commercial real estate firm in the world. This document has been prepared by Colliers International for advertising and general information only. Colliers International makes no guarantees, representations or warranties of any kind, expressed or implied, regarding the information including, but not limited to, warranties of content, accuracy and reliability. Any interested party should undertake their own inquiries as to the accuracy of the information. Colliers International excludes unequivocally all inferred or implied terms, conditions and warranties arising out of this document and excludes all liability for loss and damages arising there from. This publication is the copyrighted property of Colliers International and/or its licensor(s). ©2016 Colliers International Research OUTLOOK It is forecasted that the overall market performance will continue to witness imbalance between supply and demand. With ample supply entering the market, vacancy is expected to be on the rise while rent will be on downward trend. To attract new tenants, landlords have to think of various marketing strategies and promotional incentives. Figure 1: Average Asking Rent by Grade Table 1: New Supply in Q1 2016 Figure 2: Occupancy Rate by Grade Source: Colliers International Research Source: Colliers International Research Source: Colliers International Research HA VO Research Manager ha.vo@colliers.com 0% 20% 40% 60% 80% 100% Q1 Q2 Q3 Q4 Q1 Q2 Q3 Q4 Q1 Q2 Q3 Q4 Q1 Q2 Q3 Q4 Q1 2012 2013 2014 2015 2016 Grade A Grade B Project name District Grade NLA (sqm) TNR Dong Da A 37,411 789 Hoang Quoc Viet Cau Giay B 39,419 Hadico Tu Liem B 19,091 Diamond Flower Tower Thanh Xuan B 18,000 MD Complex My Dinh Tu Liem B 20,000 0 5 10 15 20 25 30 35 40 Q1 Q2 Q3 Q4 Q1 Q2 Q3 Q4 Q1 Q2 Q3 Q4 Q1 Q2 Q3 Q4 Q1 2012 2013 2014 2015 2016 US$/sqm/month Grade A Grade B
  • 2. PERFORMANCE Overall occupancy rate decreased 0.9ppts q-o-q, staying at 88.5% due to weak business performance of some retail centers. The average net asking rents nominally increased 0.2ppts q-o-q. The CBD and non CBD sub-markets recorded large variances with rent, staying at USD81.44/sqm/month and USD28.89/sqm/month respectively. SUPPLY The retail stock remained stable in the review quarter as no new project came online. Currently, Hanoi market has approximately 750,000sqm NLA from 50 buildings. In terms of retail format, shopping centers take the largest share in the supply pipeline, accounting for nearly 80% of the total net lettable area. The market share of department stores and retail podiums are 10% and 11% respectively. By location, the CBD is home of 4% of total retail supply, providing a majority of small-scale podiums. The remaining supply is located in non-CBD districts, including large-scale shopping centers and department stores. DEMAND Vietnam’s young population and rising urban middle-class result in strong consumer-spending potentials. However, given relatively low average income across the nation, demand for affordable goods and services outweighs luxury branded products. To achieve higher footfall in all retail developments, retailers should focus on selling mid-end items to customers. RETAIL SECTOR Q1 2016 | MARKET INSIGHTS HANOI ECONOMY OVERVIEW The combination of slowdown in manufacturing and decrease of profitability in agricultural sector in Q1-2016 due to weather difficulties may have caused a slow growth rate of GDP. Vietnam’s GDP grew 5.46% in Q1-2016, significantly lower than 6.12% in Q1-2015. The Consumer Price Index (CPI) increased to 0.57% m-o-m in March which resulted in a 1.25% increment in the first three months of the year. Export achieved USD37.9 billion, up 4.1% y-o-y while import values were USD37.1 billion, down 4.8% y-o-y. FDI of newly registered and supplementary capital was USD4.02 billion which was less than the amount of USD5.607 billion in Q4 2015 but rose 119% y-o-y. The disbursement value reached USD3.5 billion, a growth of 14.8% y-o-y. Credit growth achieved 1.54% which was higher than the growth rate of 1.25% same period last year. As manufacturing sector showed a slowdown, the increase in credit growth is contributed by real estate sector. If Vietnam aims to set the GDP growth target for this year to at least match the 2015 growth rate, the nation will have to make great efforts in the next coming quarters. DAVID JACKSON General Director david.jackson@colliers.com PLEASE CONTACT US FOR ANY INFORMATION www.colliers.com/vietnam Colliers International is a global leader in commercial real estate services, with over 16,300 professionals operating out of more than 502 offices in 67 countries. Colliers International delivers a full range of services to real estate users, owner and investors worldwide, including global corporate solutions, brokerage, property and asset, management, hotel investment sales and consulting, valuation, consulting and appraisal services, mortgage banking and insightful research. The latest annual survey by the Lipsey Company ranked Colliers International as the second- most recognized commercial real estate firm in the world. This document has been prepared by Colliers International for advertising and general information only. Colliers International makes no guarantees, representations or warranties of any kind, expressed or implied, regarding the information including, but not limited to, warranties of content, accuracy and reliability. Any interested party should undertake their own inquiries as to the accuracy of the information. Colliers International excludes unequivocally all inferred or implied terms, conditions and warranties arising out of this document and excludes all liability for loss and damages arising there from. This publication is the copyrighted property of Colliers International and/or its licensor(s). ©2016 Colliers International Research OUTLOOK The general outlook for Hanoi retail in the short term is continued oversupply, particularly those outside of the CBD. The market will become more competitive, resulting in pressure on both rents and occupancy rates. To attract more shoppers and satisfy their diversified demand, landlords should organize special marketing events and festivals in their retail centers. Figure 3: Total Supply Figure 2: Occupancy Rate Figure 1: Market Performance Source: Colliers International Research Source: Colliers International Research Source: Colliers International Research HA VO Research Manager ha.vo@colliers.com 0 100,000 200,000 300,000 400,000 500,000 600,000 700,000 800,000 2010 2011 2012 2013 2014 2015 Q1 2016 sqm CBD Non-CBD 75 80 85 90 95 100 2011 2012 2013 2014 2015 2016 % CBD Non-CBD 0 10 20 30 40 50 60 70 80 75% 80% 85% 90% 95% 100% 2008 2009 2010 2011 2012 2013 2014 2015 Q1 2016 US$/sqm/month Rental rate Occupancy
  • 3. PERFORMANCE The review quarter recorded 3,980 successful transactions, down 34% compared to the previous quarter. Sales momentum continued to be strong in high-end and mid-end segments. On the primary market, price growth of 2.9% q-o-q was recorded in the mid-end segment. Asking price was soften in high-end and low-end projects, a drop of 0.3% and 7.8% q-o-q respectively. Projects with convenient traffic & location, reputable developers and well-established facilities and amenities tend to increase their sale price. SUPPLY New supply was ample in Q1 2016 with approximately 4,479 units from 13 projects. Ha Dong, Tu Liem and West Lake are top three locations for new condominium developments during the review quarter. With the ongoing establishment of new townships in sub-urban districts, Hanoi residential market will be abundant with more launches in coming quarters of 2016. DEMAND According to Hanoi Statistics Office, the capital city’s population was 7.21 million in 2013. The number is expected to reach 8 million in 2020 and young population of less than 35 years old will account for 50%. This trend reflects strong potential for the apartment market. CONDOMINIUM SECTOR Q1 2016 | MARKET INSIGHTS HANOI ECONOMY OVERVIEW The combination of slowdown in manufacturing and decrease of profitability in agricultural sector in Q1-2016 due to weather difficulties may have caused a slow growth rate of GDP. Vietnam’s GDP grew 5.46% in Q1-2016, significantly lower than 6.12% in Q1-2015. The Consumer Price Index (CPI) increased to 0.57% m-o-m in March which resulted in a 1.25% increment in the first three months of the year. Export achieved USD37.9 billion, up 4.1% y-o-y while import values were USD37.1 billion, down 4.8% y-o-y. FDI of newly registered and supplementary capital was USD4.02 billion which was less than the amount of USD5.607 billion in Q4 2015 but rose 119% y-o-y. The disbursement value reached USD3.5 billion, a growth of 14.8% y-o-y. Credit growth achieved 1.54% which was higher than the growth rate of 1.25% same period last year. As manufacturing sector showed a slowdown, the increase in credit growth is contributed by real estate sector. If Vietnam aims to set the GDP growth target for this year to at least match the 2015 growth rate, the nation will have to make great efforts in the next coming quarters. DAVID JACKSON General Director david.jackson@colliers.com PLEASE CONTACT US FOR ANY INFORMATION www.colliers.com/vietnam Colliers International is a global leader in commercial real estate services, with over 16,300 professionals operating out of more than 502 offices in 67 countries. Colliers International delivers a full range of services to real estate users, owner and investors worldwide, including global corporate solutions, brokerage, property and asset, management, hotel investment sales and consulting, valuation, consulting and appraisal services, mortgage banking and insightful research. The latest annual survey by the Lipsey Company ranked Colliers International as the second- most recognized commercial real estate firm in the world. This document has been prepared by Colliers International for advertising and general information only. Colliers International makes no guarantees, representations or warranties of any kind, expressed or implied, regarding the information including, but not limited to, warranties of content, accuracy and reliability. Any interested party should undertake their own inquiries as to the accuracy of the information. Colliers International excludes unequivocally all inferred or implied terms, conditions and warranties arising out of this document and excludes all liability for loss and damages arising there from. This publication is the copyrighted property of Colliers International and/or its licensor(s). ©2016 Colliers International Research OUTLOOK As buyers and investors have regained their market confidence, demand for mid-end and high-end segment is expected to remain higher in the next quarters. Affordable units will achieve stable sales volume on the back of reasonable price and strong demand from end-users. Figure 3: Launch Supply by Year Figure 1: Sales by Quarter and Segment Source: Colliers International Research Source: Colliers International Research HA VO Research Manager ha.vo@colliers.com Source: Colliers International Research Figure 2: Changes in Secondary Prices by Quarter -8 -6 -4 -2 0 2 4 6 8 2008 2009 2010 2011 2012 2013 2014 2015 2016 % 0 1,000 2,000 3,000 4,000 5,000 6,000 7,000 Q1 Q2 Q3 Q4 Q1 Q2 Q3 Q4 Q1 Q2 Q3 Q4 Q1 Q2 Q3 Q4 Q1 2012 2013 2014 2015 2016 units Luxury High-end Mid-end Affordable 0 5000 10000 15000 20000 25000 30000 2007 2008 2009 2010 2011 2012 2013 2014 2015 Q1 2016 sqm
  • 4. PERFORMANCE Townhouses dominated sale transactions as 70% of launched dwellings were sold in the first quarter of 2016. On the primary market, sale price remained stable. The average secondary price dropped 0.8% q-o-q for villas but increased 1.3% q-o-q for townhouses. By location, projects in decentralised districts witnessed higher sale price. Compared to the previous quarter, Ha Dong District recorded the highest price growth of 5.5% while Cau Giay and Hoai Duc district had positive price increases of under 5%. SUPPLY The stock increased 1.9% q-o-q in the first quarter of 2016 with the launch of five new projects, providing 859 dwellings. Due to large land availability, Ha Dong district takes the largest market share, representing 27% of supply pipeline. Well-established infrastructure and convenient traffic connection has attracted homebuyers to settle in this area. DEMAND Landed properties are preferred by Vietnamese people as this type of accommodation is believed to increase value over time. Investors and end-users are key demand drivers of the market with purposes of rental income and owner occupation. Speculators who buy a property for capital appreciation account for a small proportion in the buyer profile. Demand for landed houses is expected to become stronger on the back of high urbanization rate and rapid development of infrastructure in Hanoi. VILLA & TOWNHOUSE SECTOR Q1 2016 | MARKET INSIGHTS HANOI ECONOMY OVERVIEW The combination of slowdown in manufacturing and decrease of profitability in agricultural sector in Q1-2016 due to weather difficulties may have caused a slow growth rate of GDP. Vietnam’s GDP grew 5.46% in Q1-2016, significantly lower than 6.12% in Q1-2015. The Consumer Price Index (CPI) increased to 0.57% m-o-m in March which resulted in a 1.25% increment in the first three months of the year. Export achieved USD37.9 billion, up 4.1% y-o-y while import values were USD37.1 billion, down 4.8% y-o-y. FDI of newly registered and supplementary capital was USD4.02 billion which was less than the amount of USD5.607 billion in Q4 2015 but rose 119% y-o-y. The disbursement value reached USD3.5 billion, a growth of 14.8% y-o-y. Credit growth achieved 1.54% which was higher than the growth rate of 1.25% same period last year. As manufacturing sector showed a slowdown, the increase in credit growth is contributed by real estate sector. If Vietnam aims to set the GDP growth target for this year to at least match the 2015 growth rate, the nation will have to make great efforts in the next coming quarters. DAVID JACKSON General Director david.jackson@colliers.com PLEASE CONTACT US FOR ANY INFORMATION www.colliers.com/vietnam Colliers International is a global leader in commercial real estate services, with over 16,300 professionals operating out of more than 502 offices in 67 countries. Colliers International delivers a full range of services to real estate users, owner and investors worldwide, including global corporate solutions, brokerage, property and asset, management, hotel investment sales and consulting, valuation, consulting and appraisal services, mortgage banking and insightful research. The latest annual survey by the Lipsey Company ranked Colliers International as the second-most recognized commercial real estate firm in the world. This document has been prepared by Colliers International for advertising and general information only. Colliers International makes no guarantees, representations or warranties of any kind, expressed or implied, regarding the information including, but not limited to, warranties of content, accuracy and reliability. Any interested party should undertake their own inquiries as to the accuracy of the information. Colliers International excludes unequivocally all inferred or implied terms, conditions and warranties arising out of this document and excludes all liability for loss and damages arising there from. This publication is the copyrighted property of Colliers International and/or its licensor(s). ©2016 Colliers International Research Figure 3: Landed Property, Supply by Quarter Source: Colliers International Research Figure 1: Q-o-Q Changes in Secondary price Source: Colliers International Research Figure 2: Secondary Price by District Source: Colliers International Research OUTLOOK Next quarters of 2016 is expected to have 10 projects coming online and approximately 40 projects under planning stage. Some projects that have been delayed for a long time will be restarted to catch the new market cycle. Projects with reasonable price and good supporting infrastructure will potentially achieve stronger sales volume than others. HA VO Research Manager ha.vo@colliers.com 95 100 105 110 115 120 125 130 26,000 27,000 28,000 29,000 30,000 31,000 32,000 33,000 34,000 Q3 Q4 Q1 Q2 Q3 Q4 Q1 2014 2015 2016 dwellings No. of Dwellings No. of Projects 0 20 40 60 80 100 120 140 160 180 200 Thanh Xuan Cau Giay Tay Ho Tu Liem Hoang Mai Ha Dong Long Bien Thanh Tri Hoai Duc Gia Lam Me Linh USD/sqm Q4-2015 Average Q1-2016 Average Market average price Q4 2015 -15 -10 -5 0 5 10 15 20 0 1000 2000 3000 4000 5000 6000 7000 Q1 Q2 Q3 Q4 Q1 Q2 Q3 Q4 Q1 Q2 Q3 Q4 Q1 Q2 Q3 Q4 Q1 Q2 Q3 Q4 Q1 2011 2012 2013 2014 2015 2016 % USD/sqm Market average price Q4 2015 Q-o-Q changes
  • 5. PERFORMANCE Grade A dropped 1.9ppts q-o-q in rents and 2.4ppts q-o-q in occupancy rates, averaging at USD31.4/sqm/month and 84% respectively. Grade B slightly increased 0.45ppts q-o-q in rents and remained stable in occupancy rates, reaching at USD22.1/sqm/month and 84% respectively. The highest average asking rent for both two Grades was recorded in West Lake and Hoan Kiem district, followed by Cau Giay District and Ba Dinh District. SUPPLY Hanoi serviced apartment market consists of approximately 3,500 units from 38 projects. Grade A accounts for 59% of the total supply, providing 2,054 units from 15 projects. The majority of Grade A supply was located in Ba Dinh, West Lake and Tu Liem district. Grade B takes 41% of the market share with1,442 units from 23 projects. A significant proportion of Grade B is located in Ba Dinh and Hai Ba Trung Districts. DEMAND Expatriates working for multinational enterprises, embassies and consulates, international schools and universities are major occupiers in Hanoi serviced apartments. With increasing FDI inflows to industrial parks scattered around the capital city and Bac Ninh, there is growing demand for serviced accommodation for foreign experts. Despite having to commute everyday between the two cities, expatriates still prefer to stay in Hanoi due to its convenient facilities and attractive social entertainments. SERVICED APARTMENT SECTOR Q1 2016 | MARKET INSIGHTS HANOI ECONOMY OVERVIEW The combination of slowdown in manufacturing and decrease of profitability in agricultural sector in Q1-2016 due to weather difficulties may have caused a slow growth rate of GDP. Vietnam’s GDP grew 5.46% in Q1-2016, significantly lower than 6.12% in Q1-2015. The Consumer Price Index (CPI) increased to 0.57% m-o-m in March which resulted in a 1.25% increment in the first three months of the year. Export achieved USD37.9 billion, up 4.1% y-o-y while import values were USD37.1 billion, down 4.8% y-o-y. FDI of newly registered and supplementary capital was USD4.02 billion which was less than the amount of USD5.607 billion in Q4 2015 but rose 119% y-o-y. The disbursement value reached USD3.5 billion, a growth of 14.8% y-o-y. Credit growth achieved 1.54% which was higher than the growth rate of 1.25% same period last year. As manufacturing sector showed a slowdown, the increase in credit growth is contributed by real estate sector. If Vietnam aims to set the GDP growth target for this year to at least match the 2015 growth rate, the nation will have to make great efforts in the next coming quarters. DAVID JACKSON General Director david.jackson@colliers.com PLEASE CONTACT US FOR ANY INFORMATION www.colliers.com/vietnam Colliers International is a global leader in commercial real estate services, with over 16,300 professionals operating out of more than 502 offices in 67 countries. Colliers International delivers a full range of services to real estate users, owner and investors worldwide, including global corporate solutions, brokerage, property and asset, management, hotel investment sales and consulting, valuation, consulting and appraisal services, mortgage banking and insightful research. The latest annual survey by the Lipsey Company ranked Colliers International as the second- most recognized commercial real estate firm in the world. This document has been prepared by Colliers International for advertising and general information only. Colliers International makes no guarantees, representations or warranties of any kind, expressed or implied, regarding the information including, but not limited to, warranties of content, accuracy and reliability. Any interested party should undertake their own inquiries as to the accuracy of the information. Colliers International excludes unequivocally all inferred or implied terms, conditions and warranties arising out of this document and excludes all liability for loss and damages arising there from. This publication is the copyrighted property of Colliers International and/or its licensor(s). ©2016 Colliers International Research OUTLOOK Due to large existing supply from the market, landlords will be under pressure of reducing asking rents in the coming period. Demand for this type of accommodation will sustainably grow thanks to the rising number of foreign skilled workers in industrial zones in Hanoi and neighboring provinces. Figure 1: Average Asking Rent by Grade Source: Colliers International Research Figure 2: Occupancy Rate by Grade Source: Colliers International Research HA VO Research Manager ha.vo@colliers.com Source: Colliers International Research Figure 3: Supply by Segment - 500 1,000 1,500 2,000 2,500 3,000 3,500 2000 2005 2010 2011 2012 2013 2014 Q4 2015 Q1 2016 Grade A Grade B units 60% 70% 80% 90% 100% Q1 Q2 Q3 Q4 Q1 Q2 Q3 Q4 Q1 Q2 Q3 Q4 Q1 Q2 Q3 Q4 Q1 2012 2013 2014 2015 2016 Grade A Grade B 0 5 10 15 20 25 30 35 40 Q1 Q2 Q3 Q4 Q1 Q2 Q3 Q4 Q1 Q2 Q3 Q4 Q1 Q2 Q3 Q4 Q1 2012 2013 2014 2015 2016 USD/sqm/month Grade A Grade B
  • 6. PERFORMANCE Average gross asking rent in Hanoi’s IPs reached USD83/sqm/term and the remaining Land Use Right was 34.8 years. IPs in Hanoi had the average occupancy rate of 61.6%. Hoa Lac High- tech park has the lowest occupancy rate of 18%-22%. If the 1,586ha high tech park is being excluded from the calculation, the average occupancy rate would be 91% while the average rent would be increased to USD103.5/ sqm/term. Rent of ready-built factory in Hanoi range from USD1.5 – USD2.5/sqm/month. SUPPLY Hanoi has 11 IPs and more than 3,800ha of industrial area. Under the socioeconomic development plan by 2020 with visions until 2030, Hanoi will be home of 33 industrial and hi tech parks. DEMAND According to the Ministry of Planning and Investment, the city attracted USD303 million of new and supplementary FDI capital in the first quarter of 2016. The majority of investments are flown into industries such as intermediate goods, machinery, spare parts and accessories, electronics. Infrastructures are being developed to connect Northern provinces with Hanoi which will significantly reduce time and costs of transportation and commercial traffic. These will positively contribute to improve the occupancy rate and asking rate of IPs. OUTLOOK Prices and occupancy rate are expected to increase steadily in the next coming quarters as the inflow of foreign investments is expected to continue. In the master plan for Hanoi, the capital city will have 24 industrial parks in 2020 and 33 industrial parks in 2030. The industrial area at that time will also be increased to 6,100ha and 8,000ha respectively. INDUSTRIAL SECTOR Q1 2016 | MARKET INSIGHTS ECONOMY OVERVIEW The combination of slowdown in manufacturing and decrease of profitability in agricultural sector in Q1-2016 due to weather difficulties may have caused a slow growth rate of GDP. Vietnam’s GDP grew 5.46% in Q1-2016, significantly lower than 6.12% in Q1-2015. The Consumer Price Index (CPI) increased to 0.57% m-o-m in March which resulted in a 1.25% increment in the first three months of the year. Export achieved USD37.9 billion, up 4.1% y-o-y while import values were USD37.1 billion, down 4.8% y-o-y. FDI of newly registered and supplementary capital was USD4.02 billion which was less than the amount of USD5.607 billion in Q4 2015 but rose 119% y-o-y. The disbursement value reached USD3.5 billion, a growth of 14.8% y-o-y. Credit growth achieved 1.54% which was higher than the growth rate of 1.25% same period last year. As manufacturing sector showed a slowdown, the increase in credit growth is contributed by real estate sector. If Vietnam aims to set the GDP growth target for this year to at least match the 2015 growth rate, the nation will have to make great efforts in the next coming quarters. DAVID JACKSON General Director david.jackson@colliers.com PLEASE CONTACT US FOR ANY INFORMATION www.colliers.com/vietnam Colliers International is a global leader in commercial real estate services, with over 16,300 professionals operating out of more than 502 offices in 67 countries. Colliers International delivers a full range of services to real estate users, owner and investors worldwide, including global corporate solutions, brokerage, property and asset, management, hotel investment sales and consulting, valuation, consulting and appraisal services, mortgage banking and insightful research. The latest annual survey by the Lipsey Company ranked Colliers International as the second- most recognized commercial real estate firm in the world. This document has been prepared by Colliers International for advertising and general information only. Colliers International makes no guarantees, representations or warranties of any kind, expressed or implied, regarding the information including, but not limited to, warranties of content, accuracy and reliability. Any interested party should undertake their own inquiries as to the accuracy of the information. Colliers International excludes unequivocally all inferred or implied terms, conditions and warranties arising out of this document and excludes all liability for loss and damages arising there from. This publication is the copyrighted property of Colliers International and/or its licensor(s). ©2016 Colliers International Research In general, infrastructure and associated services of Hanoi’s IPs are not as satisfactorily as those of HCMC’s IPs. Therefore, IPs’ developers should concentrate on building more associated infrastructures and utilities as banks, shopping malls, schools, hospitals, in order to improve the quality of life of IP’s employees. Figure 2: Supply by District Source: Colliers International Research Figure 1: Net Absorption Source: Colliers International Research HA VO Research Manager ha.vo@colliers.com Source: Colliers International Research Table 1: Future Supply HANOI -15 -10 -5 0 5 10 15 20 25 30 35 Q1 Q2 Q3 Q4 Q1 Q2 Q3 Q4 Q1 Q2 Q3 Q4 Q1 Q2 Q3 Q4 Q1 2012 2013 2014 2015 2016 ha Industrial Park Name District GFA (ha) Quang Minh II Industrial park Me Linh 266 Phuc Tho Industrial park Phuc Tho 74 Phu Xuyen Industrial park Phu Xuyen 488 Thanh My - Xuan Son Industrial park Son Tay 108 Soc Son Industrial park Soc Son 340 Soc Son II Industrial park Soc Son 204 Soc Son III Industrial park Soc Son 180 Soc Son IV Industrial park Soc Son 216 Thanh Oai II Industrial park Thanh Oai 480 Habeco Industrial park Thuong Tin 300 Dong Anh 35% Thanh That 23% Chuong My 12% Me Linh 12% Tu Liem 9% Others 9%