Downloaded 18 times


![145
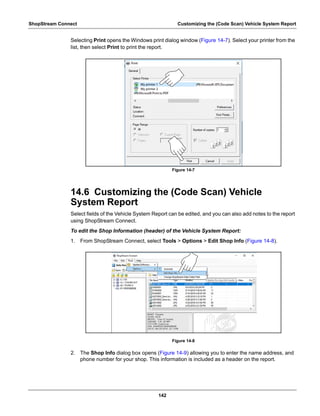
ShopStream Connect Software Upgrades and Updates
14.7 Software Upgrades and Updates
Upgrade/Update Descriptions:
• Software Upgrade - a software upgrade is a new software version (contact your sales
representative for purchase information).
• Software Update - a software update is a service release for installed software. These are
available free of charge, and are provided as necessary to update installed software. When
your diagnostic tool is connected to a PC using SSC, the SSC software will automatically
check for updates, and if an update is available, it will provide installation instructions. Follow
the screen prompts to accept, download and install the software.
NOTE:
i To receive updates or upgrades, SSC software must be installed on your PC and have connection
to the Internet.
z Example - Updating diagnostic tool software:
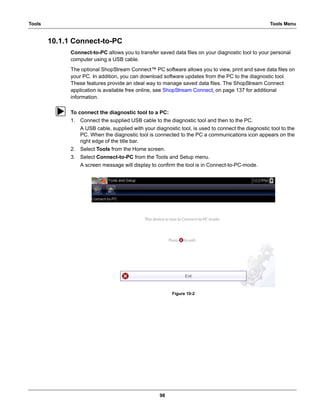
1. Select Tools > Update Software > (diagnostic tool type - e.g. ETHOS Edge, MODIS Edge,
SOLUS Edge, etc.) from the Menu bar (Figure 14-11).
The software checks the Snap-on web server for available updates.
Figure 14-11
2. If service release updates are available, select Next to continue, then select Download and
follow the on-screen instructions to complete the installation (Figure 14-12).
Figure 14-12
NOTE:
i For additional information on ShopStream Connect software updates and upgrades, download the
ShopStream Connect User Manual from our website: http://diagnostics.snapon.com/usermanuals
My Diagnostic Tool
ShopStream Connect will now check for updates for the following:
Do you wish to continue?
SOLUSULTRA
The following update is available for SOLUSULTRA
Version: 3.3.1.11769 [US] Size 38.96 MB
SOLUSULTRA 13.4.1. After update us complete: if direct connected, unplug USB cable - if using Compact Flash(CF)
insert CF and power up the handheld.
To download this update click ‘Download’
(“My Diagnostic Tool”)
(“My Diagnostic Tool”)
(e.g.“My Diagnostic Tool”)](https://image.slidesharecdn.com/snap-onsolusedge-190121035818/85/Snap-on-Solus-Edge-User-s-Manual-153-320.jpg)


This user manual provides essential information for operating Snap-on's OBD-II/EOBD diagnostic tools, including safety instructions, compliance statements, and support resources. It highlights the importance of reading the manual before use and includes details on software licensing, safety protocols, and environmental conditions for operation. Additionally, training resources and troubleshooting steps are available online to assist users in effectively utilizing the diagnostic tools.


![Mazda Dashboard Warning Lights: Symbols and Meanings [FULL LIST]](https://cdn.slidesharecdn.com/ss_thumbnails/mazda-warning-lights-221021085358-dcf733ba-thumbnail.jpg?width=640&height=640&fit=bounds)
![Mini Cooper Dashboard Warning Lights: Symbols and Meanings [FULL LIST]](https://cdn.slidesharecdn.com/ss_thumbnails/mini-cooper-warning-lights-221021084944-27b65ebd-thumbnail.jpg?width=640&height=640&fit=bounds)


![Toyota Dashboard Warning Lights [FULL]](https://cdn.slidesharecdn.com/ss_thumbnails/toyota-warning-lights-211126044903-thumbnail.jpg?width=640&height=640&fit=bounds)


