Recommended

Recommended
More Related Content
Similar to Coincidence analysis of the effect of cochlear disparities on temporal responses to pure tones
Similar to Coincidence analysis of the effect of cochlear disparities on temporal responses to pure tones (20)
More from TeruKamogashira
More from TeruKamogashira (20)
Recently uploaded
Recently uploaded (20)
Coincidence analysis of the effect of cochlear disparities on temporal responses to pure tones
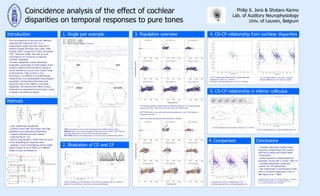
- 1. Coincidence analysis of the effect of cochlear disparities on temporal responses to pure tones Philip X. Joris & Shotaro Karino Lab. of Auditory Neurophysiology Univ. of Leuven, Belgium 1. Single pair example 3. Population overview Methods Introduction The convergence of neurons with different characteristic frequency (CF) on a postsynaptic target has been explored in several models (Bonham and Lewis 1999; Carney 1990; Carney et al. 2002; Schroeder 1977; Shamma 1989). We refer to such convergence as monaural or binaural cochlear disparities. Cochlear disparities create interesting properties, particularly at initial stages of the auditory system where temporal coding of sound waveforms occurs over a wide range of frequencies. With current in vivo techniques, it is difficult to simultaneously measure pre- and postsynaptic physiological properties, so that there have been few empirical tests of the effects of cochlear disparities. We examine the effect of such disparities on responses to pure tones, using a simple coincidence analysis. • cats, barbiturate anesthesia • auditory nerve fiber recordings with high impedance micropipettes (sequential) • closed, calibrated acoustic system • spike timing at 1 μs • stimuli: long duration (1000/1500 ms) pure tones straddling the response area • analysis: count coincidences across spike trains of pairs of nerve fibers, for different delays (cross correlograms) TOP Coincidence counts (cross-correlograms) at different frequencies MIDDLE Rate, Sync (vector strength), their product (SyncRate), and Phase for individual fibers (blue) and for their coincidences (green) BOTTOM Addition and superposition of coincidences at different frequencies Effect of adding a pure time delay (1ms) and pure phase delay (0.2 cycle) on pattern of coincidences. One fiber is compared with itself. 4. CD-CP relationship from cochlear disparities 2. Illustration of CD and CP TOP Phase-frequency relationships for different ranges of CFs, pooled across animals and SPLs. Red and green dots show CFs of each pair. BOTTOM Same curves, with syncrate superimposed in color. Normalized to maximum syncrate. Scale of ordinate and abscissa is identical for all plots. rate sync phase syncrate CF1 = 1207 Hz, SR = 1 spks/s CF2 = 1466 Hz, SR = 2 spks/s DCF = 0.28 oct, Cochlear distance = 0.79 mm Conclusions 5. CD-CP relationship in inferior colliculus 4. Comparison CD-CP relationship measured with linear regression (weighted for rate), for 1 animal. Pairs with maximal difference in CF of 0.1 octave. CD-CP relationship in 4 animals, unsigned. Maximal difference in CF was 0.3 octave. CD-CP analysis for a binaural IC neuron (CF 1.9 kHz). CD-CP relationship in IC. Color indicates best ITD. Comparison of CD-CP relationship in IC (+) with that expected from cochlear disparities (o). • cochlear disparities create phase- frequency relationships that contain both group-delay and phase-delay components • phase-frequency relationships are generally curved with a “bump” near CF • cochlear disparities create and inverse CD-CP relationship • this relationship is reminiscent of that seen in binaural responses in the IC (Mc Alpine et al., 1996) Supported by the Fund for Scientific Research – Flanders (G.0714.09 and G.0961.11), and Research Fund K.U.Leuven (OT/05/57 and OT/09/50).