
Recommended
Recommended
More Related Content
Similar to Performance Management Tools and Techniques
Similar to Performance Management Tools and Techniques (20)
More from TanaMaeskm
More from TanaMaeskm (20)
Recently uploaded
Recently uploaded (20)
Performance Management Tools and Techniques
- 1. enu-fmd-bk-en-GB January 6, 2015 - 15:22 141 Chapter 10 © 2011 Edinburgh Napier University. 137 Chapter 10 Performance Management 10.1 Introduction: The Crisis in Management Accounting 137 10.2 The Development of Strategic Management Systems 138 10.3 The Balanced Scorecard 138 10.4 Stern Stewart’s Economic Value Added (EVA)TM 142 10.5 Summary 147 You will notice that we refer to much literature in this unit and it is to be hoped that you will read up on some of the sources that have been cited. It is not expected that you will read all of these sources − that would be asking a bit too much. More important to your success in this unit, however, is that you try to find independent sources for yourself. You need to be able to offer your own evaluation of the literature after all and seeking out your own sources is a significant part of developing that skill. There is a list of the sources referred to in the reference section at the back of this unit but bear in mind that it
- 2. is not exhaustive. It will help you initially, however, if you have an interest in a particular area. Learning Objectives After completing the study of this unit you should be able to: • broadly provide analysis of the environment, in a management accounting and control sense, which gave rise to developments such as economic value added (EVA) and the Balanced Scorecard (BSC) • appraise the contribution of the BSC to the area of performance management • appraise the contribution of EVA to the area of performance measurement • provide critical analysis of both these techniques, based on academic reading • analyse the feasibility of the BSC and EVA being used together. 10.1 Introduction: The Crisis in Management Accounting In the early 1980s, US and UK companies began to lose contracts to Japanese organisations which, previously, they would have succeeded in attaining. There appear to have been two main reasons for this: the Total Quality Management revolution had benefited Japanese entities to the extent that they could simultaneously decrease cost and increase quality but, additionally,
- 3. Western companies came to the conclusion that they were not measuring and managing the correct metrics in their companies. For example, management accounting had always been (and remains today) very effective at splitting costs into their fixed and variable elements and ensuring that costs are accurately allocated to product to enable stock to be valued in line with the existing accounting regulations (International Accounting Standard 2 and 11). This meant that a great deal of attention was paid to determining which costs were direct and which were indirect. However, the nature of the composition of costs had changed and companies were increasingly finding that the majority of their costs were indirect whilst their measurement and management systems were constructed to analyse, in detail, the costs which were direct in nature. This meant that there was a fundamental and potentially dangerous mismatch between cost behaviour and cost analysis. In practice, management accounting was measuring and managing aspects of the business which suited the purposes of financial reporting (e.g. valuation of stock) but which did not help the business to plan, control or make decisions for the future. enu-fmd-bk-en-GB January 6, 2015 - 15:22 142 Chapter 10
- 4. Finance for Management Decision-Making 138 © 2011 Edinburgh Napier University. Resultantly, management accounting was seen as being in crisis and the publication of a book called Relevance Lost: The Rise and Fall of Management Accounting in 1987 by Johnson and Kaplan made public what many companies believed, privately, to be the case. Indeed, one sentence in that book was seen as providing the rationale for much of the research in this area for the next 20 years: ‘management accounting information is too late, too aggregated and too distorted to be relevant for managers’ planning and control decisions’ (p1). It is really the task of each individual observer to assess whether relevance has been regained or not. Certainly, there have been many developments in the field of management accounting since then, most of which we do not have time to focus on in this unit. If you are interested, however, you might consult any management accounting textbook to find out about things such as activity based costing, activity based management, target costing, customer profitability analysis, value chain costing, benchmarking and strategic management accounting. In this unit, we will focus on two particular developments − the Balanced Scorecard (BSC) and economic value added (EVA) − as strategic management and measurement tools. Firstly, we need to explain what we mean by a strategic management system and to
- 5. trace its development. 10.2 The Development of Strategic Management Systems When we talk of a strategic management system we mean one which, even if only in broad terms, considers the external environment within which the entity operates. From this, the entity decides upon its strategy and from this comes the annual/six-monthly/monthly budget. If the system is truly interactive, it will assess the continued viability of the entity’s strategy and make adjustments to the internal measurement and management system accordingly. Anthony (1965) is generally credited as being the first commentator to consider that meas- urement and management should, perhaps, have a strategic perspective when he points out that the aspects of control and planning should be treated as two distinct functions of manage- ment. This conclusion had been given supporting evidence by previous commentators such as Chandler (1962), who highlighted that expanding industries were creating problems in terms of control for traditionally run family entities. It had become almost impossible to find one person to control the vast number of developing divisions, emphasising how the function of control was inadequately developed to deal with the changing environment. Anthony (1965), therefore, with some justification, introduced his book by saying ‘the area in which we are interested, planning and control systems, is so new as an organised field of study that textbooks providing a framework have not yet been written’
- 6. (p.4). His main contribution to the development of strategic management systems is, therefore, to attempt to provide one, which he does by initially stating that he views planning and control to be indistinguishable. He further develops his argument by drawing a distinction between strategic planning (deciding upon objectives and upon how to obtain the resources for those objectives), management control (how managers ensure that resources are obtained and used effectively to achieve the objectives) and operational control (the process of ensuring that specific takes are carried out effectively and efficiently). Otley (1999) highlights how the literature in this area has subsequently developed, which he summarises as going ‘beyond measurement of performance to management of performance’ (p.363) and therefore from beyond planning to managing. He highlights, as many other com- mentators also do (Simons, 1995; Drury, 2008 for example) that the BSC is one of the most significant developments in terms of strategic management and one which is increasingly being adopted by companies in both the private and public sectors. 10.3 The Balanced Scorecard The BSC is the invention of Robert Kaplan, a Harvard Business School professor, and David Norton, a management consultant. They had undertaken some research work with major blue enu-fmd-bk-en-GB January 6, 2015 - 15:22 143
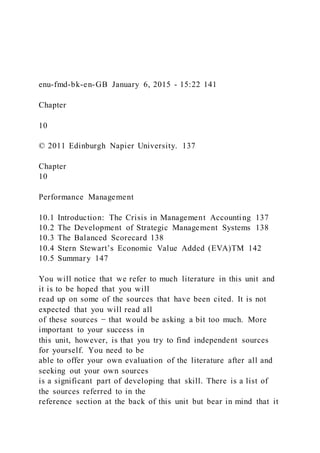
- 7. Chapter 10 Performance Management © 2011 Edinburgh Napier University. 139 chip American companies towards the end of the 1980s/beginning of the 1990s and, using a research approach called grounded theory (Glaser and Strauss, 1967) to analyse their work, they developed the BSC. It is interesting to note, initially, that their model of the BSC was built from practice, not from a theoretical construct about what should be happening. As can be seen from Figure 10.1, the BSC is composed of four component parts: Figure 10.1 The balanced scorecard The double-headed arrows which join the aspects together are the key to the success of the BSC: if the customer component is not achieved, then the financial target will not be achieved. If the financial targets are not achieved, the internal business process targets will not be achieved, neither will those in learning and growth, nor those in customer. The essence is therefore one of cause and- effect in that something is achieved (or not) as a result of performance which then enables (or not) something else to be achieved. The other principle idea within the BSC is that it is derived from the organisation’s vision and strategy and that it
- 8. becomes, in essence, a strategic implementation tool. 10.3.1 How Might It Look in Practice? The idea behind the BSC is that corporate goals should be devolved throughout the organ- isation by means of each department/unit having their own BSC. The first thing that must be decided upon, therefore, is the company’s strategy. As Kaplan and Norton (1996) make clear in their book, it is counter-productive for any company to try and ‘borrow’ a BSC from any other company as they operate in different environments, have different strategies and will, therefore, want to measure different things. The strategy having been established, the company can then decide upon the aspects that they feel it necessary to measure to ensure strategic goals are achieved. In a company such as amazon.com, the BSC may look something like this. Financial perspective Objective: Profitability Measures: Average gross margin per sale/per customer, average customer acquisition cost enu-fmd-bk-en-GB January 6, 2015 - 15:22 144 Chapter
- 9. 10 Finance for Management Decision-Making 140 © 2011 Edinburgh Napier University. Objective: Growth Measure: Quarterly revenue Objective: Survival Measure: Cash flow Customer perspective Objective: Brand strength Measures: Brand awareness, brand meaning, customer life cycle Objective: Customer satisfaction Measures: Customer satisfaction index, ‘traffic’ conversion rate, knowledge-base, cus- tomer share, defection rate Objective: Market share growth Measure: Market share Internal business process perspective Objective: Quality and reliability Measures: On-time delivery, service error rate
- 10. Objective: Efficiency Measures: Level of disintermediation, revenue per dollar of web development Innovation and learning perspective Objective: Innovation Measures: Distribution of management attention in meetings between time spent dis- cussing past, present, future issues Objective: Resources maximisation Measures: Employee retention, revenue per employee, staff attitude survey Objective: Diversification Measures: Pareto analysis, % sales from proprietary products , % of quarterly sales from new segments If we assume that amazon.com’s strategy is to develop themselves as a ‘branded’ low cost producer, these measures would, hypothetically, appear to be an appropriate balance between enu-fmd-bk-en-GB January 6, 2015 - 15:22 145 Chapter 10
- 11. Performance Management © 2011 Edinburgh Napier University. 141 financial and non-financial. I would stress these measures are hypothetical but also that they probably provide a realistic indication of the kind of things that the company might view as critical success factors at a corporate level. Kaplan and Norton have written a further two books following their original one in 1996. In 2001, they highlighted the BSC’s essence as an overall strategic management system in The Strategy Focused Organisation and in 2004, they provided further detail and analysis on how to map strategic direction into specific measures in Strategy Maps. To be knowledgeable about what is happening in terms of the development of the BSC from the point of view of those who initiated it, you should be aware of developments in each of their three books. If you find them to be of great interest, then of course you should read them cover to cover. However, to gain an overall feeling about what’s said, it’s necessary to read the introductory chapters of each and then to dip in to whichever chapters you feel to be appropriate. 10.3.2 What Does the Research Say? Much research has been carried out into the BSC and probably the main reason for this is that many companies are using it. Unlike other theoretical developments in management
- 12. accounting (e.g. backflush accounting, modified internal rate of return), the BSC was derived from practice which makes it clear that it is at core a practical, rather than a theoretical, development. That is not to say there is no theory underlying its usefulness, as clearly its main purpose is to help companies organise themselves in such a way that they can maximise their financial return. In that sense, it is a shareholder val ue model. Given its wide usage, we have a reasonably extensive variety of case study research on the development of knowledge of the BSC in practice. The research that is cited here, and that which refers to EVA also, is quite selective and is in no way meant to be extensive but instead to encourage you to seek out these and other sources and to undertake your own investigations into the area of the BSC. Firstly, we have the work which has been undertaken by Kaplan and Norton − 1992, 1996a, 1996b, 1998, 2001, 2004. However, it would be fair to say that this work might not represent the most balanced view as Kaplan and Norton have their own management consulting organ- isation which specialises in BSC implementation and it is unlikely that their own publications will offer anything in the way of critical or derogatory commentary on it. The area of implementation is one that a few commentators have chosen to focus their research upon. McCunn (1998) suggests that companies should implement a pilot project before proper implementation, as the BSC involves a cultural
- 13. change that staff need to take time to adjust to. This is something which Ahn (2001) implicitly agrees with, as he highlights that the implementation of the BSC into one business unit took four months. He indicated that the planning and initial conception of how implementation would be undertaken should have been better conceived. McAdam and Walker (2003) also provide evidence that failure to implement a pilot project can have catastrophic consequences as their research details the five-year journey to implementation of the BSC in a UK local council. Above all, McAdam and Walker believe their study highlights the importance of having a ‘champion’ of the BSC within the company − that is, someone in he company who is enthusiastic about the advantages the BSc can bring to the company and who will resultantly ‘sell’ it to their colleagues. They argue that this is a necessity, as most implementation is originally undertaken by management consultants who must eventually rescind control to the company itself. Many commentators would come to the broad agreement that companies believe the BSC to be beneficial. Malmi (2001) reports that, of the 17 Finnish companies he studied, all of them were finding the BSC to be of great benefit as a strategic implementation system. Jazayeri and Scapens (2001) report the same in their one company case study and Campbell et al. (2002) report on the benefits the company achieved to their measurement and management systems as a result of adopting the BSC. Unfortunately, there are not, as yet, any studies that link
- 14. enu-fmd-bk-en-GB January 6, 2015 - 15:22 146 Chapter 10 Finance for Management Decision-Making 142 © 2011 Edinburgh Napier University. adoption and development of the BSC to increased profitability. This is not too surprising, as such things are difficult to show (we cannot know how the company would have performed had it not adopted the BSC, for example), and also present a problem with regard to when we measure success/failure. Should we, for example, wait until the company has adopted the BSC for two years/three years/ten years? Therefore, the lack of published study in this area does not mean that the BSC is unsuccessful; indeed, as previously indicated, research appears to be telling us that companies are using it increasingly as a performance management system. 10.3.3 Criticisms of the BSC Several commentators have been critical of the BSC, both in its theoretical and practical application. Olson and Slater (2002) for example, indicate that the four component parts of the BSC cannot work for all companies as companies differ in strategy, environment, size,
- 15. degree of technology, etc. In so doing, they are highlighting that contingency theory holds to be true. Contingency theory is one of the main theories that permeates management accounting research and its basic premise is that an entity’s management accounting and control system will be determined by a number of variables (those mentioned above and others). If you want to read further on this, have a look at Chenhall’s 2003 paper, which gives a concise review of the literature in the area of contingency theory. Olson and Slater’s point is that, given the existence of contingency theory, we would not expect every company to have these four component parts weighted to the same extent. It is illogical to conceive that this would be the case. Another major critic of the BSC has been Hanne Norreklit. She has published two papers in this area in 2001 and 2003. Whereas the 2003 paper is very interesting, the 2001 paper is essential reading. In this paper she highlights the problems with the assumptions underlying the supposed success of the BSC and illustrates this point with the example of whether we can assume that loyal customers (and increased loyalty of customers) equates to increased profits. This is the kind of ‘cause-and-effect’ relationship which is crucial to the success of the BSC. Norreklit argues that we cannot assume this to be the case, as we are making the assumption that the customers themselves are profitable. Likewise, we cannot assume that
- 16. increased efficiency will naturally equate to increased financial performance as our efficiency levels may not be near those that the market requires. She attacks the very basis of the BSC’s assumptions by arguing that Kaplan and Norton use arguments based on causality when they should be using arguments based on verifiable logic. As an example, she argues that claims such as ‘loyal customers = increased profits’ must be shown by logical deduction to be the case. They are not, and Norreklit concludes that all we can really say in this area is that disloyal customers are unlikely to lead to increased profits. Others have been critical of the BSC on the basis of its practical application. Malina and Selto (2001) highlight how it leads to entities having too many things to measure and losing focus about the important metrics in the company. Van Veen-Dirks and Wijn (2002) highlight how the BSC does not explicitly track changes in the external environment and indicate that, by the time the company has implemented the BSC, they are probably measuring and managing the wrong things as they will have lost focus on the overall strategic environment. 10.4 Stern Stewart’s Economic Value Added (EVA)TM The area of shareholder value has been an increasingly written- about, talked-about and researched area over the last decade or so. At core, this idea (some might say philosophy) involves measuring a company’s profitability based on economic profit rather than account- ing profit. Several different management consulting companies
- 17. offer their own variations on the basic economic profit measurement (e.g. Boston Consulting Group’s Cash Value Added, Marakon’s Equity Spread, Holt Value’s Cash Flow Return on Investment) but the most widely enu-fmd-bk-en-GB January 6, 2015 - 15:22 147 Chapter 10 Performance Management © 2011 Edinburgh Napier University. 143 discussed is probably Stern Stewart’s Economic Value Added (EVA)TM, a performance man- agement philosophy that the New York consulting agency has trademarked. Their client list is distinguished and is headed by many blue chip companies and several global leaders in their field, including Coca-Cola, CSFB, Morgan Stanley, Diageo, US Postal Service, Equifax, JC Penney and Quaker Oats. Their calculation of EVA is straightforward (Stewart, 1999): EVA = Net Operating Profit After Tax (NOPAT) − Weighted Average Cost of Capital [WACC] × ({adjusted}capital base) Stewart (1999) believes that the calculation of EVA puts the idea of NPV at the forefront of a company’s financial management system. The principal
- 18. benefit of this is that the company’s performance is judged against whether it returns in excess of its cost of capital. It is easy to see how this might work on a calculation basis though less straightforward to imagine this as an overall guiding company philosophy. However, Stewart offers some practical examples about successful EVA practices within companies, including charging the cost of capital against every sale that the company makes, charging the cost of capital to excess stock (which may have been bought on a false economy bulk- purchase, reduced price) and ensuring that managers realise that the purchase of things such as new delivery vehicles must make a positive economic return against the amount they add to the balance sheet. 10.4.1 Adjustments Significantly, Stewart suggests that changes should be made to the way the income statement and balance sheet are constructed. Ehrbar (1998) indicates that over 160 potential adjustments could be made to US Generally Accepted Accounting Principles (GAAP) to produce accounts that give a more accurate reflection of the capital used by the entity. Stewart (1999) recom- mends, for example, that all research and development be capitalised rather than expensed since it is to be expected by the shareholder that the company earn a return on it. He also suggests that all goodwill be capitalised. Ehrbar develops this further in that he suggests that aspects such as reorganisation costs be capitalised, asking what
- 19. the point of reorganisation is if not to increase shareholder value. Clearly, the capital used in the company would be considerably higher after Stern Stewart’s adjustments than it was beforehand. This ensures that the EVA figure is achieved against a higher hurdle that would otherwise be the case. Stern Stewart believe this to be one of the strengths of EVA as it starts to address the accounting conservatism at the basis of GAAP which they believe to be ‘particularly ill-suited to the business environment that is likely to prevail in the coming decades’ (Ehrbar, 1998, p.163). Most companies require no more than 15 adjustments in practice, according to Ehrbar (1998), which keeps the formula for calculation simple and once established it should be ‘virtually immutable, serving as a sort of constitutional definition of performance’ (p. 166). Other research, as we will discover later, indicates that many companies make no adjustments at all. 10.4.2 Bonus Bank One of the other main features of Stern Stewart’s system is their adherence to what they term ‘the bonus bank’. Ehrbar (1998, p.105) believes that it ‘solidly aligns management goals with the creation of shareholder wealth . . . the use of a bonus bank, with a proportion of exceptional bonuses held hostage and subject to loss if performance subsequently falls, causes managers to focus on projects that create enduring value’. Stewart (1999) also believes that the addition
- 20. of a bonus bank will ensure that managers and directors do not take decisions that reward single-period success but are detrimental to the long-term success of the company. He argues that it is relatively easy to improve single period performance at the expense of the longer term by not investing in new capital projects or cutting labour. It is, therefore, necessary for the owners of the firm to ensure that any success that is achieved is sustainable and Stewart’s enu-fmd-bk-en-GB January 6, 2015 - 15:22 148 Chapter 10 Finance for Management Decision-Making 144 © 2011 Edinburgh Napier University. proposal to prevent sub-optimal decisions is to pay out 50% of the bonus bank on a yearly basis. This is Stern Stewart’s attempt to solve what has been termed ‘the agency problem’ (Jensen and Meckling, 1976). The gist of this problem is how we can try to ensure that those who run and administer the business (the management) act in the best interests of the owners (the shareholders) and not in their own self-interest. Whether Stern Stewart begin to solve this through the introduction of the bonus bank is a matter for
- 21. personal conjecture. Most independent research highlights that companies do not often use this ‘bank’ system even though most are content to bonus their staff on the achievement (or otherwise) of an EVA figure. The system is something that sounds like an excellent theoretical development but which we would perhaps be less likely to embrace on a personal level − would you willingly accept that you were going to receive only 50% of the bonus you had worked for in a given period? 10.4.3 What Does the Research Say? EVA is beneficial There has been quite a bit of support for Stern Stewart’s views in basic texts, and such texts tend to make claims about the success of the movement which are, if not biased, certainly unsupported. Black et al. (1998), for example, explain that economists have discovered no relation, over time, between earnings and stock market performance. This claim is not supported by any citation, nor is supporting evidence supplied for a positive relationship between shareholder value metrics and stock market performance. Morin and Jarrell (2001) state that EVA companies consistently earn above average returns on the cost of capital. Somehow, EVA is the crucial factor here which can lift companies to such a level of achievement. Although this is never made explicit, the insinuation is clear − and much like Norreklit’s (2003) criticism of the BSC literature, the reader is left to make
- 22. connections that are causal, and require evidence, rather than logical. Black et al. (1998) also make the same unquestioning case for EVA as a panacea. They suggest that it is a philosophy which should permeate every level in the company and which will align strategies, policies, performance measures, rewards, organisational structure, processes and systems. Stern and Shiely (2001), a Stern Stewart publication, provide similar unsubstantiated claims for EVA being unquestionably the best management system available. However, perhaps in recognition of previous criticism, they recognise that EVA adoption in itself will not tell a company what its strategy should be and advise that it may be of more benefit to companies that have undergone a major crisis than to others. EVA as a management control system EVA is a relatively recent concept and it should be no surprise that literature on its use as a control system is limited. As with the BSC, there is a time consideration initially − how long does a researcher wait after the implementation of a control system before it can be investigated? Published studies thus far have tended to focus on either an analysis of the prescriptive parts of the EVA theory and consider them in the light of other theories, or on company case study analysis, which tends to give conflicting results. O’Hanlon and Peasnell (1998) are very much of the former
- 23. aspect and propose the view that EVA is a management accounting control system. They argue that the adjustments made to GAAP are on a company specific rather than on a specified- standard basis and are hence enterprise-contingent by design. This view is developed by placing the system which EVA, through its adjustments, becomes somewhere in the middle of cash accounting and economic value accounting. It is not the intention of Stern Stewart, they argue, to place their system within the framework of either of these extremes of theory and hence EVA permits the enu-fmd-bk-en-GB January 6, 2015 - 15:22 149 Chapter 10 Performance Management © 2011 Edinburgh Napier University. 145 company to make the decision that is most relevant to its needs. Their overall attitude to EVA is positive, and they believe that it ‘combines ideas from finance and accounting to provide a framework within which managers will run the business as though they owned it’ (p.441). Theoretically, it is an amalgam of ideas which, significantly, may aid businesses in solving the problems inherent within the agency relationship.
- 24. Adoption and Implementation Malmi and Ikaheimo (2003) consider the practical use of EVA to adopters, and focus on six Finnish companies in their study. Their results are inconclusive − indeed, the main conclusion is that ‘adoption of EVA does not seem to be manifested similarly in all organisations’ (p.248). Some companies that claimed to adopt EVA did not use it for target setting, some did; some used it as part of the bonus structure and some did not; some had integrated it fully within the company and some had not. This is consistent with other studies conducted on a case study basis. Brown et al. (2001) find that one company used the bonus bank as suggested by Stern Stewart, whereas another used EVA as a bonus measure for directors only and then as only one small component. The extent of integration within this study is similarly inconsistent. One company claimed that even the receptionist would understand what EVA was, whereas another introduced EVA as a measure at a regional level without telling managers what it was or how it was calculated. Nor do we find similar reasons for the adoption of EVA. Brown (2006) reports that adoption is due to external pressure from market analysts and a decision tends to be taken by the CEO alone. Claes (2000) reports that the three firms studied each had a different reason for adoption − one to orient itself more closely with an internal measure for share price, one to gain a better understanding of the true costs of the products they sold and one on the advice of
- 25. management consultants. McLaren (2000) reported that the main reason for implementation in New Zealand was down to the internally driven decision to align managerial and shareholder interests. The aspect of integration within the entity, and the extent of it, has been a consideration of most, if not all, the case study research. Brown et al. (2001), Brown (2006) and Malmi and Ikaheimo (2003) all find that levels of integration differ. Claes (2000) and McLaren (2000) find similar results in their studies. Of the three Dutch companies consulted, Claes finds different levels of integration of EVA in all three and McLaren reports on different levels of integration from New Zealand companies, based on responses from questionnaires. Brown et al. (2001) find that one company that dropped EVA did so because, in the opinion of one of the interviewees, it was not sufficiently integrated to allow employees to both understand and ‘buy-in’ to it. If there is one constant in the case study research, it emerges in the shape of the consideration given to the cost of capital. Brown et al. (2001) report on one company taking nine months and several board meetings to decide upon their exact cost of capital until the realisation dawned that it is the discipline of a cost of capital itself that is more important. Brown (2006) and McLaren (2000) report similar findings, in that the actual accuracy of the cost of capital is less significant than the new discipline in business practice that has been introduced through
- 26. its consideration. All commentators report that the focus within companies on determining their cost of capital has increased dramatically, as has the assigning of specific costs of capital to specific countries, business units and projects. Young and O’Byrne (2001) report a similar finding in their one company case study in that the cost of capital was at the core of everyday thinking for each business unit. Christensen et al. (2000) predicted that this should be the case − managers can diversify risk considerably in certain operations and to such an extent have control over their cost of capital. A business unit specific cost of capital is therefore an appropriate way to run a company that has adopted an EVA perspective as it is likely to help align managerial and shareholder interests by focusing upon earnings above the cost of capital at the lowest organisational level. enu-fmd-bk-en-GB January 6, 2015 - 15:22 150 Chapter 10 Finance for Management Decision-Making 146 © 2011 Edinburgh Napier University. Other Measures Remain The case study research in the area has also found that companies do not dispose of standard
- 27. accounting measures of performance on the adoption of EVA, as Stewart (1999) suggests. Brown et al. (2001) find evidence of one company which has adopted EVA as its principal measurement yet still retains the others it previously had. Other commentators (McLaren, 2000; Claes, 2000; Malmi and Ikaheimo, 2003; Brown, 2006) find that EVA is adopted but in addition to, and usually of less significance than, standard accounting measures such as profit and return on investment. Perhaps such conflicting results from field study research should come as no surprise. Firstly, the topic under discussion is new in its application and it is to be expected that pioneers find differing experiences. Perhaps more significantly, however, such divergence lends further credence to O’Hanlon and Peasnell’s (1998) view that the adoption and design of EVA is a contingent matter, based on company culture, structure, market position and strategic direction. Lovata and Costigan (2002) adopt a contingency approach to their study in that they are trying to ascertain which type of company is most likely to use EVA and they hypothesise that defenders (according to the Miles and Snow typology) are more likely to use EVA than prospectors, and that firms with higher agency problems are more likely to use EVA due to its ability to help with the agency theory issue. Their results reflect their expectations. However, their information was taken from publicly available sources (Lexis/Nexis) and they defined an
- 28. ‘EVA company’ as one which had the reward system detailed as being based on EVA, at least in part. It requires a leap of faith to make the assumption that EVA is, therefore, being used as part of, or as a complete, management control system. Another interesting point raised by Lovata and Costigan’s study is the contention of the prime advocates of EVA (Stewart, 1999; Morin and Jarrell, 2001; McTaggart et al., 1994; Copeland et al., 1994; Black et al., 1998) that the techniques can be implemented in any and every company. Morin and Jarrell even assert that there is a strong connection between innovative companies and the adoption of shareholder value techniques such as EVA, since such companies constantly require to discover new ways of earning above average returns. While Lovata and Costigan’s study (2002) may have significant flaws, it at least shows that there is very limited evidence of innovators adopting these measures. Malmi and Ikaheimo (2003) ask when researchers can be sure they are working with a company that is an EVA adopter, given that companies feel they can adopt certain aspects of it and leave others aside. Stewart (1999) would argue that EVA must be implemented fully and become the sole performance measure within the business entity. Yet no company studied in independent research (Malmi and Ikaheimo, 2003; Brown, 2006; Brown et al., 2001; McLaren, 1999; Claes, 2000) has undertaken this. EVA is seen as an additional technique, of varying significance. The implications of such findings cause Malmi and Ikaheimo to question the reliability of information
- 29. from studies which do not take the case study approach and are instead functionalist in nature, as the information used in these latter studies will come only from publicly available databases. The phrase ‘EVA-adopter’ may be the basis upon which research is then undertaken but it is misleading, as there is little shared understanding on what this means in practice. Martin and Petty (2000) had highlighted this previously, by referring to the contrasting exper- iences of Herman Miller and AT&T. The former company is cited by Stern Stewart in their relevant literature (Stewart, 1999; Stern and Shiely, 2001; Ehrbar, 1998) as being an example of the success EVA adoption can bring to a company, and Martin and Petty (2000) also offer evid- ence of increasing stock returns and exceptional employee bonuses. However, AT&T within Stern Stewart’s literature is conspicuous by its absence and Martin and Petty highlight AT&T’s botched implementation, poor development of EVA reward to managerial and directorial levels, lack of training for staff in the rudiments of the calculation and year-on-year increase in EVA with no resulting shareholder value increase as evidence that the way in which the enu-fmd-bk-en-GB January 6, 2015 - 15:22 151 Chapter 10
- 30. Performance Management © 2011 Edinburgh Napier University. 147 technique is adopted and developed within the company is crucial to the success or otherwise of the system. 10.4.4 Criticisms of EVA Otley (1999) considers the use of EVA as a management control system from a more theor- etical perspective, in that he commences his study with a framework to analyse the operation of management control systems around five main questions. These questions are those which he has specified, resulting from research of the relevant literature, as being prescriptive with regard to defining an effective management control system. He considers EVA in the light of these five issues and finds that it has an over-arching goal in its focus on economic return but that it is inconclusive and confusing in the area of calculation (p.373). He also concludes that EVA is deficient in that it makes no contribution to strategy development and calls for further research into the use of EVA, in practice, as a management control system. Mouritsen (1998) has a similar criticism, in that he argues that EVA is not a tool that will help an entity to devise strategy − it is a static tool which takes no account of uncertainty or environment. The process of intellectual capital, on the contrary, has a mindset of organisational learning from experience and continual adaptation to the
- 31. environment. Mouritsen draws the comparison of EVA representing financial capitalism and IC representing entrepreneurial capitalism. It is an argument of theories, and of the author’s belief that EVA does not represent the advance in strategic evaluation that Stern Stewart believes it does, nor is it a system which is capable of capturing the significance of crucial intangibles such as intellectual capital. Alvarez-Dardet et al. (2000) also consider the aspect of intellectual capital in their paper but find that, though there are many commentators on the subject, they cannot agree on a common framework within which to consider it as an asset. They do, however, agree with Mouritsen in that there is no attempt within the EVA system to harness the value-creating capacity that intellectual capital has, nor is there any attempt within it to consider the measurement of any intangibles. This is primarily due, according to the authors, to the financial and ‘measurable’ bias that exists within it and the other value-based performance measures. 10.5 Summary EVA and the BSC have been two of the main developments in performance management over the last decade of so. It is up to the individual observer to come to a conclusion on the similarities/differences between them, but it is clear that EVA is a purely financial measure whereas the BSC includes many non-financial elements and, indeed, seeks to develop non- financial measures. It is also worth asking whether the two methods can exist within the same
- 32. company. In theory, this would be impossible as EVA demands that one predominant measure is considered and that any other measures introduced should be a direct compliment to EVA. The BSC, on the other hand, demands a ‘flatter’ approach to performance management in that the four components should be stressed to an equal extent. Yet companies do use them together in practice which serves as a useful reminder to us that what is conceived in theory, and the practical application of it, rarely follow a consistent path. References © Ahn H. (2001) ‘Applying the Balanced Scorecard Concept: An Experience Report’, Long Range Planning, Vol 34, pp. 441−461. © Alvarez-Dardet C., Cuevas-Rodriguez G. and Valle-Cabrera R. (2000) ‘Value Based Management: Perform- ance Measurement Systems for Human Resources’, Journal of Human Resource Costing and Accounting, Vol 5, No 1, Spring, pp. 9−26. © Anthony R.N. (1965) Planning and Control Systems - A Framework for Analysis. (1st edn). Boston: Harvard University. enu-fmd-bk-en-GB January 6, 2015 - 15:22 152 Chapter 10
- 33. Finance for Management Decision-Making 148 © 2011 Edinburgh Napier University. © Brown J., MacAskill D., Owen H. (2001) Managing For Shareholder Value: A Comparative Study With Implications for the Management Accountant. Paper presented at BAA Conference, Nottingham, April. © Brown J. (2006) ‘What’s Significant in Value Based Management: An Internal Perspective’, International Journal of Accounting, Auditing and Performance Evaluation, Vol 3, No 3, pp. 320−340. © Campbell C., Datar S., Cohen Kulp S. and Narayanan V.G. (2002) ‘Using the Balanced Scorecard as a Control System for Monitoring and Revising Corporate Strategy’, accessed through www.ssrn.comon 21/1/03. © Chandler A.D. (1962) Strategy and Structure: Chapters in the History of the American Industrial Enterprise. (1st edn), (14th reprint, 1986). Massachusetts: MIT Press. © Chenhall R.H. (2003) ‘Management Control Systems Design Within Its Organisational Context: Findings From Contingency-Based Research and Directions for the Future’, Accounting, Organisations and Society, Vol 28, Nos 2/3, pp. 127−168. © Claes P.C.M. (2000) Value Based Management in Dutch Companies. Paper presented at EAA Meeting Munich, March. © Copeland T., Koller T. and Murrin J. (1994) Valuation - Measuring and Managing the Value of Companies. (1st
- 34. edn.). New York: Wiley. © Drury C. (2008) Management & Cost Accounting. (6th edn.). London: Thomson International Press. © Ehrbar A. (1998) EVA - The Real Key to Creating Wealth. (1st edn.). New York: Wiley. © Glaser G. and Strauss A. (1967) The Discovery of Grounded Theory: Strategies for Qualitative Research. (1st edn). New York. © Johnson H.T. and Kaplan R.S. (1987) Relevance Lost - The Rise and Fall of Management Accounting. (2nd edn.). Boston: Harvard Business School Press. © Jazayeri M. and Scapens R.W. (2003) Balanced Scorecards Within BAE Systems, A UK Aerospace Company. Paper presented at British Accounting Association Conference, April, Manchester. © Jensen M.C. and Meckling W.H. (1976) ‘Theory of the Firm: Managerial Behaviour, Agency Costs and Ownership Structure’, Journal of Financial Economics, October, pp. 305−360. © Kaplan R.S. and Norton D.P. (1992) ‘The Balanced Scorecard - Measures That Drive Performance’, Harvard Business Review, Jan−Feb., pp. 71−79. © Kaplan R.S. and Norton D.P. (1996a) The Balanced Scorecard: Translating Strategy into Action. (1st edn.). Boston: Harvard Business School Press. © Kaplan R.S. and Norton D.P. (1996b) ‘Using the Balanced Scorecard as a Strategic Management System’, Harvard Business Review, Jan−Feb., pp. 71−79.
- 35. © Kaplan R.S. and Norton D.P. (2001) The Strategy Focused Organisation. (st edn.). Boston: Harvard Business School Press. © Kaplan R.S. and Norton D.P. (2004) ‘Having Trouble With Your Strategy - Then Map It’, Harvard Business Review, Sep−Oct, pp. 167−176. © McAdam R. and Walker T. (2003) ‘An Inquiry into Balanced Scorecards Within Best Value Implementation in UK Local Government’, Public Administration, Vol 81, No 4, pp. 873−892. © McCunn P. (1998) ‘The Balanced Scorecard’, Management Accounting UK, December, pp. 34−36. © McLaren J. (1999) ‘A Strategic Perspective on Economic Value Added’, Management Accounting UK, April. © McLaren J. (2000) EVA for Planning and Control: Some Preliminary Evidence from New Zealand. Paper presented at BAA Meeting Exeter, April. © McTaggart J.M., Kontes P.W. and Mankins M.C. (1994) The Value Imperative. (1st edn.). New York: Free Press. © Madden B.J. (2000) Cash Flow Return on Investment - CFROI Valuation A Total System Approach to Valuing the Firm. (2nd edn.). Oxford: Butterworth-Heinemann. © Malina M.A. and Selto F.H. (2001) ‘Communicating and Controlling Strategy: An Empirical Study of the Effectiveness of the Balanced Scorecard’, accessed through www.ssrn.comon 20/1/03 © Malmi T. (2001) ‘Balanced Scorecards in Finnish Companies: A Research Note’, Management Accounting Research, Vol 12, pp. 207−220.
- 36. © Malmi T. and Ikaheimo S. (2003) The Uses and Benefits of Value Based Management: Some Case Study Evidence. Paper presented at EAA Meeting Munich, March. © Morin R.A. and Jarrell S.A. (2001) Driving Shareholder Value−Value Building Techniques For Creating Shareholder Value. (1st edn.). New York: McGraw Hill. © Mouritsen J. (1998) ‘Driving Growth: Economic Value Added Versus Intellectual Capital’, Management Accounting Research, Vol 9, pp. 461−482. © Norreklit H. (2001) ‘The Balance on the Balanced Scorecard - A Critical Analysis of Some of its Assumptions’, Management Accounting Research, Vol. 11, pp. 65−88. http://www.ssrn.com http://www.ssrn.com enu-fmd-bk-en-GB January 6, 2015 - 15:22 153 Chapter 10 Performance Management © 2011 Edinburgh Napier University. 149 © Norreklit H. (2003) ‘The Balanced Scorecard: What Is the Score? A Rhetorical Analysis of the Balanced Scorecard’, Accounting Organisations and Society, Vol 28, pp. 591−619.
- 37. © O’Hanlon J. (1996) ‘The Time Series Properties of the Components of Clean Surplus Earnings: UK Evidence’, Journal of Business Finance Accounting, Vol 23, No 2, pp. 159−189. © O’Hanlon J. and Peasnell K. (1998) ‘Wall Street’s Contribution to Management Accounting: the Stern Stewart EVA Financial Management System’, Management Accounting Research, Vol 9, pp. 421−444. © Olson E.M. and Slater S.F. (2002) ‘The Balanced Scorecard, Competitive Strategy, and Performance’, Business Horizons, May−June, pp. 11−16. © Otley D.T. (1999) ‘Performance Management: A Framework For Management Control Systems Research’, Management Accounting Research, Vol 10, pp. 363−382. © Otley D.T. (2001) ‘Extending the Boundaries of Management Accounting Research: Developing Systems for Performance Management’, British Accounting Review, Vol 33, pp. 243−261. © Simons R. (1995) Levers of Control: How Managers Use Innovative Control Systems to Drive Strategic Renewal. Boston: Harvard Business School Press. © Simons R. (2000) Performance Measurement and Control Systems for Implementing Strategy. (1st edn.). New Jersey: Prentice-Hall. © Stern J.M. and Shiely J.S. (2001) The EVA Challenge − Implementing Value-Added Change in an Organisation. New York : J. Wiley & Sons. © Stewart G.B. (1999) The Quest For Value. (2nd edn.). U.S.A:
- 38. HarperBusiness. © Van Veen-Dirks P. and Wijn M. (2002) ‘Strategic Control: Meshing Critical Success Factors with the Balanced Scorecard’, Long Range Planning, Vol 35, pp. 407−427. © Young S.D. and O’Byrne S.F. (2001) EVA and Value-Based Management. (1st edn.). New York: McGraw Hill. Tesco PLC A nnual Report and Financial Statem ents 2018 Annual Report and Financial Statements 2018 Serving shoppers a little better every day. Welcome to our Annual Report. The screen icon indicates where further information is available online. We have also produced a number of short videos, available at www.tescoplc.com/ar2018.
- 39. Contents Strategic report: Tesco at a glance 1 Introduction 2 Chairman’s statement 3 Group Chief Executive’s statement 4 The six strategic drivers 8 Our business model and Big 6 KPIs 10 Financial review 12 Little Helps Plan 16 Principal risks and uncertainties 22 Corporate governance: Corporate governance report 26 – Chairman’s introduction 26 – Board of Directors 28 - Executive Committee 30 - Governance framework 32 - Nominations and Governance Committee 38 - Corporate Responsibility Committee 39 - Audit Committee 40 Directors’ remuneration report 45 Directors’ report 65 Statement of Directors’ responsibilities 67 Financial statements: Independent auditor’s report to the members of Tesco PLC 68 Group income statement 74 Group statement of comprehensive income/(loss) 75 Group balance sheet 76 Group statement of changes in equity 77 Group cash flow statement 78 Notes to the Group financial statements 79 Tesco PLC – Parent Company balance sheet 132 Tesco PLC – Parent Company statement of changes in equity
- 40. 133 Notes to the Parent Company financial statements 134 Related undertakings of the Tesco Group 140 Other information: Registered office addresses 146 Supplementary information (unaudited) 147 Glossary (including APM definitions) 150 Five-year record 154 Shareholder information 155 As a leading retailer, our 440,000(a) colleagues serve around 80 million customers every week, in more than 6,800(b) stores and online. £51.0bn∆(c) Group sales (2016/17: £49.9bn) +795.2% +62.7% +>100% +21.7% +2.3% +2.8% +28.4% +80.6% 29.6% down £1,298m(c) Statutory profit before tax (2016/17: £145m) £2,773m∆ Retail operating cash flow (2016/17: £2,278m) £57.5bn(c) Statutory revenue
- 41. (2016/17: £55.9bn) 11.88p∆(c) Diluted EPS pre-exceptional items, IAS 19 finance costs and IAS 39 fair value remeasurements (2016/17: 7.30p) 3.0p Dividend per share (2016/17: 0.0p) £1,644m∆(c) Group operating profit before exceptional items (2016/17: £1,280m) 12.08p(c) Statutory diluted EPS (2016/17: 0.81p) £1,837m(c) Operating profit (2016/17: £1,017m) £(2.6)bn∆(d) Net debt (2016/17: £(3.7)bn) ∆ Alternative performance measures (APM) Measures with this symbol ∆ are defined in the Glossary section of the Annual Report on pages 150 to 153. (a) Based on an actual year-end headcount. (b) Includes franchise stores. (c) Reported on a continuing operations basis. (d) Excludes the net debt of Tesco Bank.
- 42. 1Tesco PLC Annual Report and Financial Statements 2018 Strategic report Tesco at a glance •73538_Tesco_AR18_Text pages_Bk_180420_HR.indb 1 20/04/2018 15:42 With our turnaround firmly on track, we continue to deliver value for every stakeholder in our business. We have taken important decisions to help our customers through the year – from reformulating thousands of products to reduce salt, fat and sugar, to launching great value exclusive food brands. Thanks to these efforts, our offer is more competitive, and more customers are shopping at Tesco as a result. At the same time, we are also focused on new opportunities for growth. Most significantly, our merger with Booker allows us to become the UK’s leading food business. This report sets out what we have achieved in the year, and gives an update on our medium-term ambitions – our six strategic drivers.
- 43. We are making strong progress, and firmly believe that by serving shoppers a little better every day, the momentum in our business will continue. Serving shoppers a little better every day. Tesco PLC Annual Report and Financial Statements 20182 Introduction •73538_Tesco_AR18_Text pages_Bk_180420_HR.indb 2 20/04/2018 15:42 Following completion of the merger, I am delighted to welcome two new Directors to the Board: Charles Wilson and Stewart Gilliland. Charles has been appointed to the role of CEO for our retail and wholesale operations in the UK & ROI, while Stewart has joined the Board as a Non-executive Director. Both Charles and Stewart bring substantial levels of experience and expertise, and I know that our business will benefit greatly from their talents. I would also like to take the opportunity here to welcome the very many new shareholders in Tesco, who took up our shares as part of the merger. I look forward to meeting many of you over
- 44. the coming months, and to hearing your views. Throughout the year, the Board has dedicated significant time to overseeing the merger process, as well as continuing its close involvement in matters of strategy. The Board has also supported the development of our corporate responsibility strategy for the Group, which culminated in the launch of the Little Helps Plan in October 2017. The plan sets out how we will make a positive contribution to our colleagues, customers and communities – as a sustainable business that also takes a lead on issues of societal importance, such as health and tackling food waste. More details on the Little Helps Plan, and the commitments we have made, can be found starting on page 16 of the Strategic report. Finally, I would like to pay tribute to every colleague at Tesco. I firmly believe that the retail industry, and Tesco in particular, have an important role in helping people to develop fulfilling and successful careers. Almost a quarter of our most senior leaders began their careers in stores and, as I travel around our business, I am constantly impressed by the calibre and experience of the colleagues I meet, from a very diverse range of backgrounds. Tesco is a powerful engine of social mobility, and creating opportunities for colleagues to get on in their careers is a focus for us at every level of our business. It is our colleagues’ dedication, and relentless
- 45. focus on doing the right thing for our customers, that has enabled us to build the strong platform we have today. I am confident that the Board and management team have the right plans in place to build from that platform and continue to grow. That will be our collective focus for the coming year, and beyond, as we create long-term value for every stakeholder in our business. John Allan Non-executive Chairman We have made substantial progress this year, as we position our business for new growth. The management team has built solid foundations – and operating profit before exceptional items for the Group is up 28.4% to £1,644m (2016/17: £1,280m), with statutory profit before tax of £1,298m (2016/17: £145m). This greatly improved performance has also allowed us to make a return to paying dividends, for the first time since 2014. The decision to reinstate the dividend was a particularly important one, and reflects the conviction that the Board and I have in Dave and his team, and the progress we are seeing. So it is from this strong position that we also look ahead to the new opportunities presented by our merger with Booker Group.
- 46. Shortly after the end of our financial year, and following regulatory and shareholder approval, we completed that merger. Work is already well underway to unlock the substantial synergies that are now available to the combined Group. Bringing together knowledge and skills from across retail and wholesale is both allowing us to trial innovative new concepts and to move faster with existing strategies, for example in rapidly growing the fresh food offer available to Booker’s customers. ‘ I would like to pay tribute to every colleague at Tesco.’ John Allan Non-executive Chairman A platform for growth. Watch our videos. Visit www.tescoplc.com/ar2018 to hear more from John Allan. Strategic report Tesco PLC Annual Report and Financial Statements 2018 3 Chairman’s statement •73538_Tesco_AR18_Text pages_Bk_180420_HR.indb 3 20/04/2018 15:42
- 47. This has been another significant year for our business. After three years of turnaround, the results we’ve shared for this year show that we are firmly on track, and delivering on our commitments. I am pleased with the progress we have made, and excited by the opportunities ahead. We have seen nine consecutive quarters of sales growth in our core UK business, with Group sales up 2.3% for the year. Group operating profit before exceptional items is up 28.4% to £1,644m (2016/17: £1,280m), and we are generating more cash – with Retail operating cash flow up 21.7% to £2.8bn (2016/17: £2.3bn). We are also making good progress towards the margin ambition we set out in October 2016, with Group operating margin reaching 3.0% in the second half of the year. At the same time, we have strengthened our balance sheet, with Net debt down 29.6% to £2.6bn (2016/17: £3.7bn). The external environment remains challenging: consumers are feeling the impact of economic uncertainty, and the pressures I described in last year’s Annual Report, such as business rates in the UK and competitive market conditions in Central Europe, have not eased. However, the journey we are on to simplify and grow our business puts us in a strong position to deal with these challenges. By keeping our focus, we are creating value for our customers, colleagues, suppliers and shareholders.
- 48. Customers We are helping customers in the areas that matter most to them, and bringing them more sustainable, affordable, healthy food. As a result, our net promoter score has increased by 5 points as more customers recommend Tesco as a place to shop; loyalty is growing, and in the UK 260,000 more shoppers are shopping at Tesco. In the first half of the year, we took a strategic decision to protect our customers and hold back the inflationary pressure we were seeing in the rest of the UK market. We’ve also looked at other ways to add value for our customers, with a series of little helps through the year, including: – covering the cost of the ‘tampon tax’ on women’s sanitary products in the UK; – removing barriers to eating healthily with our ‘little helps to healthier living’ campaign in the UK, and taking 4,100 tonnes of sugar out of our Own Brand soft drinks in Central Europe; – launching our Clubcard app in Thailand, making it easier for customers to manage their points; – passing on an interest rate increase to savers at Tesco Bank, following the Bank of England’s base rate rise in November; and – running regular ‘Weekly Little Helps’ in the UK,
- 49. helping customers save money on everything from fresh food to fuel. As a business with food at our heart, improving our Own Brand food ranges is a particularly important part of our plans. This year we have relaunched many of these ranges – bringing our customers the best quality products at the very best prices. We have looked at each of the three tiers of our Own Brand offer – ‘good’, ‘better’ and ‘best’ – and are strengthening some brands, like our Tesco core range, and redesigning others, like Tesco finest*. Where our customers want the best value, without any compromise on quality, we are adding to our range of entry-level brands that are exclusively available at Tesco. New brands we have launched for Tesco customers include prepared meals, pasta and sauces from the Hearty Food Co. and bakery products from H. W. Nevill’s. As part of this work, we have already relaunched 1,300 products in the year, with thousands more to follow – and our brand perception measures of quality and value have both increased. Colleagues The improvements we are making to our business are driven by our colleagues, as they serve our shoppers a little better every day. This year, we announced a 10.5% increase in hourly pay for our UK store colleagues over the next two years, and our Colleague Bonus Plan continues to reward colleagues in the UK for
- 50. their contribution to our turnaround. ‘ I’m pleased with the progress we have made, and excited by the opportunities ahead.’ Dave Lewis Group Chief Executive Delivering on our commitments. Watch our videos. Visit www.tescoplc.com/ar2018 to hear more from Dave Lewis. Tesco PLC Annual Report and Financial Statements 20184 Group Chief Executive’s statement •73538_Tesco_AR18_Text pages_Bk_180420_HR.indb 4 20/04/2018 15:42 Some of the changes we have made to simplify our business have had a significant impact on colleagues, including the closure of our Customer Engagement Centre in Cardiff, and changes to our operational structures in stores, and I am grateful for the professionalism and integrity of our colleagues at these difficult times. Over the summer, we also began to move to a new service model in our offices in the UK, followed by similar changes in Central Europe, in order to simplify the way we organise ourselves, reduce duplication and cost, and invest in serving
- 51. shoppers better. In a simpler business, it’s particularly important that we still do everything we can to help colleagues develop their careers as they wish, and this year we have continued our apprenticeship programme in the UK, as well as running a Career Academy in our Thai business, for around 150 students. We’re also committed to building a team which is diverse, and reflects the communities we serve. We continue to develop an inclusive culture at every level of our organisation, helping our colleagues with the flexibility, skills and reward they need to get on. Suppliers With our suppliers, we are building even closer partnerships, working together to deliver great quality products for our customers and grow our mutual businesses. Strategic report Tesco PLC Annual Report and Financial Statements 2018 5 •73538_Tesco_AR18_Text pages_Bk_180420_HR.indb 5 20/04/2018 15:42 In our most recent anonymous Supplier Viewpoint survey, 83% of our UK & ROI suppliers say they are treated fairly, and 94% say we pay promptly – and for the second year running, we topped the independently-run supplier Advantage Survey.
- 52. By growing our business with our closest product partners, we have been able to launch new and exclusive products for our customers, and support our suppliers to invest in innovation. This year we have worked with our partners to launch new products including our Wicked Kitchen vegan range in the UK, Eat Fresh produce brand in Malaysia, and an extended Free From range in Central Europe. One example of particularly close partnership is our Tesco Sustainable Dairy Group, which has now paid an extra £300m to farmers above the market price of milk since it launched – helping them to manage the volatility in milk price experienced by the dairy industry. The group also incentivises our farmers to focus on quality, sustainability and productivity – and following this success, we have set up similar groups for other agricultural products including potatoes, lamb, poultry and eggs. I’m also pleased that 25 of our largest food suppliers have agreed to join us in tackling food waste, by committing to targets on waste, publishing their data, and acting to stop good food going to waste. Shareholders With our business growing again, we resumed the payment of dividends to our shareholders this year – after a three-year absence while we stabilised our business. We remain firmly on track to deliver the medium- term ambitions we set out in October 2016: to
- 53. reduce our costs by £1.5bn, generate £9bn of retail cash from operations and improve operating margins to between 3.5% and 4.0% by 2019/20. By maintaining a disciplined approach to capital, and further reducing our debt – already down from £(8.5)bn in 2014/15 to £(2.6)bn today – we can continue to strengthen our balance sheet and return to investment grade credit metrics. Our underlying philosophy for creating sustainable value for shareholders places increasing focus on cash profitability, free cash flow and earnings growth. An important driver of this growth will come from the benefits of our merger with Booker, which we completed on 5 March 2018. The combined business allows us to access new growth areas, and provide food wherever it is prepared or eaten – ‘in home’ or ‘out of home’. As a result of the merger, I am also delighted to welcome Charles Wilson to the Executive team and Board as our UK & ROI CEO, responsible for both retail and wholesale. A sustainable business It is critically important that as our business delivers growth, we do so in a way which is sustainable. In October 2017, we published our Little Helps Plan, which sets out how we will:
- 54. – create a business where colleagues can get on, whatever their background; – help our customers make healthier choices and enjoy good quality, sustainable products, at affordable prices; and – help make sure no food that could be eaten is wasted, anywhere in our supply chain. More detail on our performance, including statutory results, can be found in our Financial review on page 12. Good. Better. UK food market: food consumed ‘in home’ £110bn UK food market: food consumed ‘out of home’ £85bn Tesco PLC Annual Report and Financial Statements 20186 Group Chief Executive’s statement continued •73538_Tesco_AR18_Text pages_Bk_180420_HR.indb 6 20/04/2018 15:42 We have made good progress in all of these areas this year, and you can read more on pages 16
- 55. to 21 of this report. I’m particularly proud of our efforts to stop good food going to waste – in the UK we have donated 19 million meals from surplus this year to help feed people in need, with a further 2 million and 25 million meals from our businesses in the Republic of Ireland and Central Europe respectively. Looking ahead With our business focused on growth, we will continue to deliver on the same plans for Tesco – our six strategic drivers – that have served us well in our turnaround so far. At the same time, we will begin to deliver the substantial synergies that our merger with Booker unlocks: bringing benefits to consumers and colleagues, creating a wider market opportunity for our suppliers and new career opportunities for our colleagues – as well as accelerating the growth of our combined business for shareholders. In what has been a very significant year, I am grateful to every colleague in our business for everything they have done to keep serving shoppers better. It is their dedication and talent which drives all of our plans, and I look forward to continuing our work together as we grow the UK’s leading food business. Dave Lewis Group Chief Executive
- 56. For example, our trial of a new Chef Central format is well underway, with a first store in Bar Hill, Cambridge selling products in bulk to professional caterers and the public alongside our existing Tesco Extra store. And, where it’s right for our customers, we are offering catering-format products in a number of Tesco stores too. These are just the early stages of the many exciting opportunities in front of us. As we look ahead, our combination of businesses uniquely positions us to better serve the large and growing food market in the UK. The combined Tesco and Booker business allows us to bring together the retail and wholesale expertise of our two businesses, and access new opportunities for growth. Together we employ over 310,000 colleagues in the UK, serve 117,000 independent retailers, 441,000 catering businesses, 641,000 small businesses, and work with over 7,000 suppliers. Through our merger, we will bring benefits to customers, suppliers, colleagues and shareholders: – We will delight consumers with better availability of quality food at attractive prices across retail and eating out locations, and serve better the faster growing ‘out of home’ food market.
- 57. – We will help independent retailers, caterers and small businesses by further improving choice, price and service, with enhanced digital and delivery service options. – And for our suppliers, we will create a broader market opportunity, with strong growth prospects and a clear opportunity to develop better own brand and fresh ranges. As our two businesses join forces, we are already beginning to deliver benefits. Importantly, there is no lengthy integration process, as we want to keep the complementary skills of retail and wholesale in our business, and start accessing growth opportunities as quickly as possible. Best. Tesco and Booker merger. Strategic report Tesco PLC Annual Report and Financial Statements 2018 7 •73538_Tesco_AR18_Text pages_Bk_180420_HR.indb 7 20/04/2018 15:42 1. A differentiated
- 58. brand A strong and differentiated brand creates long-term value for every stakeholder in our business. Our purpose, to serve shoppers a little better every day, is at the heart of what our brand stands for. Over the last year, we have continued to build trust, and have seen a 5 point improvement in customer recommendations of our brand. We continue to focus on products and services which make the Tesco offer unique, and this year we have relaunched our core and finest* food ranges, as well as introducing new brands which are exclusive to Tesco, such as our Hearty Food Co. ready meals, and our Fox & Ivy homeware. Food quality is a particularly powerful driver of supermarket choice, so strengthening customer perceptions of our food is a priority. Our Food Love Stories campaign has continued this year, celebrating the food our customers love to make, for the people they love – and helping increase customer perceptions of quality at Tesco, up 2.7 points year-on-year. But the way customers feel about our brand is defined by more than just our products: it’s also about how we respond to the issues that matter to them, from healthy eating to reducing plastic packaging – and the value that Tesco creates for society. In May 2017, we held our first ever health month for colleagues and customers, including helpful
- 59. ‘little swaps’ with products that are lower in saturated fat, salt and sugar, and recorded our highest ever score for customers saying that Tesco helps them lead healthier lives. 2. Reduce operating costs by £1.5bn We continue to simplify our business and reduce costs, with in-year savings of £594m – and £820m of savings to date towards our £1.5bn ambition. We have reviewed every aspect of our operation to identify opportunities for savings – with a particular focus on our store operating model, where we have delivered £541m of savings; logistics and distribution, with £104m of savings; and goods not for resale, where we have made savings of £174m. We continue to encourage a cost-conscious culture, finding savings so that we can reinvest for the benefit of customers. We have also simplified the shopping experience for customers, at the same time as reducing costs, for example by increasing availability of our Scan As You Shop self-scan handsets – now in over 500 UK stores and beginning to roll out in Central Europe – and making till receipts optional in our smaller stores, which has generated savings of around £3m. We have also made strong progress in reducing the costs of procuring goods and services not for resale, finding synergies across the Group.
- 60. In particular, we have improved our services in facilities management, freight and media services, while also delivering savings of £50m. 3. Generate £9bn cash from operations Our focus on free cash generation continues, and Retail cash generated from operations increased by £495m to £2,773m this year, driven by improved profitability and strong working capital management. One example of our work is in reducing stockholding, by improving the way we receive deliveries from our suppliers. To minimise our environmental impact, and reduce transport costs, we order full trucks of products from suppliers whenever we can – which sometimes means ‘rounding up’ an order. However, by analysing our orders forensically, we have been able to sort stock between trucks and identify where we can eliminate a truck. This removes unnecessary journeys for our suppliers, and allows us to take out unnecessary ‘rounded’ stock. Because we are ordering only what’s needed to ensure great availability, our customers can buy what they want, and we can order less. Our six strategic drivers will create long-term value for all of our stakeholders.
- 61. An update on our six strategic drivers. Tesco PLC Annual Report and Financial Statements 20188 The six strategic drivers •73538_Tesco_AR18_Text pages_Bk_180420_HR.indb 8 20/04/2018 15:42 4. Maximise the mix to achieve a 3.5% - 4.0% margin To achieve our 3.5% - 4.0% margin ambition by our 2019/20 financial year, we continue to build sustainable profitability across our businesses, channels and product ranges. By carefully managing the combination of volume, mix and cost-effectiveness in our business, Group operating margin for this year was 2.9% – up 57 basis points. In Asia, our margin has grown to 6.0%, as we have stepped back from unprofitable bulk selling in Thailand. This was a deliberate decision that we took at the start of the year, allowing us to focus on serving our core retail customers better, and increase profitability. In our online business, we are improving the economics of our offer, while giving customers greater choice and flexibility. For example, we have extended our delivery saver subscription service, to introduce new monthly plans – offering a great value option to our most loyal customers.
- 62. We have also extended our Click & Collect options – including same-day collection – with slots at a range of prices so that customers can choose the service most convenient to them. 5. Maximise value from property Our property portfolio across the Group is significant, and we are looking at opportunities to better use our space for the benefit of customers, while also releasing value where it’s the right thing to do for our business. Over the last three years, we have released a cumulative £1.4bn of value from property proceeds, at the same time as increasing our proportion of freehold property in the UK & ROI from 41% to 52%. In the UK, we are exploring a small number of opportunities to work with a third-party to re-develop our store sites in high-value locations. Our Hackney store in London is one such example, where we have sold the site for a mixed-use development – allowing us to release value, while still retaining a store on the new site and with continuity of trade throughout. We can also create value for our customers by using space in new ways, as we repurpose space in our larger stores – and this year, we have repurposed 1.1m sq. ft. of space. In Central Europe, we have worked with partners to bring a new offer to customers in a number of our stores – and this year, across the region, we opened ten shop units
- 63. with H&M, and three with Decathlon. 6. Innovation To serve our shoppers a little better every day, it’s important we listen and respond to their needs, with innovation across every aspect of our offer, and a strong pipeline of ideas to come to market. We have innovated in our product ranges – for example, with the launch of our exclusive Wicked Kitchen range of plant-based dishes, including new ingredients and exotic preparations such as carrot ‘pastrami’ and eryngii mushroom ‘bolognese’. The range responds to increasing demand for vegetarian and vegan food, and since its January launch has proved extremely popular with customers. As customers look for increasingly convenient options to do their shopping, this year we became the first retailer in the UK to offer same-day grocery deliveries nationwide, and in London – through our Tesco Now app – we can deliver within an hour. And at Tesco Bank, our award-winning Tesco Pay+ digital wallet continues to prove popular with customers, with over 450,000 downloads of the app. 9Tesco PLC Annual Report and Financial Statements 2018 Strategic report
- 64. •73538_Tesco_AR18_Text pages_Bk_180420_HR.indb 9 20/04/2018 15:42 Customers Tesco exists to serve customers – listening to them and acting on what is most important, however they choose to shop with us. Product We build close and mutually-beneficial relationships with our supplier partners, to source the best possible products that meet and anticipate customers’ needs. Reinvest Our focus is always on making Tesco the best it can be for our customers. The better a job we do for customers, the more we will improve sales; the more our sales improve, the more we can reinvest in further improving the shopping trip. Channels To bring the best products to
- 65. customers we work through a range of channels – from small shops to large shops, and our online business. Booker gives us access to new channels, including Business Centres and delivered wholesale. Our business is organised around the three pillars of Customers, Product and Channels, and we measure our progress with six simple key performance indicators. Customers, Product, Channels. Tesco PLC Annual Report and Financial Statements 201810 Our business model and Big 6 KPIs •73538_Tesco_AR18_Text pages_Bk_180420_HR.indb 10 20/04/2018 15:42 2016/17 2017/18 -1.6pts 2016/17 2017/18 +0pts 2016/17 2017/18 +5pts
- 66. 2016/17 2017/18 +25.9% 2016/17 2017/18 +0.6% 2016/17 2017/18 +21.7% Grow sales Customers recommend us and come back time and again Deliver profit Colleagues recommend us as a great place to work and shop Improve operating cash flow We build trusted partnerships Alternative performance measures (APM) Measures with this symbol ∆ are defined in the Glossary section of the Annual Report on pages 150 to 153. (a) Reported on a continuing operations basis (excludes Turkey). Growth is at constant exchange rates, on a comparable days basis. (b) Reported on a continuing operations basis (excludes Turkey). Growth is at actual exchange rates. (c) Net Promoter Score (NPS) equals ‘fans’ (those scoring 9-10 out of 10) minus ‘critics’ (those scoring 0-6) on an 11 point scale question of 0-10. (d) Based on our internal ‘What Matters To You?’ survey. Chart shows the movement in ‘Great place to work’. (e) Based on the question “Overall, how satisfied are you with
- 67. your experience of working with Tesco?” in our Supplier Viewpoint survey. £51.0bn∆(a) Group sales (2016/17: £49.9bn) £1,644m∆ Group operating profit before exceptional items(a) (2016/17: £1,280m) 12pts Group net promoter score(c) (2016/17: 7pts) £2,773m∆ Retail operating cash flow(b) (2016/17: £2,278m) 74.9% Group supplier satisfaction(e) (2016/17: 77%) 83% Great place to work(d) (2016/17: 83%) 49pts Great place to shop(c) (2016/17: 48pts) Group sales continue to grow, with Q4 2017/18 marking our ninth
- 68. consecutive quarter of like-for-like sales growth for the Group. Retail operating cash flow increased by £495m in the year, mainly driven by improved Group profitability. Group operating profit before exceptional items increased by 25.9% at constant exchange rates, with Group operating margin reaching 3.0% in the second half of the year. Customer feedback continues to improve, reflecting our work to serve shoppers a little better every day. We are committed to strong partnerships with our suppliers, built on open, fair and transparent relationships. Our supplier feedback score remains at a high level, despite inflationary challenges. Every day our colleagues go the extra mile to serve our shoppers better, and more colleagues are recommending Tesco as a great place to shop. 11Tesco PLC Annual Report and Financial Statements 2018 Strategic report •73538_Tesco_AR18_Text pages_Bk_180420_HR.indb 11 20/04/2018 15:42 Group results 2017/18 52 weeks ended 24 February 2018
- 69. On a continuing operations basis 2017/18 2016/17 Year-on-year change (Constant exchange rates) Year-on-year change (Actual exchange rates) Group sales (exc. VAT, exc. fuel)(a) £50,991m £49,867m 0.6% 2.3% Fuel £6,500m £6,050m 7.1% 7.4% Revenue (exc. VAT, inc. fuel) £57,491m £55,917m 1.3% 2.8% Group operating profit before exceptional items(b) £1,644m £1,280m 25.9% 28.4%
- 70. UK & ROI £1,053m £803m 30.3% 31.1% Central Europe £119m £58m 89.7% 105.2% Asia £299m £262m 7.6% 14.1% Tesco Bank £173m £157m 10.2% 10.2% Include exceptional items £193m £(263)m Group operating profit £1,837m £1,017m 76.6% 80.6% Group profit before tax before exceptional items, IAS 19 finance costs and IAS 39 fair value remeasurements £1,282m £781m 64.1% Group statutory profit before tax £1,298m £145m 795.2% Diluted EPS before exceptional items, IAS 19 finance costs and IAS 39 fair value remeasurements 11.88p 7.30p Diluted EPS 12.08p 0.81p Basic EPS 12.12p 0.81p Dividend per share 3.0p – Capex(c) £1.1bn £1.2bn Net debt(d)(e) £(2.6)bn £(3.7)bn
- 71. Cash generated from retail operations(d) £2.8bn £2.3bn (a) Group sales exclude VAT and fuel. Sales growth shown on a comparable days basis. (b) Excludes exceptional items by virtue of their size and nature in order to reflect management’s view of the performance of the Group. (c) Capex is shown excluding property buybacks. (d) Net debt and retail operating cash flow exclude the impact of Tesco Bank, in order to provide further analysis of the retail cash flow statement. (e) Net debt includes both continuing and discontinued operations. The definition and purpose of the Group’s alternative performance measures, which includes like-for-like sales, are defined on pages 150 to 153. A detailed analysis of discontinued operations can be found in Note 7. This was another strong performance for Tesco with results ahead of expectations. We grew sales by 0.6%, excluding VAT, excluding fuel, at constant exchange rates and experienced like-for-like sales growth of 0.7%. Group operating profit before exceptional items was £1,644m, up 28.4% on last year as we significantly strengthened our profitability, remaining firmly on track to deliver our medium-term ambitions. Our statutory profit
- 72. before tax increased to £1,298m including £155m of exceptional items. We generated retail operating cash flow of £2.8bn, up 21.7% on last year, driven by the strong improvement in our operating profit. We reduced net debt (excluding Tesco Bank) by 29.6% to £(2.6)bn. We are well placed to deliver our ambition of a Group operating margin of 3.5%-4.0% by the 2019/20 financial year. This ambition is underpinned by six strategic drivers, including the £1.5bn operating cost reductions which we are on track to secure, having delivered cumulative savings of £820m to date. Reflecting our improved performance and confidence in future prospects, the Board has proposed the payment of a 2.0 pence per share final dividend following on from the interim dividend of 1.0 pence per share. We expect dividends to grow towards a target cover of around two times earnings per share over the medium term. Segmental results UK & ROI On a continuing operations basis 2017/18 2016/17 Year-on-year
- 73. change (Constant exchange rates) Year-on-year change (Actual exchange rates) Sales (exc. VAT, exc. fuel) £38,650m £37,692m 2.2% 2.5% Like-for-like sales (exc. VAT, exc. fuel) 2.3% 0.9% Revenue (exc. VAT, inc. fuel) £44,908m £43,524m Revenue includes: fuel £6,258m £5,832m Operating profit before exceptional items £1,053m £803m 30.3% 31.1%
- 74. Operating profit margin before exceptional items 2.34% 1.84% 49bp 50bp Operating profit £1,199m £519m In the UK and the Republic of Ireland (ROI), like-for-like sales grew by 2.3%. In the UK, like-for-like sales growth of 2.2% includes our ninth consecutive quarter of positive performance, despite an ongoing drag of (0.4)% from general merchandise as we take action to de-emphasise certain categories. We delivered a consistently strong performance in fresh food, outperforming the market in volume terms. During the fourth quarter we experienced some distribution-related disruption, following the administration of Palmer & Harvey, resulting in lost tobacco sales across December. Despite these challenges, which are now behind us, we continued to deliver positive sales momentum through the fourth quarter. Market conditions have remained challenging with continued cost price inflation. We have worked hard with our supplier partners throughout the year to mitigate price increases wherever possible, and made a significant investment in the first half to further hold back inflation and protect
- 75. customers. We have continued to reduce promotional participation over the year, focusing instead on consistently offering the best value for customers on all of our products. Our own brand ranges have performed very well, with like-for- like sales growing 4.2% year-on-year. We have embarked on a re-launch of over 10,000 own brand products, across our entry, core and finest* ranges, with the initial focus on ready meals and Italian products. Our new, exclusive Hearty Food Co. range of ready meals and improved core Tesco products have proved particularly popular, contributing to an increase in overall own brand participation of nearly one percent. We have continued to refine our general merchandise range, reducing SKUs by 16%, as we focus on categories with more sustainable profitability. We have delivered 2.7% sales growth in our home category, following the launch of our new own brand Go Cook and Fox & Ivy ranges. These new brands have driven a 14% and 20% increase in customers to our cook and homeware ranges, respectively. Clothing performed well during the year with like-for-like sales growth of 2.6%, reflecting the strength of the F&F brand and quality of our range. All store formats and channels have achieved like-for-like
- 76. growth, with our large store business growing at 1.9% and our online grocery sales growing 5.1% with both higher order numbers and increased average basket size. In ROI, like-for-like sales grew by 2.7%, improving steadily throughout the year as customers responded well to an even more competitive price position. The main driver of growth was a 4.2% increase in volume, ahead of market volume growth. Fresh food volumes were particularly strong, growing by 5.2% year-on-year. Another year of strong progress. Visit www.tescoplc.com/ar2018 to find PDF and Excel downloads of our financial statements. ‘ This was another strong performance for Tesco, with profits ahead of expectations and a solid improvement in cash generation.’ Alan Stewart Chief Financial Officer Tesco PLC Annual Report and Financial Statements 201812 Financial review •73538_Tesco_AR18_Text pages_Bk_180420_HR.indb 12 20/04/2018 15:42
- 77. Our full-year UK & ROI operating profit before exceptional items was £1,053m, up 31.1% on last year. Our efforts to reduce operating costs and improve efficiencies across our store estate and head office have delivered a significant increase in profitability, particularly during the second half when our operating margin reached 2.5%, up 67 basis points year -on- year. Further progress on maximising the mix within our business and driving volume more selectively, particularly in general merchandise, has aided margin expansion. Central Europe On a continuing operations basis 2017/18 2016/17 Year-on-year change (Constant exchange rates) Year-on-year change (Actual exchange rates)
- 78. Sales (exc. VAT, exc. fuel) £6,343m £5,977m (1.6)% 6.1% Like-for-like sales (exc. VAT, exc. fuel) 0.3% 0.9% Revenue (exc. VAT, inc. fuel) £6,585m £6,195m Revenue includes: fuel £242m £218m Operating profit before exceptional items £119m £58m 89.7% 105.2% Operating profit margin before exceptional items 1.81% 0.94% 86bp 87bp Operating profit £212m £190m In Central Europe, like-for-like sales increased by 0.3% despite competitive market conditions. Our focus on improving the quality and breadth of the range in our stores has delivered positive results with fresh food sales
- 79. growth of 1.2%. However, this growth was held back by declines in general merchandise and clothing. Our convenience formats delivered positive like-for-like growth across all countries. We have continued to exit from unprofitable stores in the region, with 28 store closures contributing to an overall sales reduction of (1.6)% at constant exchange rates. Legislative changes in the region are affecting our business, with Poland phasing in a gradual ban on Sunday trading from March 2018, which takes complete effect by 2020. Central Europe operating profit before exceptional items was £119m, up £61m year-on-year at actual exchange rates. We have made continued progress towards operating the four markets we serve as one combined region, helping to improve our customer offer. In the first half of the year we opened a new distribution centre in Galánta, Slovakia serving all four countries and benefiting from the best local practices in the region. The resulting benefits of more effective stock management combined with our other efforts on cost savings have more than offset the impact of inflation on the cost base and enabled us to improve profitability. Asia
- 80. On a continuing operations basis 2017/18 2016/17 Year-on-year change (Constant exchange rates) Year-on-year change (Actual exchange rates) Sales (exc. VAT, exc. fuel) £4,947m £5,186m (9.4)% (4.4)% Like-for-like sales (exc. VAT, exc. fuel) (10.0)% 1.8% Revenue (exc. VAT, inc. fuel) £4,947m £5,186m Revenue includes: fuel – – Operating profit before
- 81. exceptional items £299m £262m 7.6% 14.1% Operating profit margin before exceptional items 6.04% 5.04% 96bp 99bp Operating profit £277m £231m In Asia, our previously announced decision to withdraw from unprofitable bulk selling activities in Thailand and scale back mass couponing contributed to a (10.0)% decline in like-for-like sales. Adjusting for this impact, underlying like-for-like sales in the region were down (1.0)%, largely reflecting the deflationary effect of lowering our fresh food prices for customers. Asia operating profit before exceptional items was £299m, up 7.6% at constant exchange rates and up 14.1% at actual exchange rates. This improvement has been driven by refocusing on our core retail offer and continuing to reduce our cost base as part of the Group’s overall cost savings programme. Tesco Bank 2017/18 2016/17
- 82. Year-on-year change Revenue £1,051m £1,012m 3.9% Operating profit before exceptional items £173m £157m 10.2% Operating profit £149m £77m 93.5% Lending to customers £11,522m £9,961m 15.7% Customer deposits £9,245m £8,463m 9.2% Net interest margin 3.9% 4.0% (0.1)% Risk asset ratio 19.3% 20.0% (0.7)% Tesco Bank celebrated twenty years of serving Tesco shoppers this year. Throughout the year, the Bank has continued to strengthen its product and service offering to customers, delivering growth of 4.1% in active customer account numbers across its primary products. During the year, we completed the roll-out of Tesco Pay+, the Group’s digital wallet offering, to every one of our stores in the UK. In July 2017, we celebrated the fifth anniversary of the launch of our mortgage product, which has now reached £3.0bn in balances. Operating profit before exceptional items increased by 10.2% year-on-year to £173m. Lending growth in the year has been strong, driven by secured mortgage lending which now comprises 26% of the lending
- 83. portfolio, versus 22% last year. In addition, Money Services products such as our Travel Money offer have performed well overall as the Group continues to enhance the product range and expand the customer base. Exceptional items of £(24)m relating to Tesco Bank include an increase in the provision for customer redress and a credit received following the conclusion of negotiations with a third party in respect of previously recognised customer redress. The balance sheet remains strong and well-positioned to support future lending growth from both a liquidity and capital perspective with a risk asset ratio of 19.3%. Exceptional items in operating profit 2017/18 2016/17 Net restructuring and redundancy costs £(102)m £(199)m Net impairment reversal/(charge) of non-current assets and onerous lease provisions £53m £(6)m Provision for customer redress £(24)m £(45)m Interchange settlement – £57m Investment disposal £124m – Property transactions £79m £165m Disposal of opticians business £38m – Amounts provided and released in relation to SFO and FCA obligations
- 84. £25m £(235)m Total exceptional items in operating profit £193m £(263)m Exceptional items are excluded from our headline performance measures by virtue of their size and nature in order to reflect management’s view of the performance of the Group. In the current year, the net effect of exceptional items on operating profit is £193m. Net restructuring and redundancy charges of £(102)m relate principally to structural changes to our business to simplify our operating model within stores and head office. The net impairment reversal of non-current assets and onerous lease provisions of £53m includes a net reversal of £185m in property, plant and equipment and investment property, a net £(24)m charge in software and other intangible assets and a net charge of £(108)m of onerous lease provisions. Provision for customer redress of £(24)m relating to Tesco Bank, includes an increase of £(35)m in the provision for Payment Protection Insurance (PPI), partially offset by a £1m Consumer Credit Act (CCA) provision release and a credit of £10m received following the conclusion of negotiations with a third
- 85. party in respect of previously recognised customer redress. The investment disposal profit of £124m reflects the sale of our remaining minority stake in the Lazada e-commerce platform, completed during the first half. The sale of our opticians business in the UK & ROI to Vision Express resulted in a £38m gain on disposal. 13Tesco PLC Annual Report and Financial Statements 2018 Strategic report •73538_Tesco_AR18_Text pages_Bk_180420_HR.indb 13 20/04/2018 15:42 Two property-related transactions completed in the UK in the first half of the year account for the majority of the £79m property transactions within exceptional items. In the prior year, we took an exceptional charge of £(235)m in respect of the Deferred Prosecution Agreement (DPA) between Tesco Stores Limited and the UK Serious Fraud Office (SFO) regarding historic accounting practices and an agreement with the UK Financial Conduct Authority (FCA) of a finding of market abuse in relation to the Tesco PLC trading statement announced on 29 August 2014. Included in this charge was
- 86. £(85)m for the Shareholder Compensation Scheme. With the Compensation Scheme now being closed to new claimants, we have released £25m of the amounts provided. Outstanding claims submitted before the 22 February 2018 deadline are still being processed. Joint ventures and associates, interest and tax Joint ventures and associates Our share of post-tax losses from joint ventures and associates before exceptional items was £(6)m, an improvement of £24m year-on- year due to reduced losses recognised in Gain Land, our joint venture in China. There were no exceptional items this year relating to our share of post-tax losses from joint ventures and associates. Finance income and costs 2017/18 2016/17 Interest payable on medium term notes, loans and bonds £(363)m £(434)m Interest receivable on associated derivatives £31m £6m Net interest on medium term notes, loans and bonds £(332)m £(428)m Other interest receivable and similar income £44m £42m Other finance charges and interest payable £(70)m £(89)m Capitalised interest £2m £6m Net finance cost before exceptional charges,
- 87. IAS 19 net pension finance costs and IAS 39 fair value remeasurements £(356)m £(469)m IAS 39 fair value remeasurements £23m £61m IAS 19 net pension finance costs £(162)m £(113)m Exceptional charge – translation of Korea proceeds £(38)m £(244)m Net finance costs £(533)m £(765)m Net finance costs before exceptional charges, IAS 19 net pension finance costs and IAS 39 fair value remeasurements reduced by £113m year-on-year to £(356)m. This 24.1% decline year-on-year was mainly driven by a net £96m reduction in interest on interest-bearing liabilities. Debt maturities totalled £1.4bn during the year and we also undertook £1.3bn of bond tenders in two separate liability management exercises. These bond tenders during the year contributed to £23m lower interest costs and we expect an associated reduction in interest payable of c.£50m on an annualised basis. In cash interest terms, we were helped by a favourable timing benefit of £55m on our largest sterling-denominated bond, for which no annual coupon payment was made during the year owing to the timing of our year-end date. Net finance costs, which include non-cash items, were around 30% lower
- 88. year-on-year. Fair value remeasurements are largely driven by changes in the market assessment of credit risk and various market indices which can fluctuate significantly. Net pension finance costs increased by £(49)m year-on-year driven by a higher opening pension deficit part offset by a lower opening discount rate. Net pension finance costs are calculated by multiplying the opening deficit by the opening discount rate each year. For 2018/19, they are expected to decrease to c.£(95)m as the impact of a higher opening discount rate is more than offset by the year-on-year reduction in deficit. The exceptional charge of £(38)m relating to the translation of the remaining proceeds from the sale of our business in Korea will not arise again since the funds have now been moved to a Sterling denominated entity within the Group. The proceeds had been held in GBP money market funds in a non-Sterling denominated subsidiary and the translation effect represents no economic cost to the Group. Group tax Tax on profit before exceptional items was £(286)m, with an effective tax rate on profit before exceptional items for the Group of 25.0%. As previously indicated, this tax rate is higher than the UK statutory rate