SlideShare a Scribd company logo
1 of 69
Download to read offline
No 47 (2020)
Р.6
The scientific heritage
(Budapest, Hungary)
The journal is registered and published in Hungary.
The journal publishes scientific studies, reports and reports about achievements in different scientific
fields. Journal is published in English, Hungarian, Polish, Russian, Ukrainian, German and French.
Articles are accepted each month. Frequency: 12 issues per year.
Format - A4
ISSN 9215 — 0365
All articles are reviewed
Free access to the electronic version of journal
Edition of journal does not carry responsibility for the materials published in a journal. Sending the
article to the editorial the author confirms it’s uniqueness and takes full responsibility for
possible consequences for breaking copyright laws
Chief editor: Biro Krisztian
Managing editor: Khavash Bernat
 Gridchina Olga - Ph.D., Head of the Department of Industrial Management and Logistics
(Moscow, Russian Federation)
 Singula Aleksandra - Professor, Department of Organization and Management at the University
of Zagreb (Zagreb, Croatia)
 Bogdanov Dmitrij - Ph.D., candidate of pedagogical sciences, managing the laboratory
(Kiev, Ukraine)
 Chukurov Valeriy - Doctor of Biological Sciences, Head of the Department of Biochemistry of
the Faculty of Physics, Mathematics and Natural Sciences (Minsk, Republic of Belarus)
 Torok Dezso - Doctor of Chemistry, professor, Head of the Department of Organic Chemistry
(Budapest, Hungary)
 Filipiak Pawel - doctor of political sciences, pro-rector on a management by a property complex
and to the public relations (Gdansk, Poland)
 Flater Karl - Doctor of legal sciences, managing the department of theory and history of the state
and legal (Koln, Germany)
 Yakushev Vasiliy - Candidate of engineering sciences, associate professor of department of
higher mathematics (Moscow, Russian Federation)
 Bence Orban - Doctor of sociological sciences, professor of department of philosophy of religion
and religious studies (Miskolc, Hungary)
 Feld Ella - Doctor of historical sciences, managing the department of historical informatics,
scientific leader of Center of economic history historical faculty (Dresden, Germany)
 Owczarek Zbigniew - Doctor of philological sciences (Warsaw, Poland)
 Shashkov Oleg - Сandidate of economic sciences, associate professor of department (St. Peters-
burg, Russian Federation)
«The scientific heritage»
Editorial board address: Budapest, Kossuth Lajos utca 84,1204
E-mail: public@tsh-journal.com
Web: www.tsh-journal.com
CONTENT
ECONOMIC SCIENCES
Broyaka A.
FOOD SECURITY OF UKRAINE AS A COMPONENT OF
ECONOMIC SECURITY OF THE STATE ..........................3
Bereziuk S., Yaremchuk N.
CORRUPTION AS A DESTRUCTIVE FACTOR OF
ECONOMIC DEVELOPMENT ......................................11
Poliatykina L., Samoshkina I., Poliatykin V.
THE FORMATION OF THE INSURANCE SYSTEM OF
ENVIRONMENTAL RISKS............................................22
Bekimbetova G.
ANALYSIS OF RISKS IN THE EVALUATE OF EFFICIENCY
OF INVESTMENT PROJECTS IN THE IMPLEMENTATION
OF INNOVATION PROCESSES IN PRODUCTION.........26
Belimova E.
EXPERIENCE IN PROVIDING OUTSOURCING SERVICES
IN THE CITY OF SURGUT............................................29
Bondarenko V., Ezangina I.
WAYS TO INCREASE PENSION SAVINGS OF THE
RUSSIAN PENSION FUND: MODERN ASPECTS ..........32
Veselova Yu., Chekulaeva S.
ANALYSIS OF PARAMETERS FOR EVALUATING THE
QUALITY MANAGEMENT OF RAILWAY PASSENGER
TRANSPORT...............................................................35
Herasymchuk V.
ECONOMIC AND MATHEMATICAL FORECASTING OF
THE FINANCIAL STATUS OF THE ENTERPRISE IN
MODERN CONDITIONS..............................................39
Dovbnya G., Voronina L.
BRAND DIDGITAL ANALYSIS AS COMPETITIVE
ADVANTAGE..............................................................52
Karimov E.
CALCULATION AND ANALYSIS OF MECHANICAL
TRADING SYSTEM BASED ON TECHINCAL
INDICATORS...............................................................55
Kolesnikov A.
ESSENCE, CRITERIA AND INDICATORS OF
DEVELOPMENT OF LARGE-SCALE AGRICULTURAL
PRODUCTION.............................................................58
Kitseliuk U.
ANALYSIS OF THE RELATIONSHIPS BETWEEN
REGIONAL ECONOMIC SYSTEMS AND NATIONAL
ECONOMY .................................................................62
The scientific heritage No 47 (2020) 3
ECONOMIC SCIENCES
FOOD SECURITY OF UKRAINE AS A COMPONENT OF ECONOMIC SECURITY OF THE STATE
Broyaka A.
PhD in Economics, Associate Professor of Economics Department,
Vinnytsia National Agrarian University
Abstract
The article studies the current state of food security in Ukraine based on statistical data of the outlined criteria,
in particular: the daily energy value of the human diet, the sufficiency of consumption in terms of basic foods, the
dynamics of food consumption by the population and the structure of its expenditures, indicators of the adequacy
of state supplies of grain, economic food affordability; the cost differentiation of food products by population
groups with different income levels, the capacity of the domestic market and its import dependency. It has been
found out that the state of food security in Ukraine does not meet the established threshold values and norms of
the majority of indicators. Nevertheless, the value of individual indicators calculated according to 2018 data com-
paring with previous years positively characterizes the dynamics of food security in Ukraine: the level of con-
sumption sufficiency has increased for a great number of types of products; satisfaction of the population food
needs was carried out mainly due to domestic agricultural products. At the same time, the state of food security in
Ukraine cannot be characterized as stably positive as: the average daily caloric intake of country population de-
creased in terms of livestock products; there is a significant gap in consumption between the quintile groups of
households by income; a high level of food dependence has been established (subject to rational consumption
standards) for meat, milk, fish products, fruits, berries and grapes; the percentage of import dependence of Ukraine
for oil, fruits, berries and grapes exceeds the threshold level.
The ranking of Ukraine in the world community has been analyzed according to the Global Food Security
Index – 2019. It has been worsened by 13 points compared to the previous year.
As a result of the study, the problems in the formation of proper food security system are identified taking
into account the features of their manifestation in modern socio-economic and political conditions. The directions
of state policy on ensuring food security in Ukraine are determined, such as: balancing of the domestic agricultural
market, developing of material and technical base of agricultural production, maintaining the income growth of
the population, etc.
Keywords: food security, food security indicators, food consumption sufficiency, import dependency, food
safety and quality.
Introduction. The recent social, economic and
political transformations in Ukraine brought to the sur-
face a number of important problems, the successful so-
lution of which is the key to the further self-sustaining
development of the national economy. Ensuring the
food security of the country is among such problems,
which in critical situations is one of the indicators of
the level of foreign economic dependence of the coun-
try and its sovereignty. The decline in the living stand-
ard and purchasing power of citizens, the destruction of
economic relations with Russia, the opening of Euro-
pean and world markets, the imperfection of state reg-
ulation of the agricultural market and support of the na-
tional producer, incomplete land reforms and a number
of other factors have led to an aggravation of the prob-
lem of ensuring food security in Ukraine. The current
quarantine state in Ukraine and world economies to-
gether with COVID-19 causes an even greater deepen-
ing of socio-economic problems that in its turn also
leads to deterioration in the food supply of the popula-
tion.
Analysis of recent research and publications.
The foundations of modern concepts of food security
were laid after the Second World War, when the prob-
lem of food security in many countries became even
more acute. The tasks of overcoming food shortages
were spelled out in the Charter of the United Nations
created at that time that to this day is actively address-
ing the problem of global food security. Given the fact
that the problem of food security does not lose its ur-
gency, despite the progress achieved in food production
in the world, economic science is constantly being re-
plenished with studies on various aspects of food secu-
rity. Food security issues are in the center of constant
attention of Ukrainian scientists, in particular L. Dein-
eko, M. Kaletnik, A. Kardash, S. Kvasha, Yu. Lupenko,
A. Mostova, B. Paschaver, P. Sabluk, M. Sychevskiy,
A. Shpychak, A. Yuzefovych and others. Nevertheless,
the emergence of new factors affecting food security
and the dynamic changes taking place in Ukrainian
economy in the vectors and the scales of its integration
into the global food market leave wide scope for further
research.
Goals setting. The purpose of the article is to in-
vestigate the state of food security in Ukraine and as-
sess the possibilities of its strengthening in the face of
modern internal and external challenges.
Research results. Food security is an important
component of the economic and national security of the
state. As indicated in the National Doctrine of Food Se-
curity of Ukraine, food security is the state of the econ-
omy, which ensures food independence of the country,
guaranteed physical, economic and social accessibility
of the population to a sufficient amount of nutritious
and safe food, in accordance with the recommended
4 The scientific heritage No 47 (2020)
diet and nutritional standards [9]. The need to ensure
food security requires maintaining a guaranteed stable
and sufficient level of agri-food production, determines
the trends in domestic and foreign economic policy,
formulates measures for socio-economic stabilization
and demographic renewal of society, as well as improv-
ing the quality of its life.
General methodological approaches to the analy-
sis of the state of food security as one of the compo-
nents of economic security are described in the “Me-
thodical recommendations for calculating the level of
economic security of Ukraine” dated October 29, 2013
No. 1277. The level of food security, based on these
recommendations, is estimated using a system of indi-
cators, including: daily calorie intake, thousand kСal;
the ratio of production and consumption of the major
groups of food products, %; grain production per per-
son, tons; grain reserves at the end of the period, % of
consumption; the share of sales of imported food prod-
ucts through the trading network of enterprises, % [7].
The indicators reflect the characteristics of food secu-
rity in terms of current status, changes, and dynamics.
The food security indicator acts as an indicative eco-
nomic indicator, a measure that allows predicting with
a certain degree of accuracy in which direction we
should expect the development of economic processes.
We can distinguish macro- and microeconomic indica-
tors of food security.
However, assessing the level of food security is
often carried out according to the Methodology for de-
termining the main indicators of food security approved
by the Cabinet of Ministers of Ukraine dated
05.12.2007 No. 1379 "Some issues of food security",
which contains the following indicators and their
threshold values [4].
1) The daily energy value of the human diet is de-
fined as the sum of the products of a unit mass of certain
types of food consumed by a person during the day and
their energy value. The boundary minimum criterion is
set at 2500 kCal per day, while 55% of the daily diet
should be provided by consuming products of animal
origin.
The Figure 1 indicates that the daily caloric intake
the average Ukrainian slightly exceeds the daily norm,
although this excess is insignificant. In 2017-2018, it
was at the level of 2706 kСal. For comparison, men-
tioned indicator in 2017 in Poland was 3485 kСal per
day, in Hungary – 2968 kCal per day, in Bulgaria –
2877 kCal per day. There is a low level of consumption
of animal products in the diet of the population of
Ukraine (within 29%). Ukrainians receive the bulk of
calories from the consumption of plant products.
0
500
1000
1500
2000
2500
3000
3500
кСal
0
5
10
15
20
25
30
35
%
products of plant origin, kCal 2050 2183 2124 2101 2090 2008 1952 1926 1919
products of animal origin, kCal 611 733 809 868 849 791 790 781 787
The share of animal products in
the diet,%
23 25,1 27,6 29,2 28,9 28,3 28,8 28,9 28,9
2000 2005 2010 2013 2014 2015 2016 2017 2018
Figure 1. The daily energy value of the diet of the population of Ukraine per person in 2000-2018
Source: compiled by authors according to the data of the State Statistics Service of Ukraine [2]
2) Providing the human diet with the main types of
products, that is defined as the ratio between the actual
consumption of an individual product and its rational
norm. According to the data of the State Statistics Ser-
vice of Ukraine, in recent years Ukrainian population
eats uniformly and the energy value of the diet is pro-
vided mainly by carbohydrates and fats due to bread
and bakery products, potatoes, eggs and oil, that is an
evidence of unbalanced nutrition and attempts to pro-
vide for their own energy needs due to relatively afford-
able products. Having calculated the indicator of food
consumption per person in 2018 in Ukraine, it should
be noted that only the consumption of bread and bakery
products practically corresponds to the recommended
norm. For the remaining types of products (except oil
and vegetable fats of all types, the sufficiency ratio of
which is 1.38), there is a significantly lower consump-
tion level comparing to the rational norm. In particular,
the consumption of meat and meat products is 74% of
the norm recommended by the Ministry of Health, milk
and dairy products – 60%, eggs – 79%, fish and fish
products – 84%, sugar – 85%, potatoes – 61%, vegeta-
bles and melon products – 66%, fruits, berries and
grapes – 51% (Table 1) .
The scientific heritage No 47 (2020) 5
Table 1
Calculation of the indicator of sufficiency of food consumption per person per year in Ukraine in 2012-2018
Types of products
Rational norm
(calculated by
the Ministry of
Health of
Ukraine)
Indicator of adequacy of food consumption per person per
year
2012 2013 2014 2015 2016 2017 2018
Meat and meat products, kg 80 0,75 0,77 0,74 0,69 0,68 0,65 0,74
Milk and dairy products, kg 380 0,62 0,64 0,64 0,63 0,62 0,53 0,60
Eggs, pcs. 290 0,83 0,83 0,83 0,79 0,83 0,94 0,79
Fish and fish products, kg 20 1,02 1,08 0,96 0,72 0,72 0,54 0,84
Sugar, kg 38 0,98 0,95 0,95 0,88 0,85 0,80 0,85
Oil and other vegetable fats,
kg
13 1,66 1,57 1,57 1,48 1,38 0,90 1,38
Potatoes, kg 124 0,75 0,69 0,67 0,64 0,62 1,16 0,61
Vegetables and melon prod-
ucts, kg
161 0,75 0,70 0,67 0,66 0,73 0,99 0,66
Fruits, berries, nuts, grapes, kg 900 0,49 0,55 0,49 0,41 0,43 0,59 0,51
Bread and bakery products, kg 101 1,08 1,07 1,07 1,01 0,97 1,0 0,99
Source: compiled by authors according to the data of the State Statistics Service of Ukraine [10]
The analysis of the data in Table 1 allows us to
conclude that the population of Ukraine does not have
the possibility of adequate nutrition in accordance with
the needs of the body for almost all types of food, ex-
cept oil and vegetable fats. This indicates negative
trends and the approximation of food security in this
particular indicator to a critical level. The low level of
food consumption is the consequence not so much of
insufficient agricultural production, as of the low sol-
vency of the population, especially of certain social
groups [8].
3) The sufficiency of grain stocks in state re-
sources, which is defined as the ratio between the vol-
ume of food grain in the state reserve and the volume
of domestic consumption of bread and bakery products
in terms of grain. The ultimate criterion for this indica-
tor is considered to be its 17% level, corresponding to
60 days of consumption. According to the Art. 9 of the
Law of Ukraine “On State Support of Agriculture" [12],
the Agrarian Fund creates a state intervention fund to
ensure food security, which should exceed 20% of the
annual domestic consumption of the product for the
previous marketing period.
As of March 1 2020 in Ukraine, the remnants of
grain and leguminous crops were 17.88 million tons,
which is 14% less than the same date in 2019 (20.83
million tons). In particular, the reserves of wheat at the
beginning of March 2020 were 4.99 million tons, rye -
81.5 thousand tons, barley - 1.58 million tons, corn for
grain - 10.68 million tons, sunflower - 5.27 million
tons.
According to the Ministry of Economic Develop-
ment, Trade and Agriculture, as of March 26 2020, a
total of about 17.9 million tons was exported, about 1
million tons of which was exported in March. Based on
the conditions of the Memorandum on the marginal
volume of grain exports for the 2019/20 marketing
year, the volume of wheat exports until its end will not
exceed 2.3 million tons. In this case, the remnants of
wheat stored by agricultural producers at the end of the
marketing year (July 2020) will be about 1.7 million
tons. Meanwhile, the entire forecasted volume of wheat
use in the domestic market during the 2019/2020 mar-
keting year is 8.23 million tons. Thus, at the end of the
marketing year (i.e. at the time of a new harvest sea-
son), the balance of wheat will be 21% of the total an-
nual demand. This means that Ukraine will have
enough grain for domestic needs, even if demand in-
creases sharply and at the same time there will be crop
failure of wheat.
The integration of Ukraine into the world econ-
omy, in particular in the European space, trade liberal-
ization within the WTO, and the growth of global food
demand have become fundamental factors in the struc-
tural changes in the domestic agri-food market. As a re-
sult, specialization and concentration of crop produc-
tion of export-oriented crops are increasing, including:
wheat (sown area of winter and spring wheat in all cat-
egories of farms in Ukraine in 2019 amounted to 6809.0
thousand hectares, or 24.5% of the total sown area),
corn for grain (respectively 4,973.9 thousand ha or
17.9%), barley (respectively 2615.9 thousand hectares
or 9.4%), sunflower (respectively 5849.3 thousand hec-
tares or 21.0%), soybeans (respectively 1579.6 thou-
sand hectares or 5.7%), rapeseed (respectively 1285.4
thousand hectares or 4.6%) [10].
The comparative advantage of the domestic pro-
duction of these crops is possible due to the presence of
significant areas of fertile agricultural soil, low land
rent, low wages in agriculture, as well as the imperfec-
tion of legislation regarding the use and protection of
land resources. Unfortunately, in many enterprises,
production growth occurs extensively due to an in-
crease in the sown area, in particular, in 2019 compared
with 2018, the area under crops of wheat increased by
2.9%, corn - by 8.6%, barley - by 5.0%, rapeseed - by
23.4%. Moreover, there is an increase in sown areas of
crops that are the most debilitating for the soil, by the
point of crop rotation, while there is a significant reduc-
tion in sugar beet crops in 2019 compared to 2018 by
20.2%, rye – by 21.1%, and buckwheat – by 40.1% and
6 The scientific heritage No 47 (2020)
other cultures that are important to ensure a rational nu-
tritional structure of the country population.
4) The economic food affordability, that is equal to
the share of total food costs in the structure of total
household expenditures. The maximum value of the in-
dicator is 60%. According to figure 2, it can be argued
that the food costs in the structure of population ex-
penditures are less than the normative value of 60%,
while in economically developed countries this indica-
tor is in between 10% to 15%. The food availability is
limited by the solvency of society, which in turn forms
the demand for agricultural products. Due to the low
level of wages of a larger number of the workers, high
unemployment and underemployment, the mismatch
between current prices and real incomes of the popula-
tion, the threat to ensuring food security in Ukraine is
growing [1]. Despite the steady trend towards a de-
crease in the share of household consumer spending on
food and soft drinks in the structure of total expendi-
tures from 56.66% in 2014 to 51.85% in 2018, Ukrain-
ian consumers still spend most of their income on them
and hence the population is considered to be poor.
Prices for food, gas, water, electricity in Ukraine are
approaching European, but the real incomes of average
citizens do not have this trend. A significant increase in
prices of basic foodstuff leads to an increase in house-
hold expenditures, a decrease in economic affordability
and a disruption in the balanced structure of nutrition
and its quality deterioration. The increase in prices of
animal products (meat and meat products, milk and
dairy products) and fruit was the most rapid. The cost
of food for one person in 2018 averaged UAH 57 per
day against UAH 46 in 2016 and UAH 29 in 2012 [3].
In the regional context, the smallest share of food ex-
penses in total consumer spending in the amount of
46.7% was recorded in households in the Zaporizhzhya
region, the highest - in Volyn - 59.2%. The share of
food expenses exceeded the average for Ukraine only
in 12 regions. Thus, we can conclude that the indicator
of economic affordability of food for Ukrainians is not
satisfactory.
56,66 57,16
53,43
51,56
51,85
3,71
3,55
3,11
3,34
3,7
6,55
6,14
6,01
5,92
5,87
2,51
2,15
1,82
2,15
2,28
10,26
12,59
17,17 18,3
16,52
3,93 3,98 4,51 4,09 4,35
3708,8
4600,4
5331,4
6632,5
7643,9
0
1000
2000
3000
4000
5000
6000
7000
8000
0
10
20
30
40
50
60
2014 2015 2016 2017 2018
UAH
%
food and soft drinks
alcoholic beverages, tobacco products
clothes and shoes
household items, household appliances
housing, water supply, electricity, gas
health care
Consumer aggregate expenses on average per month per household, UAH
Figure 2. The structure of total consumer spending of households in Ukraine on average per month in 2014-
2018, %
Source: compiled by authors according to the data of the State Statistics Service of Ukraine [10]
5) Differentiation of the cost of food by social
groups, which is defined as the ratio of food costs of
20% of high-income households to food costs of 20%
of low-income households.
Table 2 shows that in 2018, 20% of the households
with the highest incomes (the highest quintile) spent on
average UAH 5247 per month on food, and 20% of the
households with the lowest incomes (lowest quintile) -
UAH 3134. Based on this, the coefficient of differenti-
ation of the cost of food by social groups was 1.67
against 1.62 in 2017. The greatest differentiation in
consumption within the highest and lowest quintiles
has been preserved for several years for products of an-
imal origin (meat, fish, milk), as well as for the fruit and
berry group (almost 2.1 times). Households that belong
to the first quintile in terms of per capita equivalent in-
come are practically on the verge of food danger, since
the share of their consumer food expenditures ap-
proaches the threshold criterion and amounts to 59.6%.
The scientific heritage No 47 (2020) 7
Table 2
Food consumption in households by quintile group depending on the size of the average per capita equivalent
total income in Ukraine in 2018
Quintile groups
on average per month per person, in terms of the major product, kg
Thecostoffood,UAH/month
Theshareoffoodcostsinconsumer
spending,%
Breadandbakeryproducts
Meatandmeatproducts
Fishandfishproducts
Milkanddairyproducts
Eggs,pcs.
Oilandothervegetablefats
Fruits,berries,nuts,grapes
Vegetablesandmelonproducts
Sugar
Potatoes
First (lowest) 8,1 3,7 1,1 14,8 17,1 1,5 2,7 7,2 2,4 6,1 3134 59,6
Second 5,2 4,4 1,3 17,1 18,6 1,5 3,3 8,1 2,5 6,3 3617 56,5
Third 8,6 4,9 1,3 19,6 19,4 1,5 3,7 9,1 2,8 6,7 4079 54,2
Fourth 8,4 5,4 1,5 20,4 20,6 1,5 4,2 9,5 2,8 6,3 4460 52,8
Fifth (highest) 8,7 6,5 1,8 24,2 21,7 1,6 5,6 11,0 3,1 6,4 5247 49,3
The ratio between
the highest and the
lowest quintiles,
times
1,07 1,76 1,64 1,64 1,27 1,07 2,07 1,53 1,32 1,05 1,67 Х
Source: compiled by authors according to the data of the State Statistics Service of Ukraine [10]
Therefore, the growth of population incomes on
the basis of a general economic recovery and balanced
state social policy aimed at preventing excessive differ-
entiation of population incomes and, accordingly, con-
sumption, are important "non-food" factors in strength-
ening food security.
6) The capacity of the domestic market, which is
calculated in physical terms by product type and is
equal to the product of food consumption and the aver-
age annual population.
The domestic market capacity indicator is an im-
portant component for compiling supply and demand
balances and determining food independence for par-
ticular products. The table below shows the capacity of
the domestic market for certain types of food. Thus, due
to the decrease in the volume of consumption of certain
foods by the population, there is a decrease in the ca-
pacity of the domestic market, as can be seen from the
analysis of table 3. A reduction in the capacity of the
domestic market is observed for such types of food as
potatoes, vegetables and melon products, eggs, fruits,
berries and grapes, bread and bakery products.
Table 3
The capacity of the domestic market of certain products in Ukraine in 2014-2018, thousand tons
Types of products 2014 2015 2016 2014 2018
2018 to 2014
+/- %
Meat and meat products 2447,8 2176,5 2188,8 2191,4 2478,6 30,8 101,26
Milk and dairy products 10080,8 8975,3 8921,5 8477,3 9661,5 -419,3 95,84
Eggs, pcs. 14026,2 11972,7 11370,1 11571,5 9610,9 -4415,3 68,52
Fish and fish products 502,2 367,7 408,8 457,8 708,2 206 141,02
Sugar 1642,4 1526,5 1418,1 1288,5 1365,8 -276,6 83,16
Oil and other vegetable fats 592,7 525,9 498,2 495,9 758,8 166,1 128,02
Potatoes 6379,7 5879,5 5953,3 6078,2 3186,8 -3192,9 49,95
Vegetables and melon
products
7384,1 6875,8 6971,1 6769,1 4502,0 -2882,1 60,97
Fruits, berries, nuts, grapes 2366,4 2176,5 2116,4 2238,0 1922,2 -444,2 81,23
Bread and bakery products 4909,2 4412,8 4301,0 4272,5 4198,5 -710,7 85,52
Source: compiled by authors according to the data of the State Statistics Service of Ukraine [10]
Under conditions of increasing the purchasing
power of the population and food, including public ca-
tering establishments, to the level of European coun-
tries, the capacity of the domestic market can grow up
to 20% [6]. It should also be noted, that in recent years
in Ukraine the production of meat and meat products
(especially cattle), eggs, sugar, potatoes, vegetables is
unprofitable for a great number of agricultural produc-
ers. This means that appropriate measures of state sup-
port for producers and price regulation are needed for
8 The scientific heritage No 47 (2020)
proper nutrition of the population with these types of
food at affordable prices.
7) Food independence for an individual product,
that is equal to the ratio of import volume and domestic
market capacity in physical terms. The maximum limit
criterion is set at 30%.
The satisfaction of the population food needs,
within the limits of their purchasing power, is mainly
ensured by domestic products. At the same time, the
share of imports in 3 food groups traditionally exceeds
the established 30 percent limit criterion for this indi-
cator. The highest level of import dependency - almost
80% - is observed for the group "fish and fish prod-
ucts", since 90% of imports come from species of fish
caught exclusively in the waters of the marine eco-
nomic zones of other states, that is associated with the
peculiarities of their biological cycle. Moreover, it
should be noted that the insufficiently active develop-
ment of domestic fish farming, as well as a growth in
the purchasing power of the population due to an in-
crease in real disposable incomes (for 2018 a “plus” of
9.9%) became factors for an increase in import depend-
ency over the indicated group by 6 percentage points
during the year. Also the 70% of the import of fruit and
berries are exotic fruit that are not grown in Ukraine,
but are in demand and the import of vegetable oil is al-
most entirely related to its tropical species, that are not
produced in Ukraine, but are widely used by domestic
enterprises in the production of food and non-food
products.
Table 4
Calculation of import dependence of Ukraine by food groups in 2018
Types of products
Imports of products in
terms of the main
product, thousand
tons
The volume of
domestic food
consumption
thousand tons
Import dependence, %
2017 2018
2018+/-
2017
Bread and bakery products 176 5610 3,1 3,7 0,6
Meat and meat products 283 2232 12,7 10,6 -2,1
Milk and dairy products 180 8355 2,2 1,6 -0,6
Fish and fish products 394 497 79,3 73,5 -5,8
Eggs, pcs. 4 671 0,6 1,0 0,4
Vegetables and melon products 188 6927 2,7 1,9 -0,8
Fruits, berries, nuts, grapes 878 2445 35,9 36,5 0,6
Potatoes 28 5893 0,5 0,3 -0,2
Sugar 3 1260 0,2 0,5 0,3
Oil and other vegetable fats 238 555 42,9 48,2 5,3
- incl. sunflower oil 1 420 0,2 0,2 0
Source: compiled by authors according to the data of the State Statistics Service of Ukraine [10]
The need to ensure food security requires main-
taining an appropriate level of food self-sufficiency,
provided that effective state support for domestic pro-
ducers of agricultural products and import control are
used to protect the domestic market from competition.
The Ukrainian agricultural market is moderately
protected, but more closed than the industrial market.
The average duty rate (most favored nation treatment)
for agricultural products is 9.2%, while for non-agricul-
tural products it is 3.8%. A higher level of protection is
established for products of animal origin and dairy
products, as well as cereals and sugar. The market of
cotton, coffee and tea, drinks, oils and fats, as well as
vegetables and fruit are less protected. For comparison:
in the EU countries, in particular in Poland and Hun-
gary, the average duty rate for agricultural products is
11.1%, in Belarus – 11.3%. The dynamics of this indi-
cator is largely determined by the strengthening of in-
tegration trends in Ukraine, including the signing of in-
ternational agreements on free trade with 45 countries
of the world, providing for the abolition of trade re-
strictions and duties in mutual trade between countries,
and the intensification of preparation for signing such
agreements with other countries (Turkey, China, Israel)
[11].
In order to assess the state of food security in the
world, The Economist Intelligence Unit with the sup-
port of the global agricultural company Corteva
Agriscience annually prepares and publishes a report
Global Food Security Index (GFSI). GFSI considers the
core issues of affordability, availability, and quality
across a set of 113 countries. The index is a dynamic
quantitative and qualitative benchmarking model, con-
structed from 34 unique indicators, that measures these
drivers of food security across both developing and de-
veloped countries [5]. GFSI 2019 highlights the poten-
tial environmental threat to food security and demon-
strates how appropriate investment and progress in
food innovation can help reduce this risk.
Ukraine slightly improved the overall score com-
pared to last year, but the growth rates of many other
countries were much higher, as a result Ukraine took
76th position in the ranking of 2019. In 2018, Ukraine
ranked 63rd. Moreover, in 2015 Ukraine took 59th
place (56.1 points), in 2014 – 53rd place (57.7 points),
in 2013 - 51st place (57.5 points). As we can see, the
rating of Ukraine is deteriorating every year.
The main strengths identified in the Index for
Ukraine are food safety, a low proportion of the popu-
lation below the global poverty line, minimal changes
in average food expenses and low food losses. Com-
pared to the global average, Ukraine has better indica-
tors in financing food safety programs, the availability
The scientific heritage No 47 (2020) 9
of appropriate storage facilities for crops and the ability
to store food safely. Railway infrastructure, dietary di-
versity, the presence of micronutrients in food and the
percentage of the population with access to drinking
water are also positive indicators. The main challenges
for the country are corruption, political instability, and
insufficient government spending on agricultural re-
search and development, and a lack of food standards.
Compared to the world average, GDP per capita in
Ukraine is very low, as well as poor road and port in-
frastructure. Farmers' access to financing and a very
small share of land equipped for irrigation were also
factors in decreasing the GFSI.
Despite achieving high levels of food quality indi-
cators, there is the problem of antimicrobial resistance
(AMR) through the widespread use of antibiotics in ag-
riculture. This causes a number of negative conse-
quences, as it reduces the effectiveness of the treatment
of many diseases and even leads to death that should be
taken into account in the context of COVID-19. Ac-
cording to experts, by 2050 the annual mortality from
the effects of antimicrobial resistance in the world will
increase to 10 million people / year. In addition, AMR
can cause significant and global health care costs, other
economic and social losses. We should also pay atten-
tion to the trend of increasing use in the processing of
raw materials a significant amount of chemicals and
natural substitutes. The positive effects of their use (in-
creasing shelf life and reducing costs per unit of output)
are offset by a negative impact on consumer health and
deterioration in food security. In addition, the use of
pesticides and other agrochemicals in cultivation crops,
due to their residues in food products, leads to an in-
crease in the level of diseases and, as is observed in
2020, to the mass death of insects, in particular bees, in
many regions Ukraine (Zaporizhzhya, Kirovograd,
Odessa, Vinnytsia, Chernivtsi, Khmelnytsky, Rivne,
Mykolaiv, Ivano-Frankivsk and Poltava regions). A
sharp decline in the bee population leads to a significant
reduction in the production of such useful products for
humans as honey and propolis, and also causes more
global problems – unde-pollination of plants, which in
turn will reduce their yields.
According to the following below Table 5,
Ukraine, having significant agricultural potential, lags
behind both the rating countries and the integral index
components from the reference countries – closest
neighbors and competitors.
Table 5
Positions of individual countries on the Global Food Security Index GFSI-2019
Global ranking
Country
Overall Score Affordability Availability Quality and safety
2019 2018 2019 2018 2019 2018 2019 2018 2019 2018
24 26 Poland 75.6 75.4 81.1 76.4 69.3 75.0 79.5 74.1
34 30 Hungary 72.7 72.8 80.8 75.6 66.1 70.5 70.5 72.0
36 44 Belarus 70.9 65.7 76.0 67.6 62.9 63.4 80.2 67.1
38 38 Romania 70.2 68.9 79.3 67.5 64.3 68.8 64.1 72.6
41 48 Turkey 69.8 64.1 74.7 65.3 64.8 60.9 71.1 70.1
42 42 Russia 69.7 69.0 79.8 70.5 60.1 61.0 70.9 75.2
76 63 Ukraine 57.1 54.1 63.9 55.7 50.0 50.2 59.6 61.0
Source: compiled by authors according to the data of the GFSI-2019 and GFSI-2018 [5]
For the second year in a row, Singapore (84.7),
Ireland (84.0), and the United States (83.7) maintained
their top three positions as food security leaders, de-
spite adding new indicators to the ranking, including
food spending, agricultural infrastructure, and food
standards.
GFSI-2019 shows that almost all countries within
this Index (88%) have sufficient food supply for their
population. However, according to the report of the
Food and Agriculture Organization of the United Na-
tions on the state of food security and nutrition in the
world, more than 820 million people are starving. This
is a widespread problem: more than a third of the coun-
tries evaluated by the GFSI indicate that more than 10%
of their population is undernourished.
Recognizing the growing impact of the global cli-
mate crisis and the depletion of natural resources, the
GFSI also includes “Natural Resources and Sustaina-
bility” as a separate additional category of data in the
other three established dimensions of food security.
When this factor was taken into account in the analysis,
overall score fell in all countries, thus emphasizing the
vulnerability of global food systems to such threats as
drought, floods and rising sea levels. For Ukraine, the
impact was negligible – the position decreased from 76
to 77 places.
Conclusions. The current crisis in the Ukrainian
economy determines the deepening of socio-economic
problems, which in turn lead to deterioration in the food
supply of the population.
The conducted assessment of the state of food se-
curity in Ukraine has detected that the main threats to
food security of the country is the unbalanced con-
sumption of food. Malnutrition is noted in the follow-
ing food groups, such as meat, milk, fish, fruits and ber-
ries. The high differentiation of living standards of the
population by social groups and the economic inacces-
sibility of food due to low and unstable incomes of the
population, the rising of consumer prices for food prod-
ucts at a faster rate than incomes do not allow ensuring
food security at a sufficient level for high-quality and
nutritious nutrition of the population.
In addition to the analyzed problems, there are a
number of other real internal and external threats to the
food security of Ukraine, including declining in food
quality, which is caused, on the one hand, by the desire
of producers to reduce the cost of their product in the
context of inflationary processes and falling solvency
of the population, and on the other hand, the imperfec-
tion of the legislative fields and certification systems,
10 The scientific heritage No 47 (2020)
inconsistency of quality and safety standards; underde-
veloped transport infrastructure, reduces access to re-
mote, especially in rural areas, and their uninterrupted
supply of basic types of food; a high degree of shadow
economy, food smuggling, which poses a threat not
only to the national economy, but also to human health;
lack of competitiveness of domestic agricultural pro-
ducers, deterioration of the material and technical base,
low level of investment and innovative activity of en-
terprises; imperfect financial and tax policy of the gov-
ernment, etc.
To solve these problems and counter threats to
food security, it is necessary to outline and implement
a number of preventive measures of state policy, in par-
ticular: ensuring the balance and efficiency of the do-
mestic agricultural market and its price regulation; pro-
moting the competitiveness of domestic agricultural
producers and protecting their interests in the domestic
and foreign markets; targeted allocation of funds from
the sale of agricultural products to the development of
the agricultural sector, in particular its material and
technical base; modernization of supply infrastructure;
settlement of land issues, completion of the formation
of a system of standardization and certification of prod-
ucts; increasing incomes of the population (in particu-
lar, by creating new jobs, supporting small and me-
dium-sized businesses, subsidizing, expanding nutri-
tion programs for children), which will help to achieve
rational consumption standards; promoting the healthy
nutrition principles among consumers, etc.
The analysis of the level of food security for a
wide range of indicators demonstrated that Ukraine has
all the possibilities not only to ensure food security in
the domestic market, but also to get a significant impact
on its strengthening at the global level. To improve po-
sition of Ukraine in the global food security rating, it is
necessary to focus on creating an effective system of
state regulation of the food market, which would in-
clude the development and implementation of monitor-
ing nutrition of the population, the establishment of a
transparent mechanism for providing state guarantees
of food safety and quality, as well as the implementa-
tion of the Ukrainian legal framework legislation in ac-
cordance with European practice, namely EU regula-
tions in areas of food safety and quality.
Therefore, ensuring the proper level of food secu-
rity requires an integrated approach to the development
and implementation at the national, regional and local
(urban and rural) levels of an effective mechanism,
which will include measures of organizational, eco-
nomic, regulatory, logistical, social and informational
nature.
References
1. Babich, M.M. (2017) Problems of food secu-
rity in Ukraine. AgroSvit, vol. 3, pp. 32 – 39. [in
Ukrainian]
2. Balances and consumption of the main food
products by the population of Ukraine. The statistical
yearbook (2019) State Statistics Service of Ukraine. 58
р. [in English and Ukrainian]
3. Broyaka, A.A. (2017) Current problems of en-
suring food security in Ukraine and their solutions.
Economics. Finances. Law. Vol. 4/2. pp. 52 – 58. [in
Ukrainian]
4. Cabinet of Ministers of Ukraine (2007) Meth-
odology for determining the main indicators of food se-
curity “Some issues of food security”. URL: http://za-
kon2.rada.gov.ua/laws/show/1379-2007-п [in Ukrain-
ian] (accessed 14 May 2020)
5. Global Food Security Index (2019) URL:
https://foodsecurityindex.eiu.com/Index [in English]
(accessed 19 May 2020).
6. Kaletnik, H.M., Kovalenko, O.V. & Broyaka,
A.A. (2017). Current trends of development of the food
industry and its place in the state economy. Ekonomika.
Finansy. Menedzhment: aktualni pytannia nauky i
praktyky – Economy. Finances. Management: topical
issues of science and practical activity, # 8 (24), pp. 7 –
26. [in Ukrainian]
7. Ministry of Economic Development and
Trade и Ukraine (2013) Methodical recommendations
for calculating the level of economic security of
Ukraine. URL: https://za-
kon.rada.gov.ua/rada/show/v1277731-13/stru [in
Ukrainian] (accessed 14 May 2020)
8. Mostova, А. (2019) Current situation of food
security of Ukraine and methodical approaches to its
evaluation. Black sea economic studies. # 43. pp 60 –
68. [in Ukrainian]
9. Sabluk, P.T., Kaletnik, H.M., Kvasha, S.M.
and others. (2011) National Doctrine of Food Security
of Ukraine (project). Ekonomika APK "The Economy
of Agro-Industrial Complex" International Scientific
and Production Journal. # 8. pp. 3 – 11. [in Ukrainian]
10. State Statistics Service of Ukraine. URL:
http://www.ukrstat.gov.ua/ [in English and Ukrainian]
(accessed 14 May 2020)
11. Sychevskiy, M.P. (2019) Global food security
and Ukraine's place in its achievement. Ekonomika
APK "The Economy of Agro-Industrial Complex" In-
ternational Scientific and Production Journal. # 1. pp. 6
– 17. [in Ukrainian]
12. The Verkhovna Rada of Ukraine (2004) The
Law of Ukraine “On state support for agriculture in
Ukraine” # 1877-IV/ revised on February 27, 2020.
URL: https://zakon.rada.gov.ua/laws/show/1877-15 [in
Ukrainian] (accessed 14 May 2020)
The scientific heritage No 47 (2020) 11
КОРРУПЦИЯ КАК ДЕСТРУКТИВНЫЙ ФАКТОР ЭКОНОМИЧЕСКОГО РАЗВИТИЯ
Березюк С.В.
к.э.н., доцент кафедры административного менеджмента
и альтернативных источников энергии,
Винницкий национальный аграрный университет
г. Винница, Украина
Яремчук Н.В.
к.э.н., старший преподаватель кафедры административного менеджмента
и альтернативных источников энергии,
Винницкий национальный аграрный университет
г. Винница, Украина
CORRUPTION AS A DESTRUCTIVE FACTOR OF ECONOMIC DEVELOPMENT
Bereziuk S.
Candidate of Economic Sciences,
Associate Professor of the Administrative Management
and Alternative Energy Sources Department,
Vinnytsia National Agrarian University
Vinnytsia, Ukraine
Yaremchuk N.
Candidate of Economic Sciences,
Senior lecturer of the Administrative Management and Alternative
Energy Sources Department,
Vinnytsia National Agrarian University
Vinnytsia, Ukraine
Аннотация
В статье акцентировано внимание на отрицательном воздействии «института коррупции» на функци-
онирования экономического механизма и его разрушительное влияние на социально-политический кли-
мат.
Проанализировано дефиницию понятия «коррупция», а также отдельные аспекты ведущие к её воз-
никновению и развитию.
Подчёркнута прямая связь уровня тенизации государственного сектора экономики и «градуса» кор-
рупционного климата в стране. Названы основные причины перехода экономической деятельности субъ-
ектов хозяйствования в тень, в частности, несовершенство законодательной базы, коррупционная деятель-
ность в системе органов государственного управления, искаженное восприятие идеологии гражданами
страны и снижение уровня ценностно-ориентационных норм.
Определено, что наиболее коррумпированным сектором остается сектор государственной собствен-
ности, в которой процесс приватизации госпредприятий целенаправленно притормаживался управленче-
скими структурами в коррупционных целях.
Также раскрывается вопрос об организации процесса государственных закупок на основании новов-
веденной платформы Prozorro.
На рассмотрение выносятся результаты деятельности Национального антикоррупционного бюро
Украины как правоохранительного органа имеющего широкие силовые полномочия предупреждения, вы-
явления, прекращения и разрытия коррупционных преступлений. Поддерживается теория гиппотетиче-
ской зависимости роста ВВП от уровня Индекса восприятия коррупции.
Предложено комплекс мер, выполнение которых даст вероятность снизить уровень коррупции в гос-
ударстве.
Abstract
The article focuses on the negative impact of the "corruption institute" on the functioning of the economic
mechanism and its destructive impact on the socio-political climate.
The definition of the concept of "corruption" is analysed as well as separate aspects leading to its appearance
and development.
A direct connection between the level of shadowing of the public sector of economy and the «degree» of
corruption climate in the country is emphasised. The main reasons for the transition of economic activity of enter-
prises to the shadow, in particular, imperfection of the legislative base, corruption in the system of state admin-
istration, distorted perception of ideology by citizens of the country and reduction of the level of value and orien-
tation norms are mentioned.
It has been determined that the most corrupted sector remains the state property sector, where the process of
privatisation of state enterprises was purposefully slowed down by management structures for corrupt purposes.
The issue of organization of the public procurement process on the basis of the new Prozorro platform is also
12 The scientific heritage No 47 (2020)
disclosed.
The results of activities of the National Anti-Corruption Bureau of Ukraine as a law enforcement agency with
broad power to prevent, detect, stop and break up corruption crimes are submitted for consideration. The theory
of hypothetical dependence of GDP growth on the Corruption Perceptions Index is supported.
A set of measures has been proposed, the implementation of which will make it possible to reduce the level
of corruption in the state.
Ключевые слова: коррупция, приватизация, индекс воспрятия коррупции, тенизация економики, гос-
ударственные закупки.
Keywords: corruption, privatization, anti-corruption index, shadow economy, public procurement.
Formulation of the problem. In Ukraine, the
level of Corruption is quite high and it neutralizes a sig-
nificant amount of internal resources. This is the re-
source that is redistributed through corrupt rent and
which is actually withdrawn from our national product,
which actually makes the Ukrainians one of the poorest
nations in Europe. The experience of many countries in
the world shows that traditional attempts to suppress
corruption only through strict law enforcement
measures do not yield positive results. This situation is
explained by the fact that corruption measures are im-
plemented under the influence of super active factors
motivating human behavior - power and wealth. When
analyzing corruption on a societal scale, we conclude
that it is economically motivated. The main motive of
a corrupt person is the desire to take possession of ad-
ditional material wealth. And a ban on corrupt actions
also has its price.
The negative impact of corruption on the eco-
nomic sphere is primarily manifested in the increase in
the value of commercial contracts and, as a conse-
quence, leads to a similar increase in prices for goods
and services. Therefore, the population of a country
with a high level of corruption will never achieve a de-
cent level of welfare, even if the economy is suffi-
ciently modernised and developed.
Presenting main material. Corruption is a com-
plex phenomenon of today's social reality. Penetrating
into almost all spheres of society, this destructive "in-
stitution" entails the destruction of social ideals, eco-
nomic mechanisms, the legal environment. For a long
time, we have witnessed how our government distorts
the state system in its own interests. The causes of
corruption are diverse and complex, but the main one
is the inability of the authorities to resist this destabi-
lizing phenomenon, which from year to year blurs the
boundaries between public and private interests.
According to the results of a nationwide survey
of the population of Ukraine, 91% of citizens consider
corruption a serious problem, and 61% of respondents
are convinced that it is the most serious problem that
hinders the development of the country. Only 4% of
respondents admit that the problem of corruption ex-
ists, but it is not too serious, and 0.5% consider this
problem far-fetched. During the year, compared to
2017, awareness of the seriousness of the problem of
corruption has grown significantly: in September
2017, 44% considered corruption to be the most seri-
ous problem, now - 61%; not too serious in 2017 -
12%, today - 4% (Fig.1).
According to citizens, the main reason for the lack
of positive changes in the fight against corruption is that
those who have to fight it are themselves corrupt. Other
important reasons: corruption usually goes unpunished
(38%), the lack of a "strong hand" that would bring or-
der to society (31%), and the imperfection of laws that
can be interpreted in any way (28%).
Respondents were divided on whether corruption
could be considered a manifestation of the Ukrainian
mentality. 38% believe that corruption is part of the
mentality, and 46% - that it is not. At the same time, the
younger the respondents, the more often they called
corruption a manifestation of the mentality of Ukraini-
ans. This question arose in 2001, when corruption was
considered a manifestation of the Ukrainian mentality
much less - 26% [5].
The scientific heritage No 47 (2020) 13
Fig.1. Problems that, in the opinion of the citizens of Ukraine, hinder the development of the state mostly as of
08.01.2018
* It was possible to choose several (not more than 3) answer options at once
Source: [20]
Regarding the definition of "corruption", in prac-
tice there are two main approaches to the formation of
this scientific concept. The first is doctrinal, based on
research by scientists and specialists in a particular
field. The second is official, legal, based on regulations,
international documents and other sources that have le-
gal force [19].
According to the first approach, the analysis of
modern scientific literature demonstrates a significant
number of definitions of corruption, summarizing
which, we can say that the understanding of corruption
depends on the angle from which it is trying to explore
experts in various fields of science. Thus, from the
point of view of economics, the generalized position of
scholars who have studied the concept of corruption
within economic theory is defined as follows: corrup-
tion is the sale of public property by civil servants for
private purposes, which is not just a function of re-
sources spent on surveillance and prosecution. function
of relations between the state and the private sector
[19].
Also, one of the most successful is the interpreta-
tion of the concept of "corruption" by a domestic scien-
tist M.I. Melnyk, who believes that “corruption is a so-
cial phenomenon that covers a set of corrupt acts related
to the misuse by persons authorized to perform the
functions of the state, the power given to them, official
powers, appropriate opportunities to satisfy personal
interests or the interests of third parties » [17].
The Code of Conduct for Officials, adopted by the
UN General Assembly on December 17, 1979, defines
corruption as "... the commission of certain acts in the
performance of duties, or in connection with these du-
ties as a result of gifts, promises or incentives, or their
illegal receipt whenever there is such an act or omis-
sion. " This definition reflects not only the receipt of
material values by an official, but also his official be-
havior [///] In the Ukrainian legal dictionary-reference,
corruption is interpreted as one of the forms of abuse of
power, which is associated with bribery of officials
[Corruption. Legal dictionary-reference book [4].
The Law of Ukraine “On Prevention of Corrup-
tion” [Law] defines the term corruption as the use by a
person of official powers or related opportunities for
the purpose of obtaining an illegal benefit or accepting
a promise / offer of such benefit for himself or others,
respectively promise / offer or providing an improper
benefit to a person, or at the request of another person
in order to persuade that person to misuse the official
powers granted to him or her [6].
The world community perceives Ukraine not just
as a country with a high level of "corruption climate",
but as a country where the "institution of corruption" is
an integral part of economic and socio-political life.
Transparency International provides the results of
its own research, which demonstrates the following sit-
uation. 30 points out of 100 possible - the result of the
Corruption Perceptions Index in 2019 for Ukraine. The
country returned to the level of 2017 and now ranks
126th out of 180 countries. Next in the ranking - Kyr-
gyzstan, Azerbaijan and Djibouti. Among its neigh-
bors, Ukraine is ahead of Russia, which has maintained
its position (28 points, 137th place). Poland (58 points,
41st place) and Slovakia (50 points, 59th place) are ex-
pected to lead the neighbors. Belarus added one point
and now has 45 points and 66th place. Also, this year
we see a decrease in the index of neighbors: Romania -
minus 3 points, Hungary - by 2, Moldova by 1 [11].
The need to determine the preconditions of corrup-
tion is due to the fact that corruption as a social phe-
nomenon is a product of socio-historical processes and
social relations with established patterns and trends.
78,9
55,1
32,3
30,2
16,5
12
7,3
6,9
6,5
6,1
3,3
0,9
0 50
corruption
war in the Donbass
oligarchs in economics
lack of professionals in power
populism of politicians
migration, departure of the working population
lack of significant investment in the economy
rupture of relations with Russia, orientation to…
passivity of citizens
external management
difficult to tell
other
14 The scientific heritage No 47 (2020)
That is why identifying the causes of corruption is so
important in the process of combating it (Fig.2).
Fig.2. Types of corruption and their interpretation
Source: [3]
Historically, the source of corruption has been ex-
cessive state interference in the economy, through
abuse of power, the creation of excessive bureaucra-
cies, which were not needed at the appropriate stage of
reforming the economic system, "hints" to entrepre-
neurs to solve business issues outside the legal sphere
(Table 1). Excessive change of government during the
years of independence has led to the formation in the
minds of public officials of an understanding of the
short term of office and the desire to use their official
position for material gain.
Table 1
Causes of corruption
Political
(use of powers to satisfy private
interests)
- low level of legal culture of society
- excessive and active state intervention in the economy and private life of
citizens
- non-transparency of the public administration system, development and
decision-making processes at the national, regional and local levels
Economic
(use of civil servants' own pow-
ers in the field of economic man-
agement)
- instability of the country's economy
- underdevelopment of the monetary and financial system
- lack of transparent mechanisms for privatization and tendering for public
procurement
- unfavorable investment climate.
Legal
(inefficient system of anti-cor-
ruption tools and imperfect anti-
corruption legislation)
- uneffective mechanism for counteracting the abuse of bureaucracy
- ignorance or misunderstanding of laws by the population
- Insufficient settlement of liability for various acts of corruption
- gaps, ambiguity and vagueness of legislation
- imperfection of the system of declaring incomes of civil servants
Organizational and managerial - the ability of officials to make decisions at their discretion
- total occupation of public posts with the help of personal relationships
Socio-psychological (low civic
consciousness; a mentality that is
distorted by the awareness of the
possibility of solving any issue
without undue effort and loss of
time)
- weakness of civil society
- low wages
- lack of career prospects in the presence of professional achievements
- low level of management culture
- unclear organization of control and imperfection of decision-making pro-
cedures and reporting on the work performed
Corruption is often associated not only with the
misapplication of legislation, it can distort the legisla-
tive process itself, when the preparation and adoption
of regulations is reduced to meet their own business in-
terests, rather than public needs.
By destroying state foundations from within, cor-
ruption reproduces on a larger scale the real threats to
the civilizational prospects of Ukrainian statehood. The
aggressiveness of corruption is manifested in its insti-
Petty corruption
– it is the daily abuse by middle- and lower-level government offi-
cials of the government entrusted to them in dealing with ordinary
citizens seeking access to basic services provided by the state in
health care, education, police stations, and other government agen-
cies.
Grand corruption
– these are actions committed at the central level of public admin-
istration that distort the policy or mode of functioning of central
public authorities, which allows senior officials to receive remuner-
ation for the public good.
Political corruption
– it is the manipulation of policies, institutions and regulations
(rules, procedures) by officials who make political decisions on the
allocation of resources and funding, who use their positions in order
to maintain their powers, status and financial status
The scientific heritage No 47 (2020) 15
tutional expansion. Having the power of internal stabil-
ity, latent and creeping nature, corruption distorts the
mechanisms of social influence, distorts the content of
law and morality, replaces the main goals of public ad-
ministration, distorts the paths of economic develop-
ment. As a result, corruption from private criminal
practice becomes a systemic problem, characterized by
the formation of stable corrupt segments of the econ-
omy, in which the political will of the state is actually
subordinated to the interests of oligarchic groups [23].
The current situation stabilizes the public opinion
that the state, as a socio-economic institution, has be-
come a hostage of a vicious circle of events, when in-
creased corruption activity strengthens the segment of
"poverty", and the latter, in turn, becomes successful.
bridgehead "further development of corruption.
Corruption is a macro-critical phenomenon, one of
the main problems of our time, because the annual
losses of the world economy from bribes, according to
the International Monetary Fund, are about $ 1.5-2.0
trillion, or 2% of world GDP [12].
Corruption contributes to the shadowing of the
public sector of the economy, which in turn is mani-
fested in the uncontrolled production, exchange and
consumption of goods and services, as a result, the state
budget is short of tax revenues.
Ukraine has traditionally been characterized by a
high level of shadow economy. The main reasons for
the transition of the economy to the "shadow" are:
- imperfection of legislation, especially tax. These
include excessive tax pressure (inflated tax rates and /
or excessive taxes), confusing (non-transparent) tax ad-
ministration mechanisms, unfair provision of tax bene-
fits to businessmen close to the government, etc .;
- corruption in the public administration system.
Corruption is an anti-social phenomenon, the essence
of which is the commercialization of public officials by
their functional responsibilities;
- purely human weekness (greed, legal ignorance,
etc.).
Fig.3. The level of the shadow economy in Ukraine (% of GDP), by sector
Source: [18]
According to the calculations of the Ministry of
Economic Development, the level of the shadow econ-
omy in 2018 amounted to 30% of official GDP, which
is 2 percentage points less than in 2017 and is the low-
est level since 2009 (Fig. 3). Given that the de-shadow-
ing of the economy is considered by experts as one of
the measures of the effectiveness of the implemented
reforms and their perception by society, this result de-
serves attention. In 2014, the level of the shadow econ-
omy was 43% of official GDP (Figure 4).
46,8
43,6
44,3
52,9
47,5
53,4
43,5
47,2
46,3
43,6
50,2
48,1
51,8
44,7
0 10 20 30 40 50 60
all sectors
processing industry
wholesaling
retailing
services
building
others
2018
2017
16 The scientific heritage No 47 (2020)
Fig.4. Integral indicator of the level of the shadow economy of Ukraine (in% of the volume of official GDP) and
growth rates / decrease of the level of real GDP (in % to the previous year)
Source: [12]
One of the main threats posed by the shadow
economy to the economic system is the distortion of the
mechanisms of laws and market instruments, which
leads to the ineffectiveness of mechanisms to stimulate
the economy, hindering the economic development of
the country. Therefore, the government's efforts should
focus, first of all, on the implementation of measures
aimed at minimizing the impact of systemic factors of
shadowing of the economy, which remain relevant,
namely:
- low efficiency of the state in providing the
institutional basis for the development of a competitive
economy; according to the Global Competitiveness
Index (GIC) Report 2018, the efficiency of state and
public institutions (“Institutions”) remains one of the
biggest competitive “failures” of Ukraine's economy
(110th among 140 countries). The low position in the
ranking according to this sub-index indicates that the
administrative and legal conditions in which businesses
operate remain unfavorable due to the persistently high
level of corruption, lack of an effective judicial system
and proper protection of property rights;
- high level of corruption;
- low efficiency of the judicial system. The level
of independence of the judiciary and the level of
efficiency of the legal system in arbitration are assessed
by international experts as low (117th and 103rd places
in the 2018 HIC ranking, respectively).
- insufficient protection of rights to movable and
immovable property, including rights to financial
assets. According to the GIC 2018 rating, Ukraine
ranks 129th in terms of protection of property rights and
114th in terms of protection of intellectual property
rights.
One of the most corrupt areas remains state
ownership. Today, the public sector has 3,733 state-
owned enterprises. The fact that the country is not able
to control the efficiency, expediency, and in general the
economic activity of the latter seems absolutely
expected. That is why the process of privatization on
time is a necessary precondition for the state to emerge
from economic stagnation. Obtaining funds from
privatization is not a priority, because in fact, a single
infusion of financial resources into the state budget is
not a panacea and does not solve the dilemma of
economic growth. The main objectives of the
privatization process should be to attract investment
capital and, as a consequence, the possibility of
modernization of production facilities, job creation and
competitive products.
The stock market of Ukraine in 2018 jumped by
more than 80% and became the best in the world
ranking in terms of key index, which since 1997 is
calculated by one of the two largest domestic
exchanges FFTS (First Stock Trading System). Index
data clearly reflects and responds instantly to any
market fluctuations, both positive and negative. The
FFTS index as an indicator of economic security of
securities traders most fully reflects the essence and
trends of the Ukrainian stock market (Fig.5).
38
34 34 35
43
40
35
32
30
4,1 5,5
0,2 0
-6,6
-9,8
2,4 2,5 3,3
-10
0
10
20
30
40
50
2010 2011 2012 2013 2014 2015 2016 2017 2018
the level of the shadow economy of Ukraine (in% of the volume of official GDP)
growth rates / decrease of the level of real GDP , in % to the previous year
The scientific heritage No 47 (2020) 17
Fig.5. FFTS index value (Ukraine)
Source: [12]
The current “plus” of tens of percent means that
the demand for securities on the market was extremely
high, and they rose sharply in price after a period of
deep decline in 2015-2016. Although in general, the
volume of the Ukrainian stock market worldwide
remains tiny and explanation Such a significant
increase lies in the low base of comparison, but despite
this, the dynamics of the index eloquently gives a
positive signal to investors as potential owners of
privatized objects [21].
However, despite the urgency of the issue, the
privatization process was deliberately delayed due to a
number of factors:
- unreliability and imperfection of the domestic
institutional environment, which creates the
unattractiveness of privatization objects for foreign
investors;
- imperfection of the regulatory framework for
regulating the privatization process;
- inconsistent policies and lack of long-term plans;
- deliberate delay in the privatization of state-
owned objects in order to maintain control over them
and, as a result, maximize the debts of enterprises,
which entails the loss of their potential economic
attractiveness.
Annual allocation of billions of hryvnias from
privatization to the State Budget is a risky issue and
does not correspond to the qualitative assessment of
budget revenues, as the privatization plan is being
implemented only by 2-4% (Fig. 6) [24].
Fig. 6. Dynamics of privatization in Ukraine, million USD
Source: SPF
369,51
349,04
301,49
243,01
229,31
223,30
239,78
265,67
272,06
286,19
294,16
315,74
358,47
463,95
538,17
552,27
563,51
548,63
524,85
509,65
504,50
0,00
100,00
200,00
300,00
400,00
500,00
600,00
01.05.2015
01.08.2015
01.11.2015
01.02.2016
01.05.2016
01.08.2016
01.11.2016
01.02.2017
01.05.2017
01.08.2017
01.11.2017
01.02.2018
01.05.2018
01.08.2018
01.11.2018
01.02.2019
01.05.2019
01.08.2019
01.11.2019
01.02.2020
0
473
1061
593
376
962
1349
416
2097
115
1091
800
1255 1251
1364 1430
778 669 643
4
381 397
108
378
1770
4039
104
487
91 104 138
1441
853
185
39 7 7 115
0
500
1000
1500
2000
2500
3000
3500
4000
4500
1992-1999
2000
2001
2002
2003
2004
2005
2006
2007
2008
2009
2010
2011
2012
2013
2014
2015
2016
2017
plan
fact
18 The scientific heritage No 47 (2020)
A positive step was the repeal by Parliament of a
list of laws banning the privatization of more than a
thousand enterprises. 9% of all state-owned enterprises
(over 400 objects) have already been transferred to the
State Property Fund of Ukraine. In general, the
Program of Activities of the Cabinet of Ministers
announces a reduction of the share of state ownership
in the economy to 5%. The development of ownership
policy with a clear definition of the purpose of state
ownership and key performance indicators for all state-
owned enterprises is announced. [Draft Resolution on
the Program of Activities of the Cabinet of Ministers of
Ukraine] [13].
Of course, corruption can also exist in private
enterprises, but then it will cease to be a problem of
citizens who are the "holders" of the State budget.
On August 1, 2016, the Prozorro system came into
force, which became mandatory for all purchases in the
country. The system was designed to provide open
access to information, open up the public procurement
market to suppliers and launch transparent online
auctions to reduce prices, which will save public money
[14].
Speaking about the effectiveness of this system,
attention is focused on its effectiveness in improving
the efficiency of public procurement and reducing
corruption schemes in this sector. But still, there is a
question about possible cases of corrupt practices.
Cooperation with the customer is necessary for
most illegal procurements. By implementing the
conspiracy plan, the customer may formulate a tender
in such a way as to minimize competition for the bidder,
providing a unique size, color, brand or composition of
products, which, respectively, will know only a
predetermined contractor. In addition, the customer
may announce the bidding on such a date that the bidder
could not physically collect the necessary certificates,
quality certificates, etc. before the start of the bidding.
Accordingly, the desired winner of the tender will be
notified in advance of the need to collect certificates.
Another effective workaround for the customer is to
hide the tender in the electronic tender system so that
potential bidders cannot find it and submit their bids.
At the same time, "trusted" suppliers, of course, learn
about everything in time.
Of course, the above agreed actions of the bidder
and the customer harm competition and violate the
rights of bona fide bidders. In addition, they lead to a
waste of budget funds in huge amounts [2].
Therefore, the ProZorro system gave hope for
open work in public procurement and clearly
minimized the risks, but corruption in public
procurement wasn`t fully overcome. The issue of
impunity for violating the law remains problematic,
because as soon as the subject of the appeal applies to
the authorized body with the recorded violations of the
public procurement process, the customer cancels the
tender offer and announces it again.
In the Strategy of Sustainable Development
"Ukraine-2020" the main goal of anti-corruption
reform contains two components of corruption in
Ukraine, reducing losses of the state budget and
business due to corruption, as well as increasing
Ukraine's position in international rankings assessing
the level of corruption [15].
The constant pursuit of corruption is pushing for
radical steps to eradicate this negative phenomenon by
creating new bodies to combat it. The National Anti-
Corruption Bureau of Ukraine (NABU) was established
on the basis of the Law of Ukraine “On the National
Anti-Corruption Bureau of Ukraine” of October 14,
2014 [7].
According to the NABU Law, it is a state law
enforcement body that is responsible for preventing,
detecting, terminating, investigating and disclosing
corruption offenses within its jurisdiction, as well as
preventing the commission of new ones. The purpose
of this body is to combat criminal corruption offenses
committed by senior officials authorized to perform the
functions of state or local self-government, and pose a
threat to national security.
According to the Law of Ukraine "On
Amendments to Certain Legislative Acts of Ukraine on
Ensuring the Activities of the National Anti-Corruption
Bureau of Ukraine and the National Agency for
Prevention of Corruption" amendments to the Law of
Ukraine “On the Prosecutor's Office”. Pursuant to the
above-mentioned Law, the Specialized Anti-
Corruption Prosecutor's Office (CAP) is established in
the Prosecutor General's Office of Ukraine (as a
structural subdivision), in which the prosecutor, as a
specially authorized anti-corruption entity, is
empowered to make inquiries. and the conditions that
contributed to the commission of corruption-related
offenses [8] in September 2019, the Supreme Anti-
Corruption Court has started its work, to which all
NABU cases will be transferred. The creation of a court
to hear the country's top corrupt officials was a
requirement of Western partners and the IMF.
Avoiding “elite corruption” (corruption of high-
ranking officials), purposeful work to expose corrup-
tion offenses was often replaced by drawing up a sig-
nificant number of protocols on ordinary officials - civil
servants of 6-7 categories, who committed minor mis-
demeanors that only formally fell under the signs of
corruption. socially dangerous [6].
The National Bureau has proved that positions do
not save from responsibility. This confirms the fact that
during the reporting period, under the procedural guid-
ance of SAP prosecutors, detectives reported the suspi-
cion to 17 top-level government officials. Among them:
an employee of the Office of the President of Ukraine,
a minister, several deputy ministers (at the time of no-
tification of suspicion), a number of former deputies of
Ukraine, former First Deputy Secretary of the National
Security and Defense Council, NAPC ex-head, former
First Deputy Head of the State Migration Service of
Ukraine, incumbent . These persons are mostly accused
of abuse of office, harm to state interests, declaration of
unreliable information. Perhaps the largest society was
outraged by the actions of three people's deputies (now
- ex), who illegally received compensation from the
budget for rent. Also among the "leaders" brought to
justice - middle-ranking public officers, law enforce-
ment officers, heads of state enterprises. In total, in the
second half of 2019, the status of suspects in the NABU
The scientific heritage No 47 (2020) 19
and SAP cases was granted to 84 people, including
many directors of state-owned enterprises [10].
Corruption in state-owned enterprises has been the
focus of NABU detectives since the very beginning of
the institution's activities. In 2018, the work started in
December 2015 brings results: the investigation of
corruption schemes at a number of state-owned
enterprises has been completed, organizers and
participants have been identified. In total, in the second
half of last year, 61 people became accused in the
NABU and SAP investigations. Due to their illegal
activities, the state interests were damaged in the
amount of more than 2.7 billion hryvnias. In the
reporting period, the investigation of corruption at
unique enterprises of the transport industry (SE
"Seaports Administration of Ukraine", PJSC "Sea
Trident", PJSC "Ukrzaliznytsia"), chemical industry
(PJSC "United Mining and Chemical Company"),
energy (JSC "Kharkivoblenergo"), etc. Sufficient
evidence has been gathered to draw up and send
indictments to court. As a result, the National Bureau,
as a pre-trial investigation body, has fulfilled its
mission. Then - the word of the court, which must
determine the degree of guilt of persons and sentence
them to crimes. The NABU court ruling is an important
precondition for compensating the state for corruption.
After all, under these conditions, the confiscation of
property seized during the pre-trial investigation
becomes a reality. There are hundreds of plots of land
and real estate, vehicles and more. The total value of
these assets reaches over UAH 9 billion, of which about
UAH 0.5 billion is in criminal proceedings in which an
indictment has been drawn up [10]. (Fig. 7).
Fig.7. Performance results NABU
Source: [10]
The economy is a dynamic system that is con-
stantly changing under the influence of certain factors.
That is why for positive and qualitative dynamics it is
necessary to minimize the impact of destabilizing
factors.
Economic growth is the response of the economic
system to positive influences and the transition to a
higher stage of evolution. One of the main indicators of
economic growth is the growth of absolute and relative
indicators of real GDP. That is, a growing economy
produces more and more goods and more services. This
process is accompanied by the strengthening of the
competitive advantages of the national economy on the
world stage.
In a study by the Office of Financial and Economic
Analysis in the Verkhovna Rada of Ukraine (OFEA) to
obtain an empirical assessment of the impact of
corruption on economic growth, an empirical analysis
of a sample of 145 countries analyzed data on two
indicators: corruption perception index and GDP per
capita (Fig.8).
In the world during the relevant period there was
a direct relationship between CPI and GDP per capita -
the higher the level of corruption, the lower the GDP.
87,1
153,3
213,2
220,02
8,28
10,18
0,14 0,25
0,01
0,45 0,17 0,27
0,01
0,1
1
10
100
1000
first half of
2017
Second half of
2017
first half of 2018 Second half of
2018
first half of 2019 Second half of
2019
losses reimbursement
20 The scientific heritage No 47 (2020)
Fig.8. Correlation between GDP per person and the value of the CPI in the EU, 2019
Source: [22]
The study of the impact of corruption on GDP per
person clearly shows the regional differences between
countries. A similar situation is observed when
assessing the interdependence between the level of
corruption and two indicators such as life expectancy
and literacy.
It is quite difficult to overthrow the corrupt elite
and oligarchs from the top of the pyramid. However, it
is possible to put an end to the destructive relationship
between government, wealth and corruption by
outlining the requirements of high standards of
government accountability and an independent
judiciary.
Corruption contributes to the following
phenomena, which have a destructive burden on
economic growth and, consequently, on economic
development:
⁃ loss of trust of economic entities and citizens in
government structures;
⁃ growth of the shadow economy sector, which
contributes to the shortfall of the state budget in tax
revenues;
⁃ irrational use of budget funds in the current state
budget deficit;
⁃ loss of potential investors due to the inverse
proportionality of the level of corruption to the level of
attractiveness of the investment climate;
⁃ non-fulfillment by the state, as an institution of
the political system of society, of the functions assigned
to it in full;
⁃ distortion of property relations and fair
distribution and redistribution of resources in society,
which creates social inequality;
⁃ negative impact on strategically important
sectors of the economy such as medicine and education.
Conclusions and suggestions. Not to fight cor-
ruption means to support it, but given the devastating
consequences of such inaction in all spheres of society,
the problem of counteracting this "enemy" is in any
state. First of all, it is necessary to understand that anti-
corruption reforms are not just a process of concluding
corrupt officials, because the latter will not change the
system at all. This is a view into the "root" of the prob-
lem, which defines corruption as an acceptable norm,
but as the basis for the formation of social, political and
economic order.
Given the above, a number of measures are pro-
posed to overcome corruption:
- limiting the opportunities for hidden government
actions by demonopolizing the country's politics and
economy;
- the active support of civil society by programmes
for local authorities aimed at reducing the risks of cor-
ruption that arise during the decentralization reform;
- enhancing the virtue, independence and profes-
sionalism of the judicial system;
- speeding up the process of privatization, reforms
of state-owned enterprises and developing a procedure
for the verification of relevant draft laws to attract anti-
monopoly assessment to prevent damage to competi-
tion for discriminatory norms.
References
1. Corruption: Costs and Mitigating Strategies.
2016. May. URL:
https://www.imf.org/external/pubs/ft/sdn/2016/sdn160
5.pdf.
2. Ili vse prozrachno v ProZorro? [Is everything
transparent in ProZorro?] URL: https://yur-
gazeta.com/publications/practice/inshe/chi-vse-
prozoro-u-prozorro.html.
3. Karpenko M., Pashkovskij V. Sovremenny`e
priznaki korrupczionnoj prestupnosti i ikh soderzhanie.
[Karpenko M., Pashkovsky V. Modern signs of corrup-
tion crime and their content]. Yuridicheskaya nauka.
2013. Vol 5. Pp. 54-61. [Law science. 2013. Vol 5. Pp.
54-61].
4. Korrupcziya. Yuridicheskij slovar`-
spravochnik. [Corruption. Legal Dictionary]. URL:
0
10000
20000
30000
40000
50000
60000
70000
80000
90000
0 20 40 60 80 100
GDPperperson,$
ІСК
The scientific heritage No 47 (2020) 21
http://subject.com.ua/pravo/dict/564.html.
5. Ocenka problematiki korrupcii v
obshhestvennom mnenii. [Evaluation of the proboemat-
ics of corruption in public opinion]. URL:
https://dif.org.ua/article/otsinka-problematiki-koruptsii-
v-gromads?fbclid=
IwAR0J_erwk9Jotr2WVQhqT5Cl1d6bjXqzHykuApc5
gIgBcO4OOnib2U1re
6. O predotvrashhenii korrupczii: Zakon
Ukrainy` ot 14.10.2014, № 1700-VII. [Law of Ukraine
“On the Prevention of Corruption from 14.10.2014]
URL: https://zakon.rada.gov.ua/laws/show/1700-
18/stru#Stru.
7. O Nacionalnom antikorrupcionnom byuro
Ukrainy: Zakon Ukrainy ot 14.10.2014 № 1698- VII.
[About National Anti-Corruption Bureau of Ukraine:
The Law of Ukraine from 14.10.2014 № 1698- VII].
URL: https://zakon.rada.gov.ua/laws/ show/2447-1].
8. O vnesenii izmenenij v nekotorye
zakonodatelnye akty Ukrainy otnositelno
obespecheniya deyatelnosti Nacionalnogo
antikorrupcionnogo byuro Ukrainy i Nacionalnogo
agentstva po voprosam predotvrasheniya korrupcii:
Zakon Ukrainy ot 12.02.2015 № 198-VII. [About
amendments to certain legislative acts of Ukraine re-
garding the operation of the National Anti-Corruption
Bureau of Ukraine and the National Agency for the Pre-
vention of Corruption: Law of Ukraine from
12.02.2015 № 198-VII]. URL:
https://zakon.rada.gov.ua/laws/show/198- 19.
9. Official website of the Ministry of Justice of
Ukraine. URL: https://minjust.gov.ua/m/str_7094.
10. Official website of the National Anti-
Corruption Bureau of Ukraine. URL:
https://nabu.gov.ua/reports.
11. Official Website Transparensy International
Ukraine. URL: https://ti-ukraine.org/research/indeks-
spryjnyattya-koruptsiyi-2019/.
12. Official website of the Ministry of Finance of
Ukraine. URL:
https://index.minfin.com.ua/markets/stock/pfts/.
13. Proekt postanovleniya o programme
deyatelnosti Kabineta Ministrov Ukrainy. [Draft decree
on the programme of activities of the Cabinet of Min-
isters of Ukraine]. URL:
http://w1.c1.rada.gov.ua/pls/zweb2/webproc4_1?pf35
11=66959
14. Poedinok Prozorro s korrupciej. [Prozorro's
fight with corruption.] URL:
https://www.epravda.com.ua/columns/2020/03/23/658
092/
15. Polozhenie o strategii ustojchivogo razvitiya
«Ukraina-2020»: Ukaz Prezidenta Ukrainy ot
12.01.2015 № 5/2015. [Regulation on the Sustainable
Development Strategy "Ukraine 2020": Presidential
Decree from 12.01.2015 № 5/2015]. URL:
https://zakon.rada.gov.ua/laws/show/5/2015.
16. Pro prokuraturu: Zakon Ukraini ot 14.10.2014
№ 1697-VII. [About the Prosecutor's Office: Law of
Ukraine from 14.10.2014 № 1697-VII]. URL:
https://zakon.rada.gov.ua/laws/ show/1697-18.
17. Solovyov V. «By`tovaya korrupcziya»:
sushhnost`, genezis i sovremenny`e tendenczii v
Ukraine. [“Domestic corruption”: the essence, genesis
and current trends in Ukraine]. Bor`ba s
organizovannoj prestupnost`yu i korrupcziej (teoriya i
praktika). 2011. Vol 25-26. Pp. 173-182. [The fight
against organized crime and corruption (theory and
practice). 2011. Vol 25-26. Pp. 173-182. URL:
http://nbuv.gov.ua/j-pdf/boz_2011_25-26_20.pdf.
18. Sirko A. Ekonomiicheskaya teoriya.
Politekonomiya. [Economic theory. Political econ-
omy]. URL: http://pidruchniki.com/1613030562916/
politekonomiya/tinova_ekonomika.
19. Trepak V. Osobennosti definicii
ponjatija "korrupcija". [Features of the definition of the
concept of "corruption"]. Nauchnyj vestnik Nacional-
noj akademii vnutrennih del. 2015. Vol 4 [Scientific
Journal of the National Academy of Internal Affairs.
2015. Vol 4].
20. Ukrainci nazvali osnovnye problemy strany.
[Ukrainians called the main problems of the country].
URL: https://www.rbc.ua/ukr/news/ukraintsy-nazvali-
glavnye-problemy-strany-1540379014.html.
21. Ukrainskij fondovyj rynok ustanovil rekord:
kak i blagodarya chemu. [The Ukrainian stock market
has set a record: how and why.] URL
https://www.ukrinform.ua/rubric-economy/2615657-
ukrainskij-fondovij-rinok-vstanoviv-rekord-ak-i-
zavdaki-comu.html.
22. Vliyanie korrupcii na ekonomicheskij rost.
[The impact of corruption on economic growth]. URL:
https://feao.org.ua/wp-
content/uploads/2016/10/FEAO_Corruption_Econom
y_A5_short_final.pdf.
23. Voloshenko A. E`konomicheskaya
korrupcziya kak institut sistemno-razrushitel`nogo
kharaktera. [Economic corruption as an institution of a
systemically destructive nature]. E`konomika i
upravlenie predpriyatiyami. 2017. Vol 5. Pp.78-88.
[Economics and enterprise management. 2017. № 5.
С.78-88]. URL:
http://nbuv.gov.ua/UJRN/ape_2017_5_10.
24. 13 let lzhi i imitacii. Est li v Ukraine shansy na
nastoyashuyu privatizaciyu. [13 years of lying and im-
itation. Are there any chances of real privatization in
Ukraine]. URL https://www.epravda.com.ua/publica-
tions/2018/08/28/639804/].
22 The scientific heritage No 47 (2020)
ФОРМУВАННЯ СИСТЕМИ СТРАХУВАННЯ ЕКОЛОГІЧНИХ РИЗИКІВ
Полятикіна Л.І.
к.е.н., доцент кафедри обліку і оподаткування
Самошкіна І.Д.
к.е.н., доцент кафедри фінансів, банківської справи та страхування
Полятикін В.О.
магістр з обліку і аудиту
Сумський національний аграрний університет
THE FORMATION OF THE INSURANCE SYSTEM OF ENVIRONMENTAL RISKS
Poliatykina L.
Ph.D. in Economics, Associate Professor,
Department of Accounting and Taxing
Samoshkina I.
Ph.D. in Economics, Associate Professor,
Department of Finance, Banking and Insurance
Poliatykin V.
Master of Accounting and Auditing
Sumy National Agrarian University
Анотація
У статті приділено увагу питанням теоретико-методологічних засад формування системи страхування
екологічних ризиків. Досліджено подальший соціально-економічний поступ в Україні, що залежить від
досягнення прийнятного рівня техногенно-екологічної безпеки та забезпечення самовідтворення навколи-
шнього природного середовища в умовах посиленого антропогенного навантаження на елементи довкілля.
Проаналізовано проблеми сучасної цивілізації, що відбувається на фоні погіршення якості довкілля, що
потребує подальших розробок форм та методів зменшення негативного впливу на оточуюче середовище.
Abstract
The article reviews the theoretical and methodological principles of the formation of the insurance system of
environmental risks. The further socio-economic progress in Ukraine is explored, which depends on the achieve-
ment of an acceptable level of technogenic and ecological safety and ensuring self-reproduction of the environment
in conditions of increased human-induced loading on the elements of the environment. The problems of modern
civilization taking place against the background of deterioration of the quality of the environment are analyzed,
which requires further development of the forms and methods of reducing the negative impact on the environment.
Ключові слова: екологічна безпека, екологічний ризик, організаційно-економічний механізм, стра-
тегічне управління, навколишнє середовище.
Keywords: ecological safety, ecological risk, organizational and economic mechanism, strategic manage-
ment, environment.
Вступ. В сучасному світі все більше приділя-
ється уваги вирішенню екологічних проблем, які
можуть бути спричинені як самою природою, так і
діяльністю людини, причому останній чинник про-
являється все відчутніше. Проблеми забруднення
навколишнього середовища та природних ресурсів
та нераціонального природокористування – одні із
найбільш нагальних і гострих проблем сучасності
та вимагають участі усіх держав як на національ-
ному, так і на транснаціональному рівнях. Науковці
справедливо стверджують, що екологічні проблеми
не обмежені національними кордонами, вони ма-
ють загальнопланетарний характер [2].
Через неврегульованість механізму економіч-
ної відповідальності суб’єктів господарювання,
особливо підприємств з підвищеною небезпекою,
держава бере на себе асигнування значних бюдже-
тних коштів на подолання негативних екологічних
явищ. У вирішенні цих проблем особливої актуаль-
ності набуває розробка та впровадження дійової си-
стеми екологічного страхування практично в усіх
галузях народного господарства. Недостатність ви-
користання потенціалу страхування як потужного
інструментарію управління та запобігання екологі-
чним ризикам, а також відсутність належного стра-
хового захисту юридичних осіб та громадян в умо-
вах забруднення навколишнього природного сере-
довища визначило вибір теми наукової роботи.
На перший план все активніше виступають не
стільки традиційні політичні й соціально-економі-
чні проблеми, скільки злободенні екологічні про-
блеми, які в наш час посіли провідне місце серед
проблем на національному рівні. Саме тому одним
із пріоритетних національних інтересів України є
забезпечення екологічно безпечних умов життєді-
яльності людини і суспільства, збереження навко-
лишнього середовища. З метою управління еколо-
гічною безпекою для виконання задач, які сформу-
льовані у Законі України «Про основні засади
(стратегію) державної екологічної політики на пе-
ріод до 2020 року», виникає потреба прогнозної
оцінки екологічного ризику, як міри реальних існу-
Vol 6-no-47-47-2020
Vol 6-no-47-47-2020
Vol 6-no-47-47-2020
Vol 6-no-47-47-2020
Vol 6-no-47-47-2020
Vol 6-no-47-47-2020
Vol 6-no-47-47-2020
Vol 6-no-47-47-2020
Vol 6-no-47-47-2020
Vol 6-no-47-47-2020
Vol 6-no-47-47-2020
Vol 6-no-47-47-2020
Vol 6-no-47-47-2020
Vol 6-no-47-47-2020
Vol 6-no-47-47-2020
Vol 6-no-47-47-2020
Vol 6-no-47-47-2020
Vol 6-no-47-47-2020
Vol 6-no-47-47-2020
Vol 6-no-47-47-2020
Vol 6-no-47-47-2020
Vol 6-no-47-47-2020
Vol 6-no-47-47-2020
Vol 6-no-47-47-2020
Vol 6-no-47-47-2020
Vol 6-no-47-47-2020
Vol 6-no-47-47-2020
Vol 6-no-47-47-2020
Vol 6-no-47-47-2020
Vol 6-no-47-47-2020
Vol 6-no-47-47-2020
Vol 6-no-47-47-2020
Vol 6-no-47-47-2020
Vol 6-no-47-47-2020
Vol 6-no-47-47-2020
Vol 6-no-47-47-2020
Vol 6-no-47-47-2020
Vol 6-no-47-47-2020
Vol 6-no-47-47-2020
Vol 6-no-47-47-2020
Vol 6-no-47-47-2020
Vol 6-no-47-47-2020
Vol 6-no-47-47-2020
Vol 6-no-47-47-2020
Vol 6-no-47-47-2020
Vol 6-no-47-47-2020
Vol 6-no-47-47-2020

More Related Content

What's hot (8)

Vol 3-no-49-2020
Vol 3-no-49-2020Vol 3-no-49-2020
Vol 3-no-49-2020
 
Sciences of Europe VOL 3, No 62 (2021)
Sciences of Europe VOL 3, No 62 (2021)Sciences of Europe VOL 3, No 62 (2021)
Sciences of Europe VOL 3, No 62 (2021)
 
Vol 3-no-44-44-2020
Vol 3-no-44-44-2020Vol 3-no-44-44-2020
Vol 3-no-44-44-2020
 
Vol 4-no-50-2020
Vol 4-no-50-2020Vol 4-no-50-2020
Vol 4-no-50-2020
 
Sciences of Europe VOL 3, No 66 (2021)
Sciences of Europe VOL 3, No 66 (2021)Sciences of Europe VOL 3, No 66 (2021)
Sciences of Europe VOL 3, No 66 (2021)
 
VOL 2, No 56 (2020
VOL 2, No 56 (2020VOL 2, No 56 (2020
VOL 2, No 56 (2020
 
Vol 5, no 48 (48) (2020)
Vol 5, no 48 (48) (2020)Vol 5, no 48 (48) (2020)
Vol 5, no 48 (48) (2020)
 
The scientific heritage № 70 (70) (2021) vol 3
The scientific heritage № 70 (70) (2021) vol 3The scientific heritage № 70 (70) (2021) vol 3
The scientific heritage № 70 (70) (2021) vol 3
 

Similar to Vol 6-no-47-47-2020

The scientific heritage No 117 (117) (2023)
The scientific heritage No 117 (117) (2023)The scientific heritage No 117 (117) (2023)
The scientific heritage No 117 (117) (2023)The scientific heritage
 
The scientific heritage No 104 (104) (2022)
The scientific heritage No 104 (104) (2022)The scientific heritage No 104 (104) (2022)
The scientific heritage No 104 (104) (2022)The scientific heritage
 
The scientific heritage No 83 (83) (2022) Vol 2
The scientific heritage No 83 (83) (2022) Vol 2The scientific heritage No 83 (83) (2022) Vol 2
The scientific heritage No 83 (83) (2022) Vol 2The scientific heritage
 
The scientific heritage No 94 (94) (2022)
The scientific heritage No 94 (94) (2022)The scientific heritage No 94 (94) (2022)
The scientific heritage No 94 (94) (2022)The scientific heritage
 
The scientific heritage No 69 (69) (2021) Vol 3
The scientific heritage No 69 (69) (2021) Vol 3The scientific heritage No 69 (69) (2021) Vol 3
The scientific heritage No 69 (69) (2021) Vol 3The scientific heritage
 
The scientific heritage VOL-4-No-60-2021
The scientific heritage VOL-4-No-60-2021The scientific heritage VOL-4-No-60-2021
The scientific heritage VOL-4-No-60-2021The scientific heritage
 

Similar to Vol 6-no-47-47-2020 (20)

The scientific heritage No 117 (117) (2023)
The scientific heritage No 117 (117) (2023)The scientific heritage No 117 (117) (2023)
The scientific heritage No 117 (117) (2023)
 
VOL-2-No-9-9-2017
VOL-2-No-9-9-2017VOL-2-No-9-9-2017
VOL-2-No-9-9-2017
 
Vol 3-№-40-40-2019
Vol 3-№-40-40-2019Vol 3-№-40-40-2019
Vol 3-№-40-40-2019
 
Vol 7-no-46-46-2020
Vol 7-no-46-46-2020Vol 7-no-46-46-2020
Vol 7-no-46-46-2020
 
SCIENCE and EDUCATION a NEW DIMENSION ECONOMICS Issue 72
SCIENCE and EDUCATION a NEW DIMENSION ECONOMICS Issue 72SCIENCE and EDUCATION a NEW DIMENSION ECONOMICS Issue 72
SCIENCE and EDUCATION a NEW DIMENSION ECONOMICS Issue 72
 
Vol 4-no-43-43-2020
Vol 4-no-43-43-2020Vol 4-no-43-43-2020
Vol 4-no-43-43-2020
 
The scientific heritage No 104 (104) (2022)
The scientific heritage No 104 (104) (2022)The scientific heritage No 104 (104) (2022)
The scientific heritage No 104 (104) (2022)
 
Vol 8-no-46-46-2020
Vol 8-no-46-46-2020Vol 8-no-46-46-2020
Vol 8-no-46-46-2020
 
POLISH JOURNAL OF SCIENCE №63 (2023)
POLISH JOURNAL OF SCIENCE №63 (2023)POLISH JOURNAL OF SCIENCE №63 (2023)
POLISH JOURNAL OF SCIENCE №63 (2023)
 
VOL 3, No 59 (2020)
VOL 3, No 59 (2020)VOL 3, No 59 (2020)
VOL 3, No 59 (2020)
 
The scientific heritage No 83 (83) (2022) Vol 2
The scientific heritage No 83 (83) (2022) Vol 2The scientific heritage No 83 (83) (2022) Vol 2
The scientific heritage No 83 (83) (2022) Vol 2
 
The scientific heritage No 94 (94) (2022)
The scientific heritage No 94 (94) (2022)The scientific heritage No 94 (94) (2022)
The scientific heritage No 94 (94) (2022)
 
The scientific heritage No 69 (69) (2021) Vol 3
The scientific heritage No 69 (69) (2021) Vol 3The scientific heritage No 69 (69) (2021) Vol 3
The scientific heritage No 69 (69) (2021) Vol 3
 
CV Kolesnyk 2014
CV Kolesnyk 2014CV Kolesnyk 2014
CV Kolesnyk 2014
 
The scientific heritage VOL-4-No-60-2021
The scientific heritage VOL-4-No-60-2021The scientific heritage VOL-4-No-60-2021
The scientific heritage VOL-4-No-60-2021
 
Vol 3-№-40-2019
Vol 3-№-40-2019Vol 3-№-40-2019
Vol 3-№-40-2019
 
Vol 3-№-36-2019
Vol 3-№-36-2019Vol 3-№-36-2019
Vol 3-№-36-2019
 
VOL 3, No 51 (51) (2020)
VOL 3, No 51 (51) (2020)VOL 3, No 51 (51) (2020)
VOL 3, No 51 (51) (2020)
 
SCIENCE and EDUCATION a NEW DIMENSION HUMANITIES and SOCIAL SCIENCE Issue 139
SCIENCE and EDUCATION a NEW DIMENSION HUMANITIES and SOCIAL SCIENCE Issue 139SCIENCE and EDUCATION a NEW DIMENSION HUMANITIES and SOCIAL SCIENCE Issue 139
SCIENCE and EDUCATION a NEW DIMENSION HUMANITIES and SOCIAL SCIENCE Issue 139
 
Vol 2-no-11-11-2017
Vol 2-no-11-11-2017Vol 2-no-11-11-2017
Vol 2-no-11-11-2017
 

More from The scientific heritage

The scientific heritage No 135 (135) (2024)
The scientific heritage No 135 (135) (2024)The scientific heritage No 135 (135) (2024)
The scientific heritage No 135 (135) (2024)The scientific heritage
 
The scientific heritage No 134 (134) (2024)
The scientific heritage No 134 (134) (2024)The scientific heritage No 134 (134) (2024)
The scientific heritage No 134 (134) (2024)The scientific heritage
 
The scientific heritage No 133 (133) (2024)
The scientific heritage No 133 (133) (2024)The scientific heritage No 133 (133) (2024)
The scientific heritage No 133 (133) (2024)The scientific heritage
 
The scientific heritage No 132 (132) (2024)
The scientific heritage No 132 (132) (2024)The scientific heritage No 132 (132) (2024)
The scientific heritage No 132 (132) (2024)The scientific heritage
 
The scientific heritage No 131 (131) (2024)
The scientific heritage No 131 (131) (2024)The scientific heritage No 131 (131) (2024)
The scientific heritage No 131 (131) (2024)The scientific heritage
 
The scientific heritage No 130 (130) (2024)
The scientific heritage No 130 (130) (2024)The scientific heritage No 130 (130) (2024)
The scientific heritage No 130 (130) (2024)The scientific heritage
 
The scientific heritage No 129 (129) (2024)
The scientific heritage No 129 (129) (2024)The scientific heritage No 129 (129) (2024)
The scientific heritage No 129 (129) (2024)The scientific heritage
 
The scientific heritage No 128 (128) (2023)
The scientific heritage No 128 (128) (2023)The scientific heritage No 128 (128) (2023)
The scientific heritage No 128 (128) (2023)The scientific heritage
 
The scientific heritage No 127 (127) (2023)
The scientific heritage No 127 (127) (2023)The scientific heritage No 127 (127) (2023)
The scientific heritage No 127 (127) (2023)The scientific heritage
 
The scientific heritage No 126 (126) (2023)
The scientific heritage No 126 (126) (2023)The scientific heritage No 126 (126) (2023)
The scientific heritage No 126 (126) (2023)The scientific heritage
 
The scientific heritage No 125 (125) (2023)
The scientific heritage No 125 (125) (2023)The scientific heritage No 125 (125) (2023)
The scientific heritage No 125 (125) (2023)The scientific heritage
 
The scientific heritage No 124 (124) (2023)
The scientific heritage No 124 (124) (2023)The scientific heritage No 124 (124) (2023)
The scientific heritage No 124 (124) (2023)The scientific heritage
 
The scientific heritage No 123 (123) (2023)
The scientific heritage No 123 (123) (2023)The scientific heritage No 123 (123) (2023)
The scientific heritage No 123 (123) (2023)The scientific heritage
 
The scientific heritage No 122 (122) (2023)
The scientific heritage No 122 (122) (2023)The scientific heritage No 122 (122) (2023)
The scientific heritage No 122 (122) (2023)The scientific heritage
 
The scientific heritage No 121 (121) (2023)
The scientific heritage No 121 (121) (2023)The scientific heritage No 121 (121) (2023)
The scientific heritage No 121 (121) (2023)The scientific heritage
 
The scientific heritage No 120 (120) (2023)
The scientific heritage No 120 (120) (2023)The scientific heritage No 120 (120) (2023)
The scientific heritage No 120 (120) (2023)The scientific heritage
 
The scientific heritage No 119 (119) (2023)
The scientific heritage No 119 (119) (2023)The scientific heritage No 119 (119) (2023)
The scientific heritage No 119 (119) (2023)The scientific heritage
 
The scientific heritage No 118 (118) (2023)
The scientific heritage No 118 (118) (2023)The scientific heritage No 118 (118) (2023)
The scientific heritage No 118 (118) (2023)The scientific heritage
 
The scientific heritage No 116 (116) (2023)
The scientific heritage No 116 (116) (2023)The scientific heritage No 116 (116) (2023)
The scientific heritage No 116 (116) (2023)The scientific heritage
 
The scientific heritage No 115 (115) (2023)
The scientific heritage No 115 (115) (2023)The scientific heritage No 115 (115) (2023)
The scientific heritage No 115 (115) (2023)The scientific heritage
 

More from The scientific heritage (20)

The scientific heritage No 135 (135) (2024)
The scientific heritage No 135 (135) (2024)The scientific heritage No 135 (135) (2024)
The scientific heritage No 135 (135) (2024)
 
The scientific heritage No 134 (134) (2024)
The scientific heritage No 134 (134) (2024)The scientific heritage No 134 (134) (2024)
The scientific heritage No 134 (134) (2024)
 
The scientific heritage No 133 (133) (2024)
The scientific heritage No 133 (133) (2024)The scientific heritage No 133 (133) (2024)
The scientific heritage No 133 (133) (2024)
 
The scientific heritage No 132 (132) (2024)
The scientific heritage No 132 (132) (2024)The scientific heritage No 132 (132) (2024)
The scientific heritage No 132 (132) (2024)
 
The scientific heritage No 131 (131) (2024)
The scientific heritage No 131 (131) (2024)The scientific heritage No 131 (131) (2024)
The scientific heritage No 131 (131) (2024)
 
The scientific heritage No 130 (130) (2024)
The scientific heritage No 130 (130) (2024)The scientific heritage No 130 (130) (2024)
The scientific heritage No 130 (130) (2024)
 
The scientific heritage No 129 (129) (2024)
The scientific heritage No 129 (129) (2024)The scientific heritage No 129 (129) (2024)
The scientific heritage No 129 (129) (2024)
 
The scientific heritage No 128 (128) (2023)
The scientific heritage No 128 (128) (2023)The scientific heritage No 128 (128) (2023)
The scientific heritage No 128 (128) (2023)
 
The scientific heritage No 127 (127) (2023)
The scientific heritage No 127 (127) (2023)The scientific heritage No 127 (127) (2023)
The scientific heritage No 127 (127) (2023)
 
The scientific heritage No 126 (126) (2023)
The scientific heritage No 126 (126) (2023)The scientific heritage No 126 (126) (2023)
The scientific heritage No 126 (126) (2023)
 
The scientific heritage No 125 (125) (2023)
The scientific heritage No 125 (125) (2023)The scientific heritage No 125 (125) (2023)
The scientific heritage No 125 (125) (2023)
 
The scientific heritage No 124 (124) (2023)
The scientific heritage No 124 (124) (2023)The scientific heritage No 124 (124) (2023)
The scientific heritage No 124 (124) (2023)
 
The scientific heritage No 123 (123) (2023)
The scientific heritage No 123 (123) (2023)The scientific heritage No 123 (123) (2023)
The scientific heritage No 123 (123) (2023)
 
The scientific heritage No 122 (122) (2023)
The scientific heritage No 122 (122) (2023)The scientific heritage No 122 (122) (2023)
The scientific heritage No 122 (122) (2023)
 
The scientific heritage No 121 (121) (2023)
The scientific heritage No 121 (121) (2023)The scientific heritage No 121 (121) (2023)
The scientific heritage No 121 (121) (2023)
 
The scientific heritage No 120 (120) (2023)
The scientific heritage No 120 (120) (2023)The scientific heritage No 120 (120) (2023)
The scientific heritage No 120 (120) (2023)
 
The scientific heritage No 119 (119) (2023)
The scientific heritage No 119 (119) (2023)The scientific heritage No 119 (119) (2023)
The scientific heritage No 119 (119) (2023)
 
The scientific heritage No 118 (118) (2023)
The scientific heritage No 118 (118) (2023)The scientific heritage No 118 (118) (2023)
The scientific heritage No 118 (118) (2023)
 
The scientific heritage No 116 (116) (2023)
The scientific heritage No 116 (116) (2023)The scientific heritage No 116 (116) (2023)
The scientific heritage No 116 (116) (2023)
 
The scientific heritage No 115 (115) (2023)
The scientific heritage No 115 (115) (2023)The scientific heritage No 115 (115) (2023)
The scientific heritage No 115 (115) (2023)
 

Vol 6-no-47-47-2020

  • 1. No 47 (2020) Р.6 The scientific heritage (Budapest, Hungary) The journal is registered and published in Hungary. The journal publishes scientific studies, reports and reports about achievements in different scientific fields. Journal is published in English, Hungarian, Polish, Russian, Ukrainian, German and French. Articles are accepted each month. Frequency: 12 issues per year. Format - A4 ISSN 9215 — 0365 All articles are reviewed Free access to the electronic version of journal Edition of journal does not carry responsibility for the materials published in a journal. Sending the article to the editorial the author confirms it’s uniqueness and takes full responsibility for possible consequences for breaking copyright laws Chief editor: Biro Krisztian Managing editor: Khavash Bernat  Gridchina Olga - Ph.D., Head of the Department of Industrial Management and Logistics (Moscow, Russian Federation)  Singula Aleksandra - Professor, Department of Organization and Management at the University of Zagreb (Zagreb, Croatia)  Bogdanov Dmitrij - Ph.D., candidate of pedagogical sciences, managing the laboratory (Kiev, Ukraine)  Chukurov Valeriy - Doctor of Biological Sciences, Head of the Department of Biochemistry of the Faculty of Physics, Mathematics and Natural Sciences (Minsk, Republic of Belarus)  Torok Dezso - Doctor of Chemistry, professor, Head of the Department of Organic Chemistry (Budapest, Hungary)  Filipiak Pawel - doctor of political sciences, pro-rector on a management by a property complex and to the public relations (Gdansk, Poland)  Flater Karl - Doctor of legal sciences, managing the department of theory and history of the state and legal (Koln, Germany)  Yakushev Vasiliy - Candidate of engineering sciences, associate professor of department of higher mathematics (Moscow, Russian Federation)  Bence Orban - Doctor of sociological sciences, professor of department of philosophy of religion and religious studies (Miskolc, Hungary)  Feld Ella - Doctor of historical sciences, managing the department of historical informatics, scientific leader of Center of economic history historical faculty (Dresden, Germany)  Owczarek Zbigniew - Doctor of philological sciences (Warsaw, Poland)  Shashkov Oleg - Сandidate of economic sciences, associate professor of department (St. Peters- burg, Russian Federation) «The scientific heritage» Editorial board address: Budapest, Kossuth Lajos utca 84,1204 E-mail: public@tsh-journal.com Web: www.tsh-journal.com
  • 2. CONTENT ECONOMIC SCIENCES Broyaka A. FOOD SECURITY OF UKRAINE AS A COMPONENT OF ECONOMIC SECURITY OF THE STATE ..........................3 Bereziuk S., Yaremchuk N. CORRUPTION AS A DESTRUCTIVE FACTOR OF ECONOMIC DEVELOPMENT ......................................11 Poliatykina L., Samoshkina I., Poliatykin V. THE FORMATION OF THE INSURANCE SYSTEM OF ENVIRONMENTAL RISKS............................................22 Bekimbetova G. ANALYSIS OF RISKS IN THE EVALUATE OF EFFICIENCY OF INVESTMENT PROJECTS IN THE IMPLEMENTATION OF INNOVATION PROCESSES IN PRODUCTION.........26 Belimova E. EXPERIENCE IN PROVIDING OUTSOURCING SERVICES IN THE CITY OF SURGUT............................................29 Bondarenko V., Ezangina I. WAYS TO INCREASE PENSION SAVINGS OF THE RUSSIAN PENSION FUND: MODERN ASPECTS ..........32 Veselova Yu., Chekulaeva S. ANALYSIS OF PARAMETERS FOR EVALUATING THE QUALITY MANAGEMENT OF RAILWAY PASSENGER TRANSPORT...............................................................35 Herasymchuk V. ECONOMIC AND MATHEMATICAL FORECASTING OF THE FINANCIAL STATUS OF THE ENTERPRISE IN MODERN CONDITIONS..............................................39 Dovbnya G., Voronina L. BRAND DIDGITAL ANALYSIS AS COMPETITIVE ADVANTAGE..............................................................52 Karimov E. CALCULATION AND ANALYSIS OF MECHANICAL TRADING SYSTEM BASED ON TECHINCAL INDICATORS...............................................................55 Kolesnikov A. ESSENCE, CRITERIA AND INDICATORS OF DEVELOPMENT OF LARGE-SCALE AGRICULTURAL PRODUCTION.............................................................58 Kitseliuk U. ANALYSIS OF THE RELATIONSHIPS BETWEEN REGIONAL ECONOMIC SYSTEMS AND NATIONAL ECONOMY .................................................................62
  • 3. The scientific heritage No 47 (2020) 3 ECONOMIC SCIENCES FOOD SECURITY OF UKRAINE AS A COMPONENT OF ECONOMIC SECURITY OF THE STATE Broyaka A. PhD in Economics, Associate Professor of Economics Department, Vinnytsia National Agrarian University Abstract The article studies the current state of food security in Ukraine based on statistical data of the outlined criteria, in particular: the daily energy value of the human diet, the sufficiency of consumption in terms of basic foods, the dynamics of food consumption by the population and the structure of its expenditures, indicators of the adequacy of state supplies of grain, economic food affordability; the cost differentiation of food products by population groups with different income levels, the capacity of the domestic market and its import dependency. It has been found out that the state of food security in Ukraine does not meet the established threshold values and norms of the majority of indicators. Nevertheless, the value of individual indicators calculated according to 2018 data com- paring with previous years positively characterizes the dynamics of food security in Ukraine: the level of con- sumption sufficiency has increased for a great number of types of products; satisfaction of the population food needs was carried out mainly due to domestic agricultural products. At the same time, the state of food security in Ukraine cannot be characterized as stably positive as: the average daily caloric intake of country population de- creased in terms of livestock products; there is a significant gap in consumption between the quintile groups of households by income; a high level of food dependence has been established (subject to rational consumption standards) for meat, milk, fish products, fruits, berries and grapes; the percentage of import dependence of Ukraine for oil, fruits, berries and grapes exceeds the threshold level. The ranking of Ukraine in the world community has been analyzed according to the Global Food Security Index – 2019. It has been worsened by 13 points compared to the previous year. As a result of the study, the problems in the formation of proper food security system are identified taking into account the features of their manifestation in modern socio-economic and political conditions. The directions of state policy on ensuring food security in Ukraine are determined, such as: balancing of the domestic agricultural market, developing of material and technical base of agricultural production, maintaining the income growth of the population, etc. Keywords: food security, food security indicators, food consumption sufficiency, import dependency, food safety and quality. Introduction. The recent social, economic and political transformations in Ukraine brought to the sur- face a number of important problems, the successful so- lution of which is the key to the further self-sustaining development of the national economy. Ensuring the food security of the country is among such problems, which in critical situations is one of the indicators of the level of foreign economic dependence of the coun- try and its sovereignty. The decline in the living stand- ard and purchasing power of citizens, the destruction of economic relations with Russia, the opening of Euro- pean and world markets, the imperfection of state reg- ulation of the agricultural market and support of the na- tional producer, incomplete land reforms and a number of other factors have led to an aggravation of the prob- lem of ensuring food security in Ukraine. The current quarantine state in Ukraine and world economies to- gether with COVID-19 causes an even greater deepen- ing of socio-economic problems that in its turn also leads to deterioration in the food supply of the popula- tion. Analysis of recent research and publications. The foundations of modern concepts of food security were laid after the Second World War, when the prob- lem of food security in many countries became even more acute. The tasks of overcoming food shortages were spelled out in the Charter of the United Nations created at that time that to this day is actively address- ing the problem of global food security. Given the fact that the problem of food security does not lose its ur- gency, despite the progress achieved in food production in the world, economic science is constantly being re- plenished with studies on various aspects of food secu- rity. Food security issues are in the center of constant attention of Ukrainian scientists, in particular L. Dein- eko, M. Kaletnik, A. Kardash, S. Kvasha, Yu. Lupenko, A. Mostova, B. Paschaver, P. Sabluk, M. Sychevskiy, A. Shpychak, A. Yuzefovych and others. Nevertheless, the emergence of new factors affecting food security and the dynamic changes taking place in Ukrainian economy in the vectors and the scales of its integration into the global food market leave wide scope for further research. Goals setting. The purpose of the article is to in- vestigate the state of food security in Ukraine and as- sess the possibilities of its strengthening in the face of modern internal and external challenges. Research results. Food security is an important component of the economic and national security of the state. As indicated in the National Doctrine of Food Se- curity of Ukraine, food security is the state of the econ- omy, which ensures food independence of the country, guaranteed physical, economic and social accessibility of the population to a sufficient amount of nutritious and safe food, in accordance with the recommended
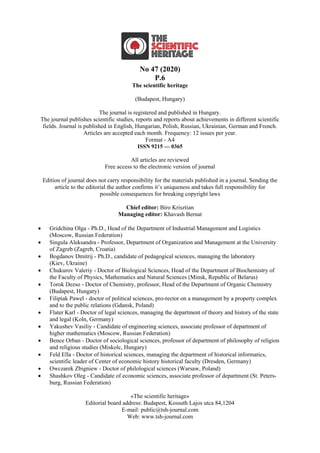
  • 4. 4 The scientific heritage No 47 (2020) diet and nutritional standards [9]. The need to ensure food security requires maintaining a guaranteed stable and sufficient level of agri-food production, determines the trends in domestic and foreign economic policy, formulates measures for socio-economic stabilization and demographic renewal of society, as well as improv- ing the quality of its life. General methodological approaches to the analy- sis of the state of food security as one of the compo- nents of economic security are described in the “Me- thodical recommendations for calculating the level of economic security of Ukraine” dated October 29, 2013 No. 1277. The level of food security, based on these recommendations, is estimated using a system of indi- cators, including: daily calorie intake, thousand kСal; the ratio of production and consumption of the major groups of food products, %; grain production per per- son, tons; grain reserves at the end of the period, % of consumption; the share of sales of imported food prod- ucts through the trading network of enterprises, % [7]. The indicators reflect the characteristics of food secu- rity in terms of current status, changes, and dynamics. The food security indicator acts as an indicative eco- nomic indicator, a measure that allows predicting with a certain degree of accuracy in which direction we should expect the development of economic processes. We can distinguish macro- and microeconomic indica- tors of food security. However, assessing the level of food security is often carried out according to the Methodology for de- termining the main indicators of food security approved by the Cabinet of Ministers of Ukraine dated 05.12.2007 No. 1379 "Some issues of food security", which contains the following indicators and their threshold values [4]. 1) The daily energy value of the human diet is de- fined as the sum of the products of a unit mass of certain types of food consumed by a person during the day and their energy value. The boundary minimum criterion is set at 2500 kCal per day, while 55% of the daily diet should be provided by consuming products of animal origin. The Figure 1 indicates that the daily caloric intake the average Ukrainian slightly exceeds the daily norm, although this excess is insignificant. In 2017-2018, it was at the level of 2706 kСal. For comparison, men- tioned indicator in 2017 in Poland was 3485 kСal per day, in Hungary – 2968 kCal per day, in Bulgaria – 2877 kCal per day. There is a low level of consumption of animal products in the diet of the population of Ukraine (within 29%). Ukrainians receive the bulk of calories from the consumption of plant products. 0 500 1000 1500 2000 2500 3000 3500 кСal 0 5 10 15 20 25 30 35 % products of plant origin, kCal 2050 2183 2124 2101 2090 2008 1952 1926 1919 products of animal origin, kCal 611 733 809 868 849 791 790 781 787 The share of animal products in the diet,% 23 25,1 27,6 29,2 28,9 28,3 28,8 28,9 28,9 2000 2005 2010 2013 2014 2015 2016 2017 2018 Figure 1. The daily energy value of the diet of the population of Ukraine per person in 2000-2018 Source: compiled by authors according to the data of the State Statistics Service of Ukraine [2] 2) Providing the human diet with the main types of products, that is defined as the ratio between the actual consumption of an individual product and its rational norm. According to the data of the State Statistics Ser- vice of Ukraine, in recent years Ukrainian population eats uniformly and the energy value of the diet is pro- vided mainly by carbohydrates and fats due to bread and bakery products, potatoes, eggs and oil, that is an evidence of unbalanced nutrition and attempts to pro- vide for their own energy needs due to relatively afford- able products. Having calculated the indicator of food consumption per person in 2018 in Ukraine, it should be noted that only the consumption of bread and bakery products practically corresponds to the recommended norm. For the remaining types of products (except oil and vegetable fats of all types, the sufficiency ratio of which is 1.38), there is a significantly lower consump- tion level comparing to the rational norm. In particular, the consumption of meat and meat products is 74% of the norm recommended by the Ministry of Health, milk and dairy products – 60%, eggs – 79%, fish and fish products – 84%, sugar – 85%, potatoes – 61%, vegeta- bles and melon products – 66%, fruits, berries and grapes – 51% (Table 1) .
  • 5. The scientific heritage No 47 (2020) 5 Table 1 Calculation of the indicator of sufficiency of food consumption per person per year in Ukraine in 2012-2018 Types of products Rational norm (calculated by the Ministry of Health of Ukraine) Indicator of adequacy of food consumption per person per year 2012 2013 2014 2015 2016 2017 2018 Meat and meat products, kg 80 0,75 0,77 0,74 0,69 0,68 0,65 0,74 Milk and dairy products, kg 380 0,62 0,64 0,64 0,63 0,62 0,53 0,60 Eggs, pcs. 290 0,83 0,83 0,83 0,79 0,83 0,94 0,79 Fish and fish products, kg 20 1,02 1,08 0,96 0,72 0,72 0,54 0,84 Sugar, kg 38 0,98 0,95 0,95 0,88 0,85 0,80 0,85 Oil and other vegetable fats, kg 13 1,66 1,57 1,57 1,48 1,38 0,90 1,38 Potatoes, kg 124 0,75 0,69 0,67 0,64 0,62 1,16 0,61 Vegetables and melon prod- ucts, kg 161 0,75 0,70 0,67 0,66 0,73 0,99 0,66 Fruits, berries, nuts, grapes, kg 900 0,49 0,55 0,49 0,41 0,43 0,59 0,51 Bread and bakery products, kg 101 1,08 1,07 1,07 1,01 0,97 1,0 0,99 Source: compiled by authors according to the data of the State Statistics Service of Ukraine [10] The analysis of the data in Table 1 allows us to conclude that the population of Ukraine does not have the possibility of adequate nutrition in accordance with the needs of the body for almost all types of food, ex- cept oil and vegetable fats. This indicates negative trends and the approximation of food security in this particular indicator to a critical level. The low level of food consumption is the consequence not so much of insufficient agricultural production, as of the low sol- vency of the population, especially of certain social groups [8]. 3) The sufficiency of grain stocks in state re- sources, which is defined as the ratio between the vol- ume of food grain in the state reserve and the volume of domestic consumption of bread and bakery products in terms of grain. The ultimate criterion for this indica- tor is considered to be its 17% level, corresponding to 60 days of consumption. According to the Art. 9 of the Law of Ukraine “On State Support of Agriculture" [12], the Agrarian Fund creates a state intervention fund to ensure food security, which should exceed 20% of the annual domestic consumption of the product for the previous marketing period. As of March 1 2020 in Ukraine, the remnants of grain and leguminous crops were 17.88 million tons, which is 14% less than the same date in 2019 (20.83 million tons). In particular, the reserves of wheat at the beginning of March 2020 were 4.99 million tons, rye - 81.5 thousand tons, barley - 1.58 million tons, corn for grain - 10.68 million tons, sunflower - 5.27 million tons. According to the Ministry of Economic Develop- ment, Trade and Agriculture, as of March 26 2020, a total of about 17.9 million tons was exported, about 1 million tons of which was exported in March. Based on the conditions of the Memorandum on the marginal volume of grain exports for the 2019/20 marketing year, the volume of wheat exports until its end will not exceed 2.3 million tons. In this case, the remnants of wheat stored by agricultural producers at the end of the marketing year (July 2020) will be about 1.7 million tons. Meanwhile, the entire forecasted volume of wheat use in the domestic market during the 2019/2020 mar- keting year is 8.23 million tons. Thus, at the end of the marketing year (i.e. at the time of a new harvest sea- son), the balance of wheat will be 21% of the total an- nual demand. This means that Ukraine will have enough grain for domestic needs, even if demand in- creases sharply and at the same time there will be crop failure of wheat. The integration of Ukraine into the world econ- omy, in particular in the European space, trade liberal- ization within the WTO, and the growth of global food demand have become fundamental factors in the struc- tural changes in the domestic agri-food market. As a re- sult, specialization and concentration of crop produc- tion of export-oriented crops are increasing, including: wheat (sown area of winter and spring wheat in all cat- egories of farms in Ukraine in 2019 amounted to 6809.0 thousand hectares, or 24.5% of the total sown area), corn for grain (respectively 4,973.9 thousand ha or 17.9%), barley (respectively 2615.9 thousand hectares or 9.4%), sunflower (respectively 5849.3 thousand hec- tares or 21.0%), soybeans (respectively 1579.6 thou- sand hectares or 5.7%), rapeseed (respectively 1285.4 thousand hectares or 4.6%) [10]. The comparative advantage of the domestic pro- duction of these crops is possible due to the presence of significant areas of fertile agricultural soil, low land rent, low wages in agriculture, as well as the imperfec- tion of legislation regarding the use and protection of land resources. Unfortunately, in many enterprises, production growth occurs extensively due to an in- crease in the sown area, in particular, in 2019 compared with 2018, the area under crops of wheat increased by 2.9%, corn - by 8.6%, barley - by 5.0%, rapeseed - by 23.4%. Moreover, there is an increase in sown areas of crops that are the most debilitating for the soil, by the point of crop rotation, while there is a significant reduc- tion in sugar beet crops in 2019 compared to 2018 by 20.2%, rye – by 21.1%, and buckwheat – by 40.1% and
  • 6. 6 The scientific heritage No 47 (2020) other cultures that are important to ensure a rational nu- tritional structure of the country population. 4) The economic food affordability, that is equal to the share of total food costs in the structure of total household expenditures. The maximum value of the in- dicator is 60%. According to figure 2, it can be argued that the food costs in the structure of population ex- penditures are less than the normative value of 60%, while in economically developed countries this indica- tor is in between 10% to 15%. The food availability is limited by the solvency of society, which in turn forms the demand for agricultural products. Due to the low level of wages of a larger number of the workers, high unemployment and underemployment, the mismatch between current prices and real incomes of the popula- tion, the threat to ensuring food security in Ukraine is growing [1]. Despite the steady trend towards a de- crease in the share of household consumer spending on food and soft drinks in the structure of total expendi- tures from 56.66% in 2014 to 51.85% in 2018, Ukrain- ian consumers still spend most of their income on them and hence the population is considered to be poor. Prices for food, gas, water, electricity in Ukraine are approaching European, but the real incomes of average citizens do not have this trend. A significant increase in prices of basic foodstuff leads to an increase in house- hold expenditures, a decrease in economic affordability and a disruption in the balanced structure of nutrition and its quality deterioration. The increase in prices of animal products (meat and meat products, milk and dairy products) and fruit was the most rapid. The cost of food for one person in 2018 averaged UAH 57 per day against UAH 46 in 2016 and UAH 29 in 2012 [3]. In the regional context, the smallest share of food ex- penses in total consumer spending in the amount of 46.7% was recorded in households in the Zaporizhzhya region, the highest - in Volyn - 59.2%. The share of food expenses exceeded the average for Ukraine only in 12 regions. Thus, we can conclude that the indicator of economic affordability of food for Ukrainians is not satisfactory. 56,66 57,16 53,43 51,56 51,85 3,71 3,55 3,11 3,34 3,7 6,55 6,14 6,01 5,92 5,87 2,51 2,15 1,82 2,15 2,28 10,26 12,59 17,17 18,3 16,52 3,93 3,98 4,51 4,09 4,35 3708,8 4600,4 5331,4 6632,5 7643,9 0 1000 2000 3000 4000 5000 6000 7000 8000 0 10 20 30 40 50 60 2014 2015 2016 2017 2018 UAH % food and soft drinks alcoholic beverages, tobacco products clothes and shoes household items, household appliances housing, water supply, electricity, gas health care Consumer aggregate expenses on average per month per household, UAH Figure 2. The structure of total consumer spending of households in Ukraine on average per month in 2014- 2018, % Source: compiled by authors according to the data of the State Statistics Service of Ukraine [10] 5) Differentiation of the cost of food by social groups, which is defined as the ratio of food costs of 20% of high-income households to food costs of 20% of low-income households. Table 2 shows that in 2018, 20% of the households with the highest incomes (the highest quintile) spent on average UAH 5247 per month on food, and 20% of the households with the lowest incomes (lowest quintile) - UAH 3134. Based on this, the coefficient of differenti- ation of the cost of food by social groups was 1.67 against 1.62 in 2017. The greatest differentiation in consumption within the highest and lowest quintiles has been preserved for several years for products of an- imal origin (meat, fish, milk), as well as for the fruit and berry group (almost 2.1 times). Households that belong to the first quintile in terms of per capita equivalent in- come are practically on the verge of food danger, since the share of their consumer food expenditures ap- proaches the threshold criterion and amounts to 59.6%.
  • 7. The scientific heritage No 47 (2020) 7 Table 2 Food consumption in households by quintile group depending on the size of the average per capita equivalent total income in Ukraine in 2018 Quintile groups on average per month per person, in terms of the major product, kg Thecostoffood,UAH/month Theshareoffoodcostsinconsumer spending,% Breadandbakeryproducts Meatandmeatproducts Fishandfishproducts Milkanddairyproducts Eggs,pcs. Oilandothervegetablefats Fruits,berries,nuts,grapes Vegetablesandmelonproducts Sugar Potatoes First (lowest) 8,1 3,7 1,1 14,8 17,1 1,5 2,7 7,2 2,4 6,1 3134 59,6 Second 5,2 4,4 1,3 17,1 18,6 1,5 3,3 8,1 2,5 6,3 3617 56,5 Third 8,6 4,9 1,3 19,6 19,4 1,5 3,7 9,1 2,8 6,7 4079 54,2 Fourth 8,4 5,4 1,5 20,4 20,6 1,5 4,2 9,5 2,8 6,3 4460 52,8 Fifth (highest) 8,7 6,5 1,8 24,2 21,7 1,6 5,6 11,0 3,1 6,4 5247 49,3 The ratio between the highest and the lowest quintiles, times 1,07 1,76 1,64 1,64 1,27 1,07 2,07 1,53 1,32 1,05 1,67 Х Source: compiled by authors according to the data of the State Statistics Service of Ukraine [10] Therefore, the growth of population incomes on the basis of a general economic recovery and balanced state social policy aimed at preventing excessive differ- entiation of population incomes and, accordingly, con- sumption, are important "non-food" factors in strength- ening food security. 6) The capacity of the domestic market, which is calculated in physical terms by product type and is equal to the product of food consumption and the aver- age annual population. The domestic market capacity indicator is an im- portant component for compiling supply and demand balances and determining food independence for par- ticular products. The table below shows the capacity of the domestic market for certain types of food. Thus, due to the decrease in the volume of consumption of certain foods by the population, there is a decrease in the ca- pacity of the domestic market, as can be seen from the analysis of table 3. A reduction in the capacity of the domestic market is observed for such types of food as potatoes, vegetables and melon products, eggs, fruits, berries and grapes, bread and bakery products. Table 3 The capacity of the domestic market of certain products in Ukraine in 2014-2018, thousand tons Types of products 2014 2015 2016 2014 2018 2018 to 2014 +/- % Meat and meat products 2447,8 2176,5 2188,8 2191,4 2478,6 30,8 101,26 Milk and dairy products 10080,8 8975,3 8921,5 8477,3 9661,5 -419,3 95,84 Eggs, pcs. 14026,2 11972,7 11370,1 11571,5 9610,9 -4415,3 68,52 Fish and fish products 502,2 367,7 408,8 457,8 708,2 206 141,02 Sugar 1642,4 1526,5 1418,1 1288,5 1365,8 -276,6 83,16 Oil and other vegetable fats 592,7 525,9 498,2 495,9 758,8 166,1 128,02 Potatoes 6379,7 5879,5 5953,3 6078,2 3186,8 -3192,9 49,95 Vegetables and melon products 7384,1 6875,8 6971,1 6769,1 4502,0 -2882,1 60,97 Fruits, berries, nuts, grapes 2366,4 2176,5 2116,4 2238,0 1922,2 -444,2 81,23 Bread and bakery products 4909,2 4412,8 4301,0 4272,5 4198,5 -710,7 85,52 Source: compiled by authors according to the data of the State Statistics Service of Ukraine [10] Under conditions of increasing the purchasing power of the population and food, including public ca- tering establishments, to the level of European coun- tries, the capacity of the domestic market can grow up to 20% [6]. It should also be noted, that in recent years in Ukraine the production of meat and meat products (especially cattle), eggs, sugar, potatoes, vegetables is unprofitable for a great number of agricultural produc- ers. This means that appropriate measures of state sup- port for producers and price regulation are needed for
  • 8. 8 The scientific heritage No 47 (2020) proper nutrition of the population with these types of food at affordable prices. 7) Food independence for an individual product, that is equal to the ratio of import volume and domestic market capacity in physical terms. The maximum limit criterion is set at 30%. The satisfaction of the population food needs, within the limits of their purchasing power, is mainly ensured by domestic products. At the same time, the share of imports in 3 food groups traditionally exceeds the established 30 percent limit criterion for this indi- cator. The highest level of import dependency - almost 80% - is observed for the group "fish and fish prod- ucts", since 90% of imports come from species of fish caught exclusively in the waters of the marine eco- nomic zones of other states, that is associated with the peculiarities of their biological cycle. Moreover, it should be noted that the insufficiently active develop- ment of domestic fish farming, as well as a growth in the purchasing power of the population due to an in- crease in real disposable incomes (for 2018 a “plus” of 9.9%) became factors for an increase in import depend- ency over the indicated group by 6 percentage points during the year. Also the 70% of the import of fruit and berries are exotic fruit that are not grown in Ukraine, but are in demand and the import of vegetable oil is al- most entirely related to its tropical species, that are not produced in Ukraine, but are widely used by domestic enterprises in the production of food and non-food products. Table 4 Calculation of import dependence of Ukraine by food groups in 2018 Types of products Imports of products in terms of the main product, thousand tons The volume of domestic food consumption thousand tons Import dependence, % 2017 2018 2018+/- 2017 Bread and bakery products 176 5610 3,1 3,7 0,6 Meat and meat products 283 2232 12,7 10,6 -2,1 Milk and dairy products 180 8355 2,2 1,6 -0,6 Fish and fish products 394 497 79,3 73,5 -5,8 Eggs, pcs. 4 671 0,6 1,0 0,4 Vegetables and melon products 188 6927 2,7 1,9 -0,8 Fruits, berries, nuts, grapes 878 2445 35,9 36,5 0,6 Potatoes 28 5893 0,5 0,3 -0,2 Sugar 3 1260 0,2 0,5 0,3 Oil and other vegetable fats 238 555 42,9 48,2 5,3 - incl. sunflower oil 1 420 0,2 0,2 0 Source: compiled by authors according to the data of the State Statistics Service of Ukraine [10] The need to ensure food security requires main- taining an appropriate level of food self-sufficiency, provided that effective state support for domestic pro- ducers of agricultural products and import control are used to protect the domestic market from competition. The Ukrainian agricultural market is moderately protected, but more closed than the industrial market. The average duty rate (most favored nation treatment) for agricultural products is 9.2%, while for non-agricul- tural products it is 3.8%. A higher level of protection is established for products of animal origin and dairy products, as well as cereals and sugar. The market of cotton, coffee and tea, drinks, oils and fats, as well as vegetables and fruit are less protected. For comparison: in the EU countries, in particular in Poland and Hun- gary, the average duty rate for agricultural products is 11.1%, in Belarus – 11.3%. The dynamics of this indi- cator is largely determined by the strengthening of in- tegration trends in Ukraine, including the signing of in- ternational agreements on free trade with 45 countries of the world, providing for the abolition of trade re- strictions and duties in mutual trade between countries, and the intensification of preparation for signing such agreements with other countries (Turkey, China, Israel) [11]. In order to assess the state of food security in the world, The Economist Intelligence Unit with the sup- port of the global agricultural company Corteva Agriscience annually prepares and publishes a report Global Food Security Index (GFSI). GFSI considers the core issues of affordability, availability, and quality across a set of 113 countries. The index is a dynamic quantitative and qualitative benchmarking model, con- structed from 34 unique indicators, that measures these drivers of food security across both developing and de- veloped countries [5]. GFSI 2019 highlights the poten- tial environmental threat to food security and demon- strates how appropriate investment and progress in food innovation can help reduce this risk. Ukraine slightly improved the overall score com- pared to last year, but the growth rates of many other countries were much higher, as a result Ukraine took 76th position in the ranking of 2019. In 2018, Ukraine ranked 63rd. Moreover, in 2015 Ukraine took 59th place (56.1 points), in 2014 – 53rd place (57.7 points), in 2013 - 51st place (57.5 points). As we can see, the rating of Ukraine is deteriorating every year. The main strengths identified in the Index for Ukraine are food safety, a low proportion of the popu- lation below the global poverty line, minimal changes in average food expenses and low food losses. Com- pared to the global average, Ukraine has better indica- tors in financing food safety programs, the availability
  • 9. The scientific heritage No 47 (2020) 9 of appropriate storage facilities for crops and the ability to store food safely. Railway infrastructure, dietary di- versity, the presence of micronutrients in food and the percentage of the population with access to drinking water are also positive indicators. The main challenges for the country are corruption, political instability, and insufficient government spending on agricultural re- search and development, and a lack of food standards. Compared to the world average, GDP per capita in Ukraine is very low, as well as poor road and port in- frastructure. Farmers' access to financing and a very small share of land equipped for irrigation were also factors in decreasing the GFSI. Despite achieving high levels of food quality indi- cators, there is the problem of antimicrobial resistance (AMR) through the widespread use of antibiotics in ag- riculture. This causes a number of negative conse- quences, as it reduces the effectiveness of the treatment of many diseases and even leads to death that should be taken into account in the context of COVID-19. Ac- cording to experts, by 2050 the annual mortality from the effects of antimicrobial resistance in the world will increase to 10 million people / year. In addition, AMR can cause significant and global health care costs, other economic and social losses. We should also pay atten- tion to the trend of increasing use in the processing of raw materials a significant amount of chemicals and natural substitutes. The positive effects of their use (in- creasing shelf life and reducing costs per unit of output) are offset by a negative impact on consumer health and deterioration in food security. In addition, the use of pesticides and other agrochemicals in cultivation crops, due to their residues in food products, leads to an in- crease in the level of diseases and, as is observed in 2020, to the mass death of insects, in particular bees, in many regions Ukraine (Zaporizhzhya, Kirovograd, Odessa, Vinnytsia, Chernivtsi, Khmelnytsky, Rivne, Mykolaiv, Ivano-Frankivsk and Poltava regions). A sharp decline in the bee population leads to a significant reduction in the production of such useful products for humans as honey and propolis, and also causes more global problems – unde-pollination of plants, which in turn will reduce their yields. According to the following below Table 5, Ukraine, having significant agricultural potential, lags behind both the rating countries and the integral index components from the reference countries – closest neighbors and competitors. Table 5 Positions of individual countries on the Global Food Security Index GFSI-2019 Global ranking Country Overall Score Affordability Availability Quality and safety 2019 2018 2019 2018 2019 2018 2019 2018 2019 2018 24 26 Poland 75.6 75.4 81.1 76.4 69.3 75.0 79.5 74.1 34 30 Hungary 72.7 72.8 80.8 75.6 66.1 70.5 70.5 72.0 36 44 Belarus 70.9 65.7 76.0 67.6 62.9 63.4 80.2 67.1 38 38 Romania 70.2 68.9 79.3 67.5 64.3 68.8 64.1 72.6 41 48 Turkey 69.8 64.1 74.7 65.3 64.8 60.9 71.1 70.1 42 42 Russia 69.7 69.0 79.8 70.5 60.1 61.0 70.9 75.2 76 63 Ukraine 57.1 54.1 63.9 55.7 50.0 50.2 59.6 61.0 Source: compiled by authors according to the data of the GFSI-2019 and GFSI-2018 [5] For the second year in a row, Singapore (84.7), Ireland (84.0), and the United States (83.7) maintained their top three positions as food security leaders, de- spite adding new indicators to the ranking, including food spending, agricultural infrastructure, and food standards. GFSI-2019 shows that almost all countries within this Index (88%) have sufficient food supply for their population. However, according to the report of the Food and Agriculture Organization of the United Na- tions on the state of food security and nutrition in the world, more than 820 million people are starving. This is a widespread problem: more than a third of the coun- tries evaluated by the GFSI indicate that more than 10% of their population is undernourished. Recognizing the growing impact of the global cli- mate crisis and the depletion of natural resources, the GFSI also includes “Natural Resources and Sustaina- bility” as a separate additional category of data in the other three established dimensions of food security. When this factor was taken into account in the analysis, overall score fell in all countries, thus emphasizing the vulnerability of global food systems to such threats as drought, floods and rising sea levels. For Ukraine, the impact was negligible – the position decreased from 76 to 77 places. Conclusions. The current crisis in the Ukrainian economy determines the deepening of socio-economic problems, which in turn lead to deterioration in the food supply of the population. The conducted assessment of the state of food se- curity in Ukraine has detected that the main threats to food security of the country is the unbalanced con- sumption of food. Malnutrition is noted in the follow- ing food groups, such as meat, milk, fish, fruits and ber- ries. The high differentiation of living standards of the population by social groups and the economic inacces- sibility of food due to low and unstable incomes of the population, the rising of consumer prices for food prod- ucts at a faster rate than incomes do not allow ensuring food security at a sufficient level for high-quality and nutritious nutrition of the population. In addition to the analyzed problems, there are a number of other real internal and external threats to the food security of Ukraine, including declining in food quality, which is caused, on the one hand, by the desire of producers to reduce the cost of their product in the context of inflationary processes and falling solvency of the population, and on the other hand, the imperfec- tion of the legislative fields and certification systems,
  • 10. 10 The scientific heritage No 47 (2020) inconsistency of quality and safety standards; underde- veloped transport infrastructure, reduces access to re- mote, especially in rural areas, and their uninterrupted supply of basic types of food; a high degree of shadow economy, food smuggling, which poses a threat not only to the national economy, but also to human health; lack of competitiveness of domestic agricultural pro- ducers, deterioration of the material and technical base, low level of investment and innovative activity of en- terprises; imperfect financial and tax policy of the gov- ernment, etc. To solve these problems and counter threats to food security, it is necessary to outline and implement a number of preventive measures of state policy, in par- ticular: ensuring the balance and efficiency of the do- mestic agricultural market and its price regulation; pro- moting the competitiveness of domestic agricultural producers and protecting their interests in the domestic and foreign markets; targeted allocation of funds from the sale of agricultural products to the development of the agricultural sector, in particular its material and technical base; modernization of supply infrastructure; settlement of land issues, completion of the formation of a system of standardization and certification of prod- ucts; increasing incomes of the population (in particu- lar, by creating new jobs, supporting small and me- dium-sized businesses, subsidizing, expanding nutri- tion programs for children), which will help to achieve rational consumption standards; promoting the healthy nutrition principles among consumers, etc. The analysis of the level of food security for a wide range of indicators demonstrated that Ukraine has all the possibilities not only to ensure food security in the domestic market, but also to get a significant impact on its strengthening at the global level. To improve po- sition of Ukraine in the global food security rating, it is necessary to focus on creating an effective system of state regulation of the food market, which would in- clude the development and implementation of monitor- ing nutrition of the population, the establishment of a transparent mechanism for providing state guarantees of food safety and quality, as well as the implementa- tion of the Ukrainian legal framework legislation in ac- cordance with European practice, namely EU regula- tions in areas of food safety and quality. Therefore, ensuring the proper level of food secu- rity requires an integrated approach to the development and implementation at the national, regional and local (urban and rural) levels of an effective mechanism, which will include measures of organizational, eco- nomic, regulatory, logistical, social and informational nature. References 1. Babich, M.M. (2017) Problems of food secu- rity in Ukraine. AgroSvit, vol. 3, pp. 32 – 39. [in Ukrainian] 2. Balances and consumption of the main food products by the population of Ukraine. The statistical yearbook (2019) State Statistics Service of Ukraine. 58 р. [in English and Ukrainian] 3. Broyaka, A.A. (2017) Current problems of en- suring food security in Ukraine and their solutions. Economics. Finances. Law. Vol. 4/2. pp. 52 – 58. [in Ukrainian] 4. Cabinet of Ministers of Ukraine (2007) Meth- odology for determining the main indicators of food se- curity “Some issues of food security”. URL: http://za- kon2.rada.gov.ua/laws/show/1379-2007-п [in Ukrain- ian] (accessed 14 May 2020) 5. Global Food Security Index (2019) URL: https://foodsecurityindex.eiu.com/Index [in English] (accessed 19 May 2020). 6. Kaletnik, H.M., Kovalenko, O.V. & Broyaka, A.A. (2017). Current trends of development of the food industry and its place in the state economy. Ekonomika. Finansy. Menedzhment: aktualni pytannia nauky i praktyky – Economy. Finances. Management: topical issues of science and practical activity, # 8 (24), pp. 7 – 26. [in Ukrainian] 7. Ministry of Economic Development and Trade и Ukraine (2013) Methodical recommendations for calculating the level of economic security of Ukraine. URL: https://za- kon.rada.gov.ua/rada/show/v1277731-13/stru [in Ukrainian] (accessed 14 May 2020) 8. Mostova, А. (2019) Current situation of food security of Ukraine and methodical approaches to its evaluation. Black sea economic studies. # 43. pp 60 – 68. [in Ukrainian] 9. Sabluk, P.T., Kaletnik, H.M., Kvasha, S.M. and others. (2011) National Doctrine of Food Security of Ukraine (project). Ekonomika APK "The Economy of Agro-Industrial Complex" International Scientific and Production Journal. # 8. pp. 3 – 11. [in Ukrainian] 10. State Statistics Service of Ukraine. URL: http://www.ukrstat.gov.ua/ [in English and Ukrainian] (accessed 14 May 2020) 11. Sychevskiy, M.P. (2019) Global food security and Ukraine's place in its achievement. Ekonomika APK "The Economy of Agro-Industrial Complex" In- ternational Scientific and Production Journal. # 1. pp. 6 – 17. [in Ukrainian] 12. The Verkhovna Rada of Ukraine (2004) The Law of Ukraine “On state support for agriculture in Ukraine” # 1877-IV/ revised on February 27, 2020. URL: https://zakon.rada.gov.ua/laws/show/1877-15 [in Ukrainian] (accessed 14 May 2020)
  • 11. The scientific heritage No 47 (2020) 11 КОРРУПЦИЯ КАК ДЕСТРУКТИВНЫЙ ФАКТОР ЭКОНОМИЧЕСКОГО РАЗВИТИЯ Березюк С.В. к.э.н., доцент кафедры административного менеджмента и альтернативных источников энергии, Винницкий национальный аграрный университет г. Винница, Украина Яремчук Н.В. к.э.н., старший преподаватель кафедры административного менеджмента и альтернативных источников энергии, Винницкий национальный аграрный университет г. Винница, Украина CORRUPTION AS A DESTRUCTIVE FACTOR OF ECONOMIC DEVELOPMENT Bereziuk S. Candidate of Economic Sciences, Associate Professor of the Administrative Management and Alternative Energy Sources Department, Vinnytsia National Agrarian University Vinnytsia, Ukraine Yaremchuk N. Candidate of Economic Sciences, Senior lecturer of the Administrative Management and Alternative Energy Sources Department, Vinnytsia National Agrarian University Vinnytsia, Ukraine Аннотация В статье акцентировано внимание на отрицательном воздействии «института коррупции» на функци- онирования экономического механизма и его разрушительное влияние на социально-политический кли- мат. Проанализировано дефиницию понятия «коррупция», а также отдельные аспекты ведущие к её воз- никновению и развитию. Подчёркнута прямая связь уровня тенизации государственного сектора экономики и «градуса» кор- рупционного климата в стране. Названы основные причины перехода экономической деятельности субъ- ектов хозяйствования в тень, в частности, несовершенство законодательной базы, коррупционная деятель- ность в системе органов государственного управления, искаженное восприятие идеологии гражданами страны и снижение уровня ценностно-ориентационных норм. Определено, что наиболее коррумпированным сектором остается сектор государственной собствен- ности, в которой процесс приватизации госпредприятий целенаправленно притормаживался управленче- скими структурами в коррупционных целях. Также раскрывается вопрос об организации процесса государственных закупок на основании новов- веденной платформы Prozorro. На рассмотрение выносятся результаты деятельности Национального антикоррупционного бюро Украины как правоохранительного органа имеющего широкие силовые полномочия предупреждения, вы- явления, прекращения и разрытия коррупционных преступлений. Поддерживается теория гиппотетиче- ской зависимости роста ВВП от уровня Индекса восприятия коррупции. Предложено комплекс мер, выполнение которых даст вероятность снизить уровень коррупции в гос- ударстве. Abstract The article focuses on the negative impact of the "corruption institute" on the functioning of the economic mechanism and its destructive impact on the socio-political climate. The definition of the concept of "corruption" is analysed as well as separate aspects leading to its appearance and development. A direct connection between the level of shadowing of the public sector of economy and the «degree» of corruption climate in the country is emphasised. The main reasons for the transition of economic activity of enter- prises to the shadow, in particular, imperfection of the legislative base, corruption in the system of state admin- istration, distorted perception of ideology by citizens of the country and reduction of the level of value and orien- tation norms are mentioned. It has been determined that the most corrupted sector remains the state property sector, where the process of privatisation of state enterprises was purposefully slowed down by management structures for corrupt purposes. The issue of organization of the public procurement process on the basis of the new Prozorro platform is also
  • 12. 12 The scientific heritage No 47 (2020) disclosed. The results of activities of the National Anti-Corruption Bureau of Ukraine as a law enforcement agency with broad power to prevent, detect, stop and break up corruption crimes are submitted for consideration. The theory of hypothetical dependence of GDP growth on the Corruption Perceptions Index is supported. A set of measures has been proposed, the implementation of which will make it possible to reduce the level of corruption in the state. Ключевые слова: коррупция, приватизация, индекс воспрятия коррупции, тенизация економики, гос- ударственные закупки. Keywords: corruption, privatization, anti-corruption index, shadow economy, public procurement. Formulation of the problem. In Ukraine, the level of Corruption is quite high and it neutralizes a sig- nificant amount of internal resources. This is the re- source that is redistributed through corrupt rent and which is actually withdrawn from our national product, which actually makes the Ukrainians one of the poorest nations in Europe. The experience of many countries in the world shows that traditional attempts to suppress corruption only through strict law enforcement measures do not yield positive results. This situation is explained by the fact that corruption measures are im- plemented under the influence of super active factors motivating human behavior - power and wealth. When analyzing corruption on a societal scale, we conclude that it is economically motivated. The main motive of a corrupt person is the desire to take possession of ad- ditional material wealth. And a ban on corrupt actions also has its price. The negative impact of corruption on the eco- nomic sphere is primarily manifested in the increase in the value of commercial contracts and, as a conse- quence, leads to a similar increase in prices for goods and services. Therefore, the population of a country with a high level of corruption will never achieve a de- cent level of welfare, even if the economy is suffi- ciently modernised and developed. Presenting main material. Corruption is a com- plex phenomenon of today's social reality. Penetrating into almost all spheres of society, this destructive "in- stitution" entails the destruction of social ideals, eco- nomic mechanisms, the legal environment. For a long time, we have witnessed how our government distorts the state system in its own interests. The causes of corruption are diverse and complex, but the main one is the inability of the authorities to resist this destabi- lizing phenomenon, which from year to year blurs the boundaries between public and private interests. According to the results of a nationwide survey of the population of Ukraine, 91% of citizens consider corruption a serious problem, and 61% of respondents are convinced that it is the most serious problem that hinders the development of the country. Only 4% of respondents admit that the problem of corruption ex- ists, but it is not too serious, and 0.5% consider this problem far-fetched. During the year, compared to 2017, awareness of the seriousness of the problem of corruption has grown significantly: in September 2017, 44% considered corruption to be the most seri- ous problem, now - 61%; not too serious in 2017 - 12%, today - 4% (Fig.1). According to citizens, the main reason for the lack of positive changes in the fight against corruption is that those who have to fight it are themselves corrupt. Other important reasons: corruption usually goes unpunished (38%), the lack of a "strong hand" that would bring or- der to society (31%), and the imperfection of laws that can be interpreted in any way (28%). Respondents were divided on whether corruption could be considered a manifestation of the Ukrainian mentality. 38% believe that corruption is part of the mentality, and 46% - that it is not. At the same time, the younger the respondents, the more often they called corruption a manifestation of the mentality of Ukraini- ans. This question arose in 2001, when corruption was considered a manifestation of the Ukrainian mentality much less - 26% [5].
  • 13. The scientific heritage No 47 (2020) 13 Fig.1. Problems that, in the opinion of the citizens of Ukraine, hinder the development of the state mostly as of 08.01.2018 * It was possible to choose several (not more than 3) answer options at once Source: [20] Regarding the definition of "corruption", in prac- tice there are two main approaches to the formation of this scientific concept. The first is doctrinal, based on research by scientists and specialists in a particular field. The second is official, legal, based on regulations, international documents and other sources that have le- gal force [19]. According to the first approach, the analysis of modern scientific literature demonstrates a significant number of definitions of corruption, summarizing which, we can say that the understanding of corruption depends on the angle from which it is trying to explore experts in various fields of science. Thus, from the point of view of economics, the generalized position of scholars who have studied the concept of corruption within economic theory is defined as follows: corrup- tion is the sale of public property by civil servants for private purposes, which is not just a function of re- sources spent on surveillance and prosecution. function of relations between the state and the private sector [19]. Also, one of the most successful is the interpreta- tion of the concept of "corruption" by a domestic scien- tist M.I. Melnyk, who believes that “corruption is a so- cial phenomenon that covers a set of corrupt acts related to the misuse by persons authorized to perform the functions of the state, the power given to them, official powers, appropriate opportunities to satisfy personal interests or the interests of third parties » [17]. The Code of Conduct for Officials, adopted by the UN General Assembly on December 17, 1979, defines corruption as "... the commission of certain acts in the performance of duties, or in connection with these du- ties as a result of gifts, promises or incentives, or their illegal receipt whenever there is such an act or omis- sion. " This definition reflects not only the receipt of material values by an official, but also his official be- havior [///] In the Ukrainian legal dictionary-reference, corruption is interpreted as one of the forms of abuse of power, which is associated with bribery of officials [Corruption. Legal dictionary-reference book [4]. The Law of Ukraine “On Prevention of Corrup- tion” [Law] defines the term corruption as the use by a person of official powers or related opportunities for the purpose of obtaining an illegal benefit or accepting a promise / offer of such benefit for himself or others, respectively promise / offer or providing an improper benefit to a person, or at the request of another person in order to persuade that person to misuse the official powers granted to him or her [6]. The world community perceives Ukraine not just as a country with a high level of "corruption climate", but as a country where the "institution of corruption" is an integral part of economic and socio-political life. Transparency International provides the results of its own research, which demonstrates the following sit- uation. 30 points out of 100 possible - the result of the Corruption Perceptions Index in 2019 for Ukraine. The country returned to the level of 2017 and now ranks 126th out of 180 countries. Next in the ranking - Kyr- gyzstan, Azerbaijan and Djibouti. Among its neigh- bors, Ukraine is ahead of Russia, which has maintained its position (28 points, 137th place). Poland (58 points, 41st place) and Slovakia (50 points, 59th place) are ex- pected to lead the neighbors. Belarus added one point and now has 45 points and 66th place. Also, this year we see a decrease in the index of neighbors: Romania - minus 3 points, Hungary - by 2, Moldova by 1 [11]. The need to determine the preconditions of corrup- tion is due to the fact that corruption as a social phe- nomenon is a product of socio-historical processes and social relations with established patterns and trends. 78,9 55,1 32,3 30,2 16,5 12 7,3 6,9 6,5 6,1 3,3 0,9 0 50 corruption war in the Donbass oligarchs in economics lack of professionals in power populism of politicians migration, departure of the working population lack of significant investment in the economy rupture of relations with Russia, orientation to… passivity of citizens external management difficult to tell other
  • 14. 14 The scientific heritage No 47 (2020) That is why identifying the causes of corruption is so important in the process of combating it (Fig.2). Fig.2. Types of corruption and their interpretation Source: [3] Historically, the source of corruption has been ex- cessive state interference in the economy, through abuse of power, the creation of excessive bureaucra- cies, which were not needed at the appropriate stage of reforming the economic system, "hints" to entrepre- neurs to solve business issues outside the legal sphere (Table 1). Excessive change of government during the years of independence has led to the formation in the minds of public officials of an understanding of the short term of office and the desire to use their official position for material gain. Table 1 Causes of corruption Political (use of powers to satisfy private interests) - low level of legal culture of society - excessive and active state intervention in the economy and private life of citizens - non-transparency of the public administration system, development and decision-making processes at the national, regional and local levels Economic (use of civil servants' own pow- ers in the field of economic man- agement) - instability of the country's economy - underdevelopment of the monetary and financial system - lack of transparent mechanisms for privatization and tendering for public procurement - unfavorable investment climate. Legal (inefficient system of anti-cor- ruption tools and imperfect anti- corruption legislation) - uneffective mechanism for counteracting the abuse of bureaucracy - ignorance or misunderstanding of laws by the population - Insufficient settlement of liability for various acts of corruption - gaps, ambiguity and vagueness of legislation - imperfection of the system of declaring incomes of civil servants Organizational and managerial - the ability of officials to make decisions at their discretion - total occupation of public posts with the help of personal relationships Socio-psychological (low civic consciousness; a mentality that is distorted by the awareness of the possibility of solving any issue without undue effort and loss of time) - weakness of civil society - low wages - lack of career prospects in the presence of professional achievements - low level of management culture - unclear organization of control and imperfection of decision-making pro- cedures and reporting on the work performed Corruption is often associated not only with the misapplication of legislation, it can distort the legisla- tive process itself, when the preparation and adoption of regulations is reduced to meet their own business in- terests, rather than public needs. By destroying state foundations from within, cor- ruption reproduces on a larger scale the real threats to the civilizational prospects of Ukrainian statehood. The aggressiveness of corruption is manifested in its insti- Petty corruption – it is the daily abuse by middle- and lower-level government offi- cials of the government entrusted to them in dealing with ordinary citizens seeking access to basic services provided by the state in health care, education, police stations, and other government agen- cies. Grand corruption – these are actions committed at the central level of public admin- istration that distort the policy or mode of functioning of central public authorities, which allows senior officials to receive remuner- ation for the public good. Political corruption – it is the manipulation of policies, institutions and regulations (rules, procedures) by officials who make political decisions on the allocation of resources and funding, who use their positions in order to maintain their powers, status and financial status
  • 15. The scientific heritage No 47 (2020) 15 tutional expansion. Having the power of internal stabil- ity, latent and creeping nature, corruption distorts the mechanisms of social influence, distorts the content of law and morality, replaces the main goals of public ad- ministration, distorts the paths of economic develop- ment. As a result, corruption from private criminal practice becomes a systemic problem, characterized by the formation of stable corrupt segments of the econ- omy, in which the political will of the state is actually subordinated to the interests of oligarchic groups [23]. The current situation stabilizes the public opinion that the state, as a socio-economic institution, has be- come a hostage of a vicious circle of events, when in- creased corruption activity strengthens the segment of "poverty", and the latter, in turn, becomes successful. bridgehead "further development of corruption. Corruption is a macro-critical phenomenon, one of the main problems of our time, because the annual losses of the world economy from bribes, according to the International Monetary Fund, are about $ 1.5-2.0 trillion, or 2% of world GDP [12]. Corruption contributes to the shadowing of the public sector of the economy, which in turn is mani- fested in the uncontrolled production, exchange and consumption of goods and services, as a result, the state budget is short of tax revenues. Ukraine has traditionally been characterized by a high level of shadow economy. The main reasons for the transition of the economy to the "shadow" are: - imperfection of legislation, especially tax. These include excessive tax pressure (inflated tax rates and / or excessive taxes), confusing (non-transparent) tax ad- ministration mechanisms, unfair provision of tax bene- fits to businessmen close to the government, etc .; - corruption in the public administration system. Corruption is an anti-social phenomenon, the essence of which is the commercialization of public officials by their functional responsibilities; - purely human weekness (greed, legal ignorance, etc.). Fig.3. The level of the shadow economy in Ukraine (% of GDP), by sector Source: [18] According to the calculations of the Ministry of Economic Development, the level of the shadow econ- omy in 2018 amounted to 30% of official GDP, which is 2 percentage points less than in 2017 and is the low- est level since 2009 (Fig. 3). Given that the de-shadow- ing of the economy is considered by experts as one of the measures of the effectiveness of the implemented reforms and their perception by society, this result de- serves attention. In 2014, the level of the shadow econ- omy was 43% of official GDP (Figure 4). 46,8 43,6 44,3 52,9 47,5 53,4 43,5 47,2 46,3 43,6 50,2 48,1 51,8 44,7 0 10 20 30 40 50 60 all sectors processing industry wholesaling retailing services building others 2018 2017
  • 16. 16 The scientific heritage No 47 (2020) Fig.4. Integral indicator of the level of the shadow economy of Ukraine (in% of the volume of official GDP) and growth rates / decrease of the level of real GDP (in % to the previous year) Source: [12] One of the main threats posed by the shadow economy to the economic system is the distortion of the mechanisms of laws and market instruments, which leads to the ineffectiveness of mechanisms to stimulate the economy, hindering the economic development of the country. Therefore, the government's efforts should focus, first of all, on the implementation of measures aimed at minimizing the impact of systemic factors of shadowing of the economy, which remain relevant, namely: - low efficiency of the state in providing the institutional basis for the development of a competitive economy; according to the Global Competitiveness Index (GIC) Report 2018, the efficiency of state and public institutions (“Institutions”) remains one of the biggest competitive “failures” of Ukraine's economy (110th among 140 countries). The low position in the ranking according to this sub-index indicates that the administrative and legal conditions in which businesses operate remain unfavorable due to the persistently high level of corruption, lack of an effective judicial system and proper protection of property rights; - high level of corruption; - low efficiency of the judicial system. The level of independence of the judiciary and the level of efficiency of the legal system in arbitration are assessed by international experts as low (117th and 103rd places in the 2018 HIC ranking, respectively). - insufficient protection of rights to movable and immovable property, including rights to financial assets. According to the GIC 2018 rating, Ukraine ranks 129th in terms of protection of property rights and 114th in terms of protection of intellectual property rights. One of the most corrupt areas remains state ownership. Today, the public sector has 3,733 state- owned enterprises. The fact that the country is not able to control the efficiency, expediency, and in general the economic activity of the latter seems absolutely expected. That is why the process of privatization on time is a necessary precondition for the state to emerge from economic stagnation. Obtaining funds from privatization is not a priority, because in fact, a single infusion of financial resources into the state budget is not a panacea and does not solve the dilemma of economic growth. The main objectives of the privatization process should be to attract investment capital and, as a consequence, the possibility of modernization of production facilities, job creation and competitive products. The stock market of Ukraine in 2018 jumped by more than 80% and became the best in the world ranking in terms of key index, which since 1997 is calculated by one of the two largest domestic exchanges FFTS (First Stock Trading System). Index data clearly reflects and responds instantly to any market fluctuations, both positive and negative. The FFTS index as an indicator of economic security of securities traders most fully reflects the essence and trends of the Ukrainian stock market (Fig.5). 38 34 34 35 43 40 35 32 30 4,1 5,5 0,2 0 -6,6 -9,8 2,4 2,5 3,3 -10 0 10 20 30 40 50 2010 2011 2012 2013 2014 2015 2016 2017 2018 the level of the shadow economy of Ukraine (in% of the volume of official GDP) growth rates / decrease of the level of real GDP , in % to the previous year
  • 17. The scientific heritage No 47 (2020) 17 Fig.5. FFTS index value (Ukraine) Source: [12] The current “plus” of tens of percent means that the demand for securities on the market was extremely high, and they rose sharply in price after a period of deep decline in 2015-2016. Although in general, the volume of the Ukrainian stock market worldwide remains tiny and explanation Such a significant increase lies in the low base of comparison, but despite this, the dynamics of the index eloquently gives a positive signal to investors as potential owners of privatized objects [21]. However, despite the urgency of the issue, the privatization process was deliberately delayed due to a number of factors: - unreliability and imperfection of the domestic institutional environment, which creates the unattractiveness of privatization objects for foreign investors; - imperfection of the regulatory framework for regulating the privatization process; - inconsistent policies and lack of long-term plans; - deliberate delay in the privatization of state- owned objects in order to maintain control over them and, as a result, maximize the debts of enterprises, which entails the loss of their potential economic attractiveness. Annual allocation of billions of hryvnias from privatization to the State Budget is a risky issue and does not correspond to the qualitative assessment of budget revenues, as the privatization plan is being implemented only by 2-4% (Fig. 6) [24]. Fig. 6. Dynamics of privatization in Ukraine, million USD Source: SPF 369,51 349,04 301,49 243,01 229,31 223,30 239,78 265,67 272,06 286,19 294,16 315,74 358,47 463,95 538,17 552,27 563,51 548,63 524,85 509,65 504,50 0,00 100,00 200,00 300,00 400,00 500,00 600,00 01.05.2015 01.08.2015 01.11.2015 01.02.2016 01.05.2016 01.08.2016 01.11.2016 01.02.2017 01.05.2017 01.08.2017 01.11.2017 01.02.2018 01.05.2018 01.08.2018 01.11.2018 01.02.2019 01.05.2019 01.08.2019 01.11.2019 01.02.2020 0 473 1061 593 376 962 1349 416 2097 115 1091 800 1255 1251 1364 1430 778 669 643 4 381 397 108 378 1770 4039 104 487 91 104 138 1441 853 185 39 7 7 115 0 500 1000 1500 2000 2500 3000 3500 4000 4500 1992-1999 2000 2001 2002 2003 2004 2005 2006 2007 2008 2009 2010 2011 2012 2013 2014 2015 2016 2017 plan fact
  • 18. 18 The scientific heritage No 47 (2020) A positive step was the repeal by Parliament of a list of laws banning the privatization of more than a thousand enterprises. 9% of all state-owned enterprises (over 400 objects) have already been transferred to the State Property Fund of Ukraine. In general, the Program of Activities of the Cabinet of Ministers announces a reduction of the share of state ownership in the economy to 5%. The development of ownership policy with a clear definition of the purpose of state ownership and key performance indicators for all state- owned enterprises is announced. [Draft Resolution on the Program of Activities of the Cabinet of Ministers of Ukraine] [13]. Of course, corruption can also exist in private enterprises, but then it will cease to be a problem of citizens who are the "holders" of the State budget. On August 1, 2016, the Prozorro system came into force, which became mandatory for all purchases in the country. The system was designed to provide open access to information, open up the public procurement market to suppliers and launch transparent online auctions to reduce prices, which will save public money [14]. Speaking about the effectiveness of this system, attention is focused on its effectiveness in improving the efficiency of public procurement and reducing corruption schemes in this sector. But still, there is a question about possible cases of corrupt practices. Cooperation with the customer is necessary for most illegal procurements. By implementing the conspiracy plan, the customer may formulate a tender in such a way as to minimize competition for the bidder, providing a unique size, color, brand or composition of products, which, respectively, will know only a predetermined contractor. In addition, the customer may announce the bidding on such a date that the bidder could not physically collect the necessary certificates, quality certificates, etc. before the start of the bidding. Accordingly, the desired winner of the tender will be notified in advance of the need to collect certificates. Another effective workaround for the customer is to hide the tender in the electronic tender system so that potential bidders cannot find it and submit their bids. At the same time, "trusted" suppliers, of course, learn about everything in time. Of course, the above agreed actions of the bidder and the customer harm competition and violate the rights of bona fide bidders. In addition, they lead to a waste of budget funds in huge amounts [2]. Therefore, the ProZorro system gave hope for open work in public procurement and clearly minimized the risks, but corruption in public procurement wasn`t fully overcome. The issue of impunity for violating the law remains problematic, because as soon as the subject of the appeal applies to the authorized body with the recorded violations of the public procurement process, the customer cancels the tender offer and announces it again. In the Strategy of Sustainable Development "Ukraine-2020" the main goal of anti-corruption reform contains two components of corruption in Ukraine, reducing losses of the state budget and business due to corruption, as well as increasing Ukraine's position in international rankings assessing the level of corruption [15]. The constant pursuit of corruption is pushing for radical steps to eradicate this negative phenomenon by creating new bodies to combat it. The National Anti- Corruption Bureau of Ukraine (NABU) was established on the basis of the Law of Ukraine “On the National Anti-Corruption Bureau of Ukraine” of October 14, 2014 [7]. According to the NABU Law, it is a state law enforcement body that is responsible for preventing, detecting, terminating, investigating and disclosing corruption offenses within its jurisdiction, as well as preventing the commission of new ones. The purpose of this body is to combat criminal corruption offenses committed by senior officials authorized to perform the functions of state or local self-government, and pose a threat to national security. According to the Law of Ukraine "On Amendments to Certain Legislative Acts of Ukraine on Ensuring the Activities of the National Anti-Corruption Bureau of Ukraine and the National Agency for Prevention of Corruption" amendments to the Law of Ukraine “On the Prosecutor's Office”. Pursuant to the above-mentioned Law, the Specialized Anti- Corruption Prosecutor's Office (CAP) is established in the Prosecutor General's Office of Ukraine (as a structural subdivision), in which the prosecutor, as a specially authorized anti-corruption entity, is empowered to make inquiries. and the conditions that contributed to the commission of corruption-related offenses [8] in September 2019, the Supreme Anti- Corruption Court has started its work, to which all NABU cases will be transferred. The creation of a court to hear the country's top corrupt officials was a requirement of Western partners and the IMF. Avoiding “elite corruption” (corruption of high- ranking officials), purposeful work to expose corrup- tion offenses was often replaced by drawing up a sig- nificant number of protocols on ordinary officials - civil servants of 6-7 categories, who committed minor mis- demeanors that only formally fell under the signs of corruption. socially dangerous [6]. The National Bureau has proved that positions do not save from responsibility. This confirms the fact that during the reporting period, under the procedural guid- ance of SAP prosecutors, detectives reported the suspi- cion to 17 top-level government officials. Among them: an employee of the Office of the President of Ukraine, a minister, several deputy ministers (at the time of no- tification of suspicion), a number of former deputies of Ukraine, former First Deputy Secretary of the National Security and Defense Council, NAPC ex-head, former First Deputy Head of the State Migration Service of Ukraine, incumbent . These persons are mostly accused of abuse of office, harm to state interests, declaration of unreliable information. Perhaps the largest society was outraged by the actions of three people's deputies (now - ex), who illegally received compensation from the budget for rent. Also among the "leaders" brought to justice - middle-ranking public officers, law enforce- ment officers, heads of state enterprises. In total, in the second half of 2019, the status of suspects in the NABU
  • 19. The scientific heritage No 47 (2020) 19 and SAP cases was granted to 84 people, including many directors of state-owned enterprises [10]. Corruption in state-owned enterprises has been the focus of NABU detectives since the very beginning of the institution's activities. In 2018, the work started in December 2015 brings results: the investigation of corruption schemes at a number of state-owned enterprises has been completed, organizers and participants have been identified. In total, in the second half of last year, 61 people became accused in the NABU and SAP investigations. Due to their illegal activities, the state interests were damaged in the amount of more than 2.7 billion hryvnias. In the reporting period, the investigation of corruption at unique enterprises of the transport industry (SE "Seaports Administration of Ukraine", PJSC "Sea Trident", PJSC "Ukrzaliznytsia"), chemical industry (PJSC "United Mining and Chemical Company"), energy (JSC "Kharkivoblenergo"), etc. Sufficient evidence has been gathered to draw up and send indictments to court. As a result, the National Bureau, as a pre-trial investigation body, has fulfilled its mission. Then - the word of the court, which must determine the degree of guilt of persons and sentence them to crimes. The NABU court ruling is an important precondition for compensating the state for corruption. After all, under these conditions, the confiscation of property seized during the pre-trial investigation becomes a reality. There are hundreds of plots of land and real estate, vehicles and more. The total value of these assets reaches over UAH 9 billion, of which about UAH 0.5 billion is in criminal proceedings in which an indictment has been drawn up [10]. (Fig. 7). Fig.7. Performance results NABU Source: [10] The economy is a dynamic system that is con- stantly changing under the influence of certain factors. That is why for positive and qualitative dynamics it is necessary to minimize the impact of destabilizing factors. Economic growth is the response of the economic system to positive influences and the transition to a higher stage of evolution. One of the main indicators of economic growth is the growth of absolute and relative indicators of real GDP. That is, a growing economy produces more and more goods and more services. This process is accompanied by the strengthening of the competitive advantages of the national economy on the world stage. In a study by the Office of Financial and Economic Analysis in the Verkhovna Rada of Ukraine (OFEA) to obtain an empirical assessment of the impact of corruption on economic growth, an empirical analysis of a sample of 145 countries analyzed data on two indicators: corruption perception index and GDP per capita (Fig.8). In the world during the relevant period there was a direct relationship between CPI and GDP per capita - the higher the level of corruption, the lower the GDP. 87,1 153,3 213,2 220,02 8,28 10,18 0,14 0,25 0,01 0,45 0,17 0,27 0,01 0,1 1 10 100 1000 first half of 2017 Second half of 2017 first half of 2018 Second half of 2018 first half of 2019 Second half of 2019 losses reimbursement
  • 20. 20 The scientific heritage No 47 (2020) Fig.8. Correlation between GDP per person and the value of the CPI in the EU, 2019 Source: [22] The study of the impact of corruption on GDP per person clearly shows the regional differences between countries. A similar situation is observed when assessing the interdependence between the level of corruption and two indicators such as life expectancy and literacy. It is quite difficult to overthrow the corrupt elite and oligarchs from the top of the pyramid. However, it is possible to put an end to the destructive relationship between government, wealth and corruption by outlining the requirements of high standards of government accountability and an independent judiciary. Corruption contributes to the following phenomena, which have a destructive burden on economic growth and, consequently, on economic development: ⁃ loss of trust of economic entities and citizens in government structures; ⁃ growth of the shadow economy sector, which contributes to the shortfall of the state budget in tax revenues; ⁃ irrational use of budget funds in the current state budget deficit; ⁃ loss of potential investors due to the inverse proportionality of the level of corruption to the level of attractiveness of the investment climate; ⁃ non-fulfillment by the state, as an institution of the political system of society, of the functions assigned to it in full; ⁃ distortion of property relations and fair distribution and redistribution of resources in society, which creates social inequality; ⁃ negative impact on strategically important sectors of the economy such as medicine and education. Conclusions and suggestions. Not to fight cor- ruption means to support it, but given the devastating consequences of such inaction in all spheres of society, the problem of counteracting this "enemy" is in any state. First of all, it is necessary to understand that anti- corruption reforms are not just a process of concluding corrupt officials, because the latter will not change the system at all. This is a view into the "root" of the prob- lem, which defines corruption as an acceptable norm, but as the basis for the formation of social, political and economic order. Given the above, a number of measures are pro- posed to overcome corruption: - limiting the opportunities for hidden government actions by demonopolizing the country's politics and economy; - the active support of civil society by programmes for local authorities aimed at reducing the risks of cor- ruption that arise during the decentralization reform; - enhancing the virtue, independence and profes- sionalism of the judicial system; - speeding up the process of privatization, reforms of state-owned enterprises and developing a procedure for the verification of relevant draft laws to attract anti- monopoly assessment to prevent damage to competi- tion for discriminatory norms. References 1. Corruption: Costs and Mitigating Strategies. 2016. May. URL: https://www.imf.org/external/pubs/ft/sdn/2016/sdn160 5.pdf. 2. Ili vse prozrachno v ProZorro? [Is everything transparent in ProZorro?] URL: https://yur- gazeta.com/publications/practice/inshe/chi-vse- prozoro-u-prozorro.html. 3. Karpenko M., Pashkovskij V. Sovremenny`e priznaki korrupczionnoj prestupnosti i ikh soderzhanie. [Karpenko M., Pashkovsky V. Modern signs of corrup- tion crime and their content]. Yuridicheskaya nauka. 2013. Vol 5. Pp. 54-61. [Law science. 2013. Vol 5. Pp. 54-61]. 4. Korrupcziya. Yuridicheskij slovar`- spravochnik. [Corruption. Legal Dictionary]. URL: 0 10000 20000 30000 40000 50000 60000 70000 80000 90000 0 20 40 60 80 100 GDPperperson,$ ІСК
  • 21. The scientific heritage No 47 (2020) 21 http://subject.com.ua/pravo/dict/564.html. 5. Ocenka problematiki korrupcii v obshhestvennom mnenii. [Evaluation of the proboemat- ics of corruption in public opinion]. URL: https://dif.org.ua/article/otsinka-problematiki-koruptsii- v-gromads?fbclid= IwAR0J_erwk9Jotr2WVQhqT5Cl1d6bjXqzHykuApc5 gIgBcO4OOnib2U1re 6. O predotvrashhenii korrupczii: Zakon Ukrainy` ot 14.10.2014, № 1700-VII. [Law of Ukraine “On the Prevention of Corruption from 14.10.2014] URL: https://zakon.rada.gov.ua/laws/show/1700- 18/stru#Stru. 7. O Nacionalnom antikorrupcionnom byuro Ukrainy: Zakon Ukrainy ot 14.10.2014 № 1698- VII. [About National Anti-Corruption Bureau of Ukraine: The Law of Ukraine from 14.10.2014 № 1698- VII]. URL: https://zakon.rada.gov.ua/laws/ show/2447-1]. 8. O vnesenii izmenenij v nekotorye zakonodatelnye akty Ukrainy otnositelno obespecheniya deyatelnosti Nacionalnogo antikorrupcionnogo byuro Ukrainy i Nacionalnogo agentstva po voprosam predotvrasheniya korrupcii: Zakon Ukrainy ot 12.02.2015 № 198-VII. [About amendments to certain legislative acts of Ukraine re- garding the operation of the National Anti-Corruption Bureau of Ukraine and the National Agency for the Pre- vention of Corruption: Law of Ukraine from 12.02.2015 № 198-VII]. URL: https://zakon.rada.gov.ua/laws/show/198- 19. 9. Official website of the Ministry of Justice of Ukraine. URL: https://minjust.gov.ua/m/str_7094. 10. Official website of the National Anti- Corruption Bureau of Ukraine. URL: https://nabu.gov.ua/reports. 11. Official Website Transparensy International Ukraine. URL: https://ti-ukraine.org/research/indeks- spryjnyattya-koruptsiyi-2019/. 12. Official website of the Ministry of Finance of Ukraine. URL: https://index.minfin.com.ua/markets/stock/pfts/. 13. Proekt postanovleniya o programme deyatelnosti Kabineta Ministrov Ukrainy. [Draft decree on the programme of activities of the Cabinet of Min- isters of Ukraine]. URL: http://w1.c1.rada.gov.ua/pls/zweb2/webproc4_1?pf35 11=66959 14. Poedinok Prozorro s korrupciej. [Prozorro's fight with corruption.] URL: https://www.epravda.com.ua/columns/2020/03/23/658 092/ 15. Polozhenie o strategii ustojchivogo razvitiya «Ukraina-2020»: Ukaz Prezidenta Ukrainy ot 12.01.2015 № 5/2015. [Regulation on the Sustainable Development Strategy "Ukraine 2020": Presidential Decree from 12.01.2015 № 5/2015]. URL: https://zakon.rada.gov.ua/laws/show/5/2015. 16. Pro prokuraturu: Zakon Ukraini ot 14.10.2014 № 1697-VII. [About the Prosecutor's Office: Law of Ukraine from 14.10.2014 № 1697-VII]. URL: https://zakon.rada.gov.ua/laws/ show/1697-18. 17. Solovyov V. «By`tovaya korrupcziya»: sushhnost`, genezis i sovremenny`e tendenczii v Ukraine. [“Domestic corruption”: the essence, genesis and current trends in Ukraine]. Bor`ba s organizovannoj prestupnost`yu i korrupcziej (teoriya i praktika). 2011. Vol 25-26. Pp. 173-182. [The fight against organized crime and corruption (theory and practice). 2011. Vol 25-26. Pp. 173-182. URL: http://nbuv.gov.ua/j-pdf/boz_2011_25-26_20.pdf. 18. Sirko A. Ekonomiicheskaya teoriya. Politekonomiya. [Economic theory. Political econ- omy]. URL: http://pidruchniki.com/1613030562916/ politekonomiya/tinova_ekonomika. 19. Trepak V. Osobennosti definicii ponjatija "korrupcija". [Features of the definition of the concept of "corruption"]. Nauchnyj vestnik Nacional- noj akademii vnutrennih del. 2015. Vol 4 [Scientific Journal of the National Academy of Internal Affairs. 2015. Vol 4]. 20. Ukrainci nazvali osnovnye problemy strany. [Ukrainians called the main problems of the country]. URL: https://www.rbc.ua/ukr/news/ukraintsy-nazvali- glavnye-problemy-strany-1540379014.html. 21. Ukrainskij fondovyj rynok ustanovil rekord: kak i blagodarya chemu. [The Ukrainian stock market has set a record: how and why.] URL https://www.ukrinform.ua/rubric-economy/2615657- ukrainskij-fondovij-rinok-vstanoviv-rekord-ak-i- zavdaki-comu.html. 22. Vliyanie korrupcii na ekonomicheskij rost. [The impact of corruption on economic growth]. URL: https://feao.org.ua/wp- content/uploads/2016/10/FEAO_Corruption_Econom y_A5_short_final.pdf. 23. Voloshenko A. E`konomicheskaya korrupcziya kak institut sistemno-razrushitel`nogo kharaktera. [Economic corruption as an institution of a systemically destructive nature]. E`konomika i upravlenie predpriyatiyami. 2017. Vol 5. Pp.78-88. [Economics and enterprise management. 2017. № 5. С.78-88]. URL: http://nbuv.gov.ua/UJRN/ape_2017_5_10. 24. 13 let lzhi i imitacii. Est li v Ukraine shansy na nastoyashuyu privatizaciyu. [13 years of lying and im- itation. Are there any chances of real privatization in Ukraine]. URL https://www.epravda.com.ua/publica- tions/2018/08/28/639804/].
  • 22. 22 The scientific heritage No 47 (2020) ФОРМУВАННЯ СИСТЕМИ СТРАХУВАННЯ ЕКОЛОГІЧНИХ РИЗИКІВ Полятикіна Л.І. к.е.н., доцент кафедри обліку і оподаткування Самошкіна І.Д. к.е.н., доцент кафедри фінансів, банківської справи та страхування Полятикін В.О. магістр з обліку і аудиту Сумський національний аграрний університет THE FORMATION OF THE INSURANCE SYSTEM OF ENVIRONMENTAL RISKS Poliatykina L. Ph.D. in Economics, Associate Professor, Department of Accounting and Taxing Samoshkina I. Ph.D. in Economics, Associate Professor, Department of Finance, Banking and Insurance Poliatykin V. Master of Accounting and Auditing Sumy National Agrarian University Анотація У статті приділено увагу питанням теоретико-методологічних засад формування системи страхування екологічних ризиків. Досліджено подальший соціально-економічний поступ в Україні, що залежить від досягнення прийнятного рівня техногенно-екологічної безпеки та забезпечення самовідтворення навколи- шнього природного середовища в умовах посиленого антропогенного навантаження на елементи довкілля. Проаналізовано проблеми сучасної цивілізації, що відбувається на фоні погіршення якості довкілля, що потребує подальших розробок форм та методів зменшення негативного впливу на оточуюче середовище. Abstract The article reviews the theoretical and methodological principles of the formation of the insurance system of environmental risks. The further socio-economic progress in Ukraine is explored, which depends on the achieve- ment of an acceptable level of technogenic and ecological safety and ensuring self-reproduction of the environment in conditions of increased human-induced loading on the elements of the environment. The problems of modern civilization taking place against the background of deterioration of the quality of the environment are analyzed, which requires further development of the forms and methods of reducing the negative impact on the environment. Ключові слова: екологічна безпека, екологічний ризик, організаційно-економічний механізм, стра- тегічне управління, навколишнє середовище. Keywords: ecological safety, ecological risk, organizational and economic mechanism, strategic manage- ment, environment. Вступ. В сучасному світі все більше приділя- ється уваги вирішенню екологічних проблем, які можуть бути спричинені як самою природою, так і діяльністю людини, причому останній чинник про- являється все відчутніше. Проблеми забруднення навколишнього середовища та природних ресурсів та нераціонального природокористування – одні із найбільш нагальних і гострих проблем сучасності та вимагають участі усіх держав як на національ- ному, так і на транснаціональному рівнях. Науковці справедливо стверджують, що екологічні проблеми не обмежені національними кордонами, вони ма- ють загальнопланетарний характер [2]. Через неврегульованість механізму економіч- ної відповідальності суб’єктів господарювання, особливо підприємств з підвищеною небезпекою, держава бере на себе асигнування значних бюдже- тних коштів на подолання негативних екологічних явищ. У вирішенні цих проблем особливої актуаль- ності набуває розробка та впровадження дійової си- стеми екологічного страхування практично в усіх галузях народного господарства. Недостатність ви- користання потенціалу страхування як потужного інструментарію управління та запобігання екологі- чним ризикам, а також відсутність належного стра- хового захисту юридичних осіб та громадян в умо- вах забруднення навколишнього природного сере- довища визначило вибір теми наукової роботи. На перший план все активніше виступають не стільки традиційні політичні й соціально-економі- чні проблеми, скільки злободенні екологічні про- блеми, які в наш час посіли провідне місце серед проблем на національному рівні. Саме тому одним із пріоритетних національних інтересів України є забезпечення екологічно безпечних умов життєді- яльності людини і суспільства, збереження навко- лишнього середовища. З метою управління еколо- гічною безпекою для виконання задач, які сформу- льовані у Законі України «Про основні засади (стратегію) державної екологічної політики на пе- ріод до 2020 року», виникає потреба прогнозної оцінки екологічного ризику, як міри реальних існу-