
Recommended
Recommended
More Related Content
What's hot
What's hot (20)
Similar to Cushman & Wakefield's Q2 2017 Office Marketbeat
Similar to Cushman & Wakefield's Q2 2017 Office Marketbeat (20)
Recently uploaded
Recently uploaded (20)
Cushman & Wakefield's Q2 2017 Office Marketbeat
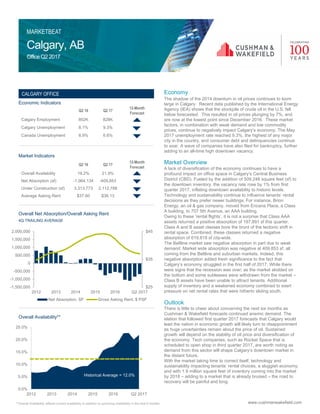
- 1. Calgary, AB OfficeQ22017 MARKETBEAT Economic Indicators Market Indicators Overall Net Absorption/Overall Asking Rent 4Q TRAILING AVERAGE Overall Availability** www.cushmanwakefield.com Economy The shadow of the 2014 downturn in oil prices continues to loom large in Calgary. Recent data published by the International Energy Agency (IEA) shows that the stockpile of crude oil in the U.S. fell below forecasted. This resulted in oil prices plunging by 7%, and are now at the lowest point since December 2016. These market factors, in combination with weak demand and low commodity prices, continue to negatively impact Calgary’s economy. The May 2017 unemployment rate reached 9.3%, the highest of any major city in the country, and consumer debt and delinquencies continue to soar. A wave of companies have also filed for bankruptcy, further adding to an all-time high downtown vacancy. Market Overview A lack of diversification of the economy continues to have a profound impact on office space in Calgary’s Central Business District (CBD). Fueled by the addition of 509,248 square feet (sf) to the downtown inventory, the vacancy rate rose by 1% from first quarter 2017, inflating downtown availability to historic levels. Technology and sustainability continue to influence tenants’ rental decisions as they prefer newer buildings. For instance, Brion Energy, an oil & gas company, moved from Encana Place, a Class A building, to 707 5th Avenue, an AAA building. Owing to these ‘rental flights’, it is not a surprise that Class AAA assets returned a positive absorption of 197,891 sf this quarter. Class A and B asset classes bore the brunt of the tectonic shift in rental space. Combined, these classes returned a negative absorption of 619,818 sf city-wide. The Beltline market saw negative absorption in part due to weak demand. Market wide absorption was negative at 409,853 sf, all coming from the Beltline and suburban markets. Indeed, this negative absorption added fresh significance to the fact that Calgary’s economy struggled in the first half of 2017. While there were signs that the recession was over; as the market skidded on the bottom and some subleases were withdrawn from the market – Class B assets have been unable to attract tenants. Additional supply of inventory and a weakened economy combined to exert pressure on net rental rates that were hitherto sliding south. Outlook There is little to cheer about concerning the next six months as Cushman & Wakefield forecasts continued anemic demand. The elation that followed first quarter 2017 forecasts that Calgary would lead the nation in economic growth will likely turn to disappointment as huge uncertainties remain about the price of oil. Sustained growth will depend on the stability of oil price and diversification of the economy. Tech companies, such as Rocket Space that is scheduled to open shop in third quarter 2017, are worth noting as demand from this sector will shape Calgary’s downtown market in the distant future. With the market taking time to correct itself, technology and sustainability impacting tenants’ rental choices, a sluggish economy, and with 1.9 million square feet of inventory coming into the market by 2018 – adding to a market that is already bruised – the road to recovery will be painful and long. Q2 16 Q2 17 12-Month Forecast Calgary Employment 802K 828K Calgary Unemployment 8.1% 9.3% Canada Unemployment 6.9% 6.6% Q2 16 Q2 17 12-Month Forecast Overall Availability 19.2% 21.9% Net Absorption (sf) -1,064,134 -409,853 Under Construction (sf) 3,313,773 2,112,788 Average Asking Rent $37.60 $36.13 CALGARY OFFICE Historical Average = 8.47% ` $25 $35 $45 -1,500,000 -1,000,000 -500,000 0 500,000 1,000,000 1,500,000 2,000,000 2012 2013 2014 2015 2016 Q2 2017 Net Absorption, SF Gross Asking Rent, $ PSF 0.0% 5.0% 10.0% 15.0% 20.0% 25.0% 2012 2013 2014 2015 2016 Q2 2017 **Overall Availability reflects current availability in addition to upcoming availability in the next 6 months Historical Average = 12.0%
- 2. Calgary, AB OfficeQ22017 MARKETBEAT www.cushmanwakefield.com SUBMARKET TOTAL BLDGS INVENTORY (SF) TOTAL VACANT (SF) CURRENT AVAILABILITY RATE OVERALL AVAILABILITY RATE** CURRENT NET OVERALL ABSORPTION (SF) YTD NET OVERALL ABSORPTION (SF) UNDER CONSTR (SF) OVERALL AVERAGE ASKING RENT (ALL CLASSES)* OVERALL AVERAGE ASKING RENT (CLASS A)* Central Core 74 20,310,787 4,509,674 22.2% 22.7% 205,641 69,814 0 $39.84 $43.23 East Core 51 14,202,065 3,265,075 23.0% 25.0% -290,249 -257,067 1,841,493 $38.85 $39.96 West Core 69 8,173,885 2,124,226 26.0% 26.9% 103,634 84,022 0 $29.91 $27.84 Downtown Total 194 42,686,737 9,898,975 23.2% 24.3% 19,026 -103,231 1,841,493 $37.07 $40.54 Beltline 155 7,740,736 1,377,907 17.8% 18.7% -133,958 -4,486 0 $33.09 $38.26 Central Total 272 50,427,473 11,276,882 22.4% 23.4% -114,932 -107,717 1,841,493 $36.59 $40.39 Northwest 79 2,394,590 265,641 11.1% 11.3% 505 -6,608 163,890 $34.49 $36.16 Northeast 133 7,150,513 1,124,926 15.7% 15.8% -141,901 -81,132 0 $32.79 $37.37 Southeast 144 7,825,227 1,884,246 24.1% 25.2% -75,507 -37,596 4,000 $33.92 $35.59 Southwest 44 3,539,300 716,856 20.3% 22.3% -78,018 -45,964 103,405 $34.18 $35.52 Suburban Total 400 20,909,630 3,991,669 19.1% 19.9% -294,921 -171,300 271,295 $33.70 $36.04 CALGARY TOTALS 778 71,337,103 15,268,551 21.4% 22.4% -409,853 -279,017 2,112,788 $36.13 $39.58 Key Lease Transactions Q2 2017 PROPERTY SF TENANT TRANSACTION TYPE SUBMARKET Encana Place 75,000 RocketSpace Headlease Downtown – East Core Glenmore Professional Centre 70,800 Bantrel Inc Renewal Southwest Centrium Place 51,474 Trilogy Energy Corp Headlease Downtown – Central Core Bow Valley Square II 26,495 STEP Energy Sub Lease Downtown – East Core Centrium Place 23,000 Carscallen LLP Headlease Downtown - Central Core Key Sales Transactions Q2 2017 PROPERTY SF SELLER/BUYER PRICE / $PSF SUBMARKET Ford Tower & Alpine Building 201,349 Artis Alpfordeau Ltd/Ford Tower GP Ltd $37,500,000 / $186 Downtown – Central Core Franklin Atrium 149,660 Dream Office REIT/1923846 Alberta Ltd $10,250,000/ $68 Northeast SUMMARY BY CLASS TOTAL BLDGS INVENTORY (SF) TOTAL VACANT (SF) CURRENT AVAILABILITY RATE OVERALL AVAILABILITY RATE** CURRENT NET OVERALL ABSORPTION (SF) YTD NET OVERALL ABSORPTION (SF) UNDER CONSTR (SF) YTD CONSTR COMPLETIONS (SF) OVERALL AVERAGE ASKING RENT* Class AAA 19 14,674,884 2,231,195 15.2% 15.9% 197,891 246,883 1,841,493 0 $47.10 Class A 232 33,924,883 7,935,191 23.4% 24.5% -419,357 -227,992 229,935 0 $37.27 Class B 322 18,449,918 4,204,040 22.8% 23.7% -200,461 -323,500 41,360 0 $31.61 Class C 205 4,287,418 898,125 20.9% 21.9% 12,074 25,592 0 0 $29.28 *Rental rates reflect gross asking $psf/year *Rental rates reflect gross asking $psf/year About Cushman & Wakefield Cushman & Wakefield is a leading global real estate services firm that helps clients transform the way people work, shop, and live. The firm’s 43,000 employees in more than 60 countries provide deep local and global insights that create significant value for occupiers and investors around the world. Cushman & Wakefield is among the largest commercial real estate services firms with revenue of $5 billion across core services of agency leasing, asset services, capital markets, facility services (C&W Services), global occupier services, investment & asset management (DTZ Investors), project & development services, tenant representation, and valuation & advisory. To learn more, visit www.cushmanwakefield.com or follow @CushWake on Twitter. Copyright © 2017 Cushman & Wakefield. All rights reserved. The information contained within this report is gathered from multiple sources considered to be reliable. The information may contain errors or omissions and is presented without any warranty or representations as to its accuracy. Cushman & Wakefield 111 – 5th Avenue SW, Suite 1730 Calgary, AB T2P 3Y6 www.cushmanwakefield.com For more information, contact: Ayo Peters Research Manager Tel: +1 403 261 1111 ayo.peters@cushwake.com **Overall Availability reflects current availability in addition to upcoming availability in the next 6 months **Overall Availability reflects current availability in addition to upcoming availability in the next 6 months