Visiongain publishes: EOR yearbook 2019
•
0 likes•20 views

The Ultimate Guide to Enhanced Oil Recovery (EOR). Spending ($m) & Production (bpd) Forecasts for Chemical (Polymer, Alkaline, Surfactant), Gas (CO2 Injection, Nitrogen Injection, Natural Gas Injection), Thermal (Steam Injection (Steam Flood, Cyclic Steam Simulation (CSS)), Steam Assisted Gravity Drainage (SAGD), In-Situ Combustion, Heavy Oil Recovery Technologies Including Leading Company Analysis for Thermal EOR, Chemical EOR and CO2 EOR

Recommended
Recommended
More Related Content
What's hot
What's hot (20)
Similar to Visiongain publishes: EOR yearbook 2019
Similar to Visiongain publishes: EOR yearbook 2019 (20)
Recently uploaded
Recently uploaded (20)
Visiongain publishes: EOR yearbook 2019
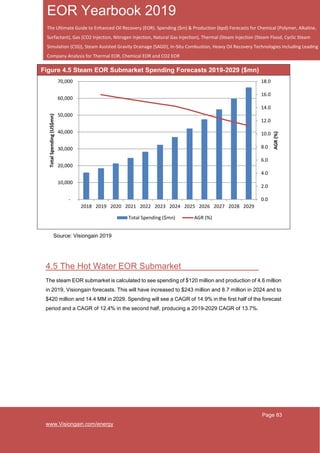
- 1. Page 83 www.Visiongain.com/energy EOR Yearbook 2019 The Ultimate Guide to Enhanced Oil Recovery (EOR). Spending ($m) & Production (bpd) Forecasts for Chemical (Polymer, Alkaline, Surfactant), Gas (CO2 Injection, Nitrogen Injection, Natural Gas Injection), Thermal (Steam Injection (Steam Flood, Cyclic Steam Simulation (CSS)), Steam Assisted Gravity Drainage (SAGD), In-Situ Combustion, Heavy Oil Recovery Technologies Including Leading Company Analysis for Thermal EOR, Chemical EOR and CO2 EOR Figure 4.5 Steam EOR Submarket Spending Forecasts 2019-2029 ($mn) Source: Visiongain 2019 4.5 The Hot Water EOR Submarket The steam EOR submarket is calculated to see spending of $120 million and production of 4.6 million in 2019, Visiongain forecasts. This will have increased to $243 million and 8.7 million in 2024 and to $420 million and 14.4 MM in 2029. Spending will see a CAGR of 14.9% in the first half of the forecast period and a CAGR of 12.4% in the second half, producing a 2019-2029 CAGR of 13.7%. 0.0 2.0 4.0 6.0 8.0 10.0 12.0 14.0 16.0 18.0 - 10,000 20,000 30,000 40,000 50,000 60,000 70,000 2018 2019 2020 2021 2022 2023 2024 2025 2026 2027 2028 2029 AGR(%) TotalSpending(US$mn) Total Spending ($mn) AGR (%)
- 2. Page 138 www.Visiongain.com/energy EOR Yearbook 2019 The Ultimate Guide to Enhanced Oil Recovery (EOR). Spending ($m) & Production (bpd) Forecasts for Chemical (Polymer, Alkaline, Surfactant), Gas (CO2 Injection, Nitrogen Injection, Natural Gas Injection), Thermal (Steam Injection (Steam Flood, Cyclic Steam Simulation (CSS)), Steam Assisted Gravity Drainage (SAGD), In-Situ Combustion, Heavy Oil Recovery Technologies Including Leading Company Analysis for Thermal EOR, Chemical EOR and CO2 EOR at around $50 per barrel compared with around $15 per barrel for oil produced using conventional techniques, it is understandable that a long-term approach will need to be taken by the government to provide the incentives for EOR development. Establishing a more favourable tax environment for EOR does not appear to be a priority for the Russian government at present, though this is likely to change over the course of the ten-year forecast period as the country aims to meet its ambitious production targets. The government introduced tax breaks for tight oil development in 2013. Considering the fact that Western Siberia accounts for more than half of Russia’s oil output, and no major discoveries have been made in the past five years, the likelihood of increased EOR activities in the future is even higher. Though longer-term opportunities may exist in the Arctic, Russia will certainly require EOR techniques to make the most of its existing reserves over the next decade, which will lead to high growth rates, Visiongain believes. 4.6.9 The Egypt Thermal EOR Market Forecast 2019-2029 Table 4.19 display Visiongain’s forecast for the thermal EOR market in Egypt over the next ten years. Table 4.19 Egypt Thermal EOR Market Forecast 2019-2029 (MMbbl/yr production, Spending $m, AGR %, CAGR %, Cumulative) 2018 2019 2020 2021 2022 2023 2024 2025 2026 2027 2028 2029 2019-29 Production (MMbbl/yr) 26.5 31.3 36.9 43.4 50.8 59.3 68.9 79.8 91.8 105.1 119.8 135.9 823 AGR (%) 18.2 17.8 17.5 17.1 16.7 16.3 15.7 15.1 14.5 14.0 13.4 Total Spending ($m) 331 398 476 569 676 802 948 1,115 1,303 1,516 1,756 2,023 11,582 AGR (%) 20.1 19.7 19.3 19.0 18.6 18.2 17.6 16.9 16.3 15.8 15.2 CAGR 2019-24 (%) 19.0 2024- 2029 16.4 - CAGR 2019-29 (%) 17.7 Source: Visiongain 2019
- 3. Page 320 www.Visiongain.com/energy EOR Yearbook 2019 The Ultimate Guide to Enhanced Oil Recovery (EOR). Spending ($m) & Production (bpd) Forecasts for Chemical (Polymer, Alkaline, Surfactant), Gas (CO2 Injection, Nitrogen Injection, Natural Gas Injection), Thermal (Steam Injection (Steam Flood, Cyclic Steam Simulation (CSS)), Steam Assisted Gravity Drainage (SAGD), In-Situ Combustion, Heavy Oil Recovery Technologies Including Leading Company Analysis for Thermal EOR, Chemical EOR and CO2 EOR 6.14 The Indonesian Chemical EOR Production and Market Forecast 2019-2029 Table 6.24 display Visiongain’s production forecast for Indonesian chemical EOR over the next ten years. Table 6.24 The Indonesian Chemical EOR Production Forecast, 2019-2029 (MMbbl/yr, AGR %, CAGR%, Cumulative) 2018 2019 2020 2021 2022 2023 2024 2025 2026 2027 2028 2029 2019-29 Production (MMbbl/yr) 0.0 7.6 9.0 10.6 12.4 14.5 16.9 19.5 22.1 24.9 27.7 30.5 196 AGR (%) - 18.2 17.8 17.4 16.9 16.5 15.0 13.6 12.4 11.3 10.2 CAGR 2019-24 (%) 17.4 2024- 2029 12.5 - CAGR 2019-29 (%) 14.9 Source: Visiongain 2019 Figure 6.46 The Indonesian Chemical EOR Production Forecast, 2019-2029 (MMbbl/yr, AGR %) Source: Visiongain 2019 0.0 2.0 4.0 6.0 8.0 10.0 12.0 14.0 16.0 18.0 20.0 0.0 5.0 10.0 15.0 20.0 25.0 30.0 35.0 2018 2019 2020 2021 2022 2023 2024 2025 2026 2027 2028 2029 AGR(%) Production(MM/yr) Production (Mbpd) AGR (%)
- 4. Page 378 www.Visiongain.com/energy EOR Yearbook 2019 The Ultimate Guide to Enhanced Oil Recovery (EOR). Spending ($m) & Production (bpd) Forecasts for Chemical (Polymer, Alkaline, Surfactant), Gas (CO2 Injection, Nitrogen Injection, Natural Gas Injection), Thermal (Steam Injection (Steam Flood, Cyclic Steam Simulation (CSS)), Steam Assisted Gravity Drainage (SAGD), In-Situ Combustion, Heavy Oil Recovery Technologies Including Leading Company Analysis for Thermal EOR, Chemical EOR and CO2 EOR 8. The Leading Companies in the Enhanced Oil Recovery Market 8.1 The Leading Companies in the Thermal EOR Market 8.1.1 Suncor Table 8.1 Overview of Suncor in the Thermal Oil Sands EOR Market (Headquarters, CEO, Address, Website, Total Company Revenue 2017 ($m), Business Segments, No. of Employees, IR Contact, Ticker, Thermal Oil Sands EOR Spending ($m) 2017, Thermal Oil Sands EOR Market Share (%) 2017, Market Rank) FY 2018 Headquarter Alberta, Canada CEO Steve Williams Address 150 – 6, Avenue S.W., Calgary, Alberta, Canada, T2P 3E3 Website www.suncor.com Total Company Revenue 2017 ($m) US $32,051 million Business Segments Oil Sand, Exploration and Production, Refining and Marketing No. of Employees 12,381 IR Contact +1 800 558 9071 Ticker SU (NYSE) Thermal Oil Sands EOR Spending ($m) in 2018 US $1,090 million Thermal Oil Sands EOR Market Share (%) in 2018 9.9% Market Rank 2nd Source: Visiongain 2019, Suncor 2018 Suncor Energy, an integrated energy company is headquartered in Alberta, Canada. It is engaged in the exploration, acquisition, development, production, and marketing of crude oil in Canada and overseas. It owns and operated mining, extraction, upgrading and in situ assets in the Athabasca oil sands region. The company also owns a range of other assets, including refineries in Edmonton, Alberta, four wind power projects with a total capacity of 111 megawatts, and Canada’s largest biofuels plant, which has a current production capacity of 400 million litres per year. Suncor’s product offering includes oil, natural gas, wind-generated electricity, and ethanol. Through a 2009 merger with Petro-Canada, the company also owns a network of 1,450 petrol stations throughout Canada. In addition to Suncor’s North American operations, the company also has assets in the UK, Libya and Syria, though the latter possessions are not currently operational due to local violence.