Australian Advertisers Ramp Up Digital Ad Spending but Struggle to Engage Consumers
•
1 like•91 views

Australians are buying more connected devices to suit their always-on lifestyle.
Recommended

Recommended
More Related Content
What's hot
What's hot (20)
Similar to Australian Advertisers Ramp Up Digital Ad Spending but Struggle to Engage Consumers
Similar to Australian Advertisers Ramp Up Digital Ad Spending but Struggle to Engage Consumers (20)
More from Signal
More from Signal (12)
Recently uploaded
Recently uploaded (20)
Australian Advertisers Ramp Up Digital Ad Spending but Struggle to Engage Consumers
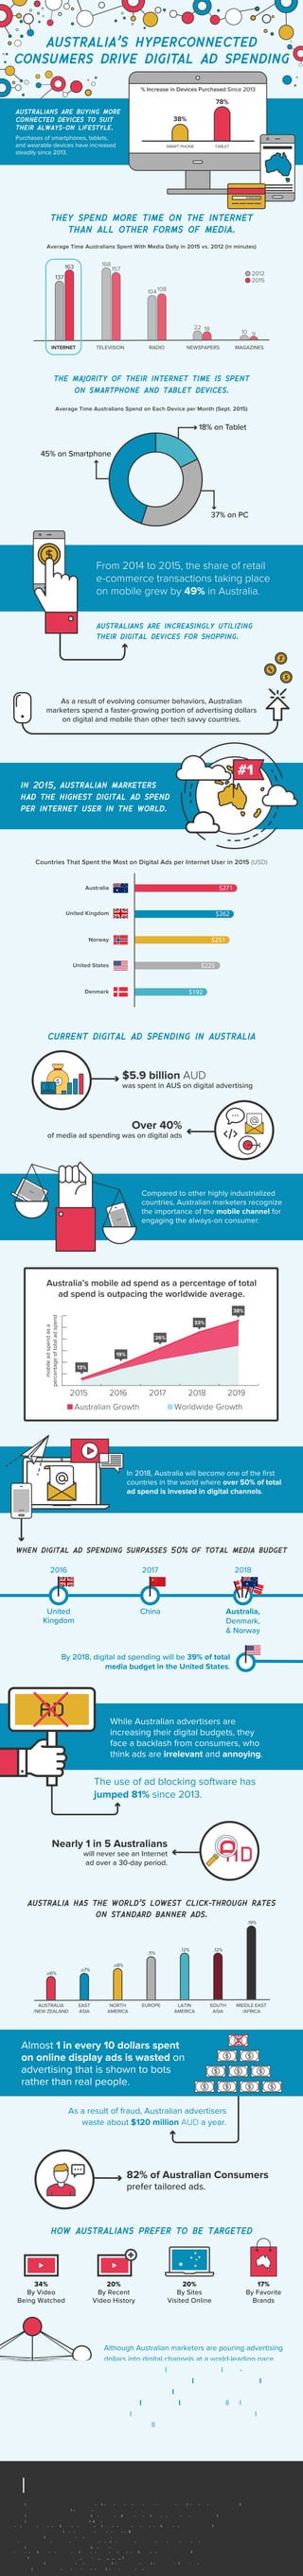
- 1. they spend more time on the internet than all other forms of media. the majority of their internet time is spent on smartphone and tablet devices. Although Australian marketers are pouring advertising dollars into digital channels at a world-leading pace, these ads often fail to engage the always-on consumer. To get more value from their digital investments, Australian marketers need better addressable media solutions that will help them be more relevant, target customers more precisely, and improve overall advertising efficiency. australians are increasingly utilizing their digital devices for shopping. Average Time Australians Spent With Media Daily in 2015 vs. 2012 (in minutes) Average Time Australians Spend on Each Device per Month (Sept. 2015) From 2014 to 2015, the share of retail e-commerce transactions taking place on mobile grew by 49% in Australia. in 2015, australian marketers had the highest digital ad spend per internet user in the world. Australia’s mobile ad spend as a percentage of total ad spend is outpacing the worldwide average. #1 INTERNET 163 137 TELEVISION 168 157 RADIO 108104 MAGAZINES 10 9 NEWSPAPERS 1822 2012 2015 Countries That Spent the Most on Digital Ads per Internet User in 2015 (USD) $271Australia United Kingdom Norway United States Denmark $262 $251 $225 $192 current digital ad spending in australia Over 40% of media ad spending was on digital ads $5.9 billion AUD was spent in AUS on digital advertising when digital ad spending surpasses 50% of total media budget United Kingdom Australia, Denmark, & Norway 2016 China 2017 2018 As a result of evolving consumer behaviors, Australian marketers spend a faster-growing portion of advertising dollars on digital and mobile than other tech savvy countries. In 2018, Australia will become one of the first countries in the world where over 50% of total ad spend is invested in digital channels. While Australian advertisers are increasing their digital budgets, they face a backlash from consumers, who think ads are irrelevant and annoying. 2015 2016 2017 2018 2019 Australian Growth Worldwide Growth mobileadspendasa percentageoftotaladspend 13% 19% 26% 33% 38% The use of ad blocking software has jumped 81% since 2013. SOURCES: http://totalaccess.emarketer.com/view/Chart/Average-Daily-Time-Spent-with-Media-Among-Consumers-Australia-2011-2017-minutes/171898?ECID=TA1000 http://www.criteo.com/resources/mobile-commerce-report/ http://totalaccess.emarketer.com/view/Chart/Digital-Ad-Spending-per-Internet-User-Worldwide-by-Country-2013-2018/167879?ECID=TA1000 http://totalaccess.emarketer.com/view/Chart/Mobile-Inter- net-Ad-Spending-Share-of-Total-Media-Ad-Spending-Worldwide-by-Country-2013-2019-of-total-media-ad-spending/167841?ECID=TA1000 http://prwire.com.au/pr/58326/online-ad-expenditure-poised-to-break-6-billion https://www.iabaustralia.com.au/research-and-resources/adver- tising-expenditure/item/11-advertising-expenditure/1995-iab-online-advertising-expenditure-report-quarter-ended-june-2015 http://totalaccess.emarketer.com/view/Chart/Digital-Ad-Spend- ing-Share-of-Total-Media-Ad-Spending-Worldwide-by-Country-2014-2019-of-total-media-ad-spending/176600?ECID=TA1000 http://downloads.pagefair.com/reports/2015_report-the_cost_of_ad_blocking.pdf https://www.iabaustralia.com.au/research-and-resources/nickable-charts/item/34-nickable-charts/1930-calendar-year-2015 https://integralads.com/news/ad-fraud-worth-120m-in-australia-fraud-detection-firm-estimates/ Nearly 1 in 5 Australians will never see an Internet ad over a 30-day period. Compared to other highly industrialized countries, Australian marketers recognize the importance of the mobile channel for engaging the always-on consumer. australia has the world’s lowest click-through rates on standard banner ads. NORTH AMERICA LATIN AMERICA EUROPE MIDDLE EAST /AFRICA AUSTRALIA /NEW ZEALAND EAST ASIA SOUTH ASIA .o6% .o7% .o8% .11% .12% .12% .19% australia’s hyperconnected consumers drive digital ad spending australians are buying more connected devices to suit their always-on lifestyle. Purchases of smartphones, tablets, and wearable devices have increased steadily since 2013. how australians prefer to be targeted % Increase in Devices Purchased Since 2013 TABLET 78% SMART PHONE 38% 18% on Tablet 45% on Smartphone 37% on PC 82% of Australian Consumers prefer tailored ads. 34% By Video Being Watched 20% By Sites Visited Online 17% By Favorite Brands 20% By Recent Video History As a result of fraud, Australian advertisers waste about $120 million AUD a year. Almost 1 in every 10 dollars spent on online display ads is wasted on advertising that is shown to bots rather than real people. By 2018, digital ad spending will be 39% of total media budget in the United States.