
Recommended
More Related Content
Similar to Descriptive Statistics.pptx
Similar to Descriptive Statistics.pptx (20)
Recently uploaded
Recently uploaded (20)
Descriptive Statistics.pptx
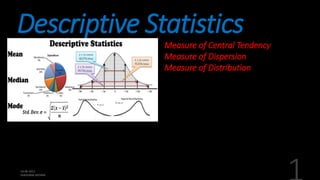
- 1. Descriptive Statistics Measure of Central Tendency Measure of Dispersion Measure of Distribution
- 2. Measure of Central Tendency: Ungrouped Data Provides information about the center or middle part of a group of numbers. Includes mean, median, mode, quartiles, percentiles etc.
- 3. Mode Most frequently occurring value in a set of data. Less popular than mean and median Use to find out the value with highest demand in business. How to determine the mode in a data set Order the values from minimum to maximum and locate the value which occurs the most. 3,4,5,5,6,6,6,6,6,7,7,7,8,8,9,9,9,10,10,11,12 Mode=6 3,4,5,5,5,5,6,6,6,6,8,8,9,9,9, 10, 11, 11, 12 Mode = 5 and 6 (Bimodal) 1,2,3,4,5,6,7,8,9,10,11,12,13,14,15,16,18 Mode = none
- 4. Median Middle value in an ordered array of numbers. For an array with an odd number of terms, the median is the middle number For an array with an even number of terms, the median is an average of the two middle numbers Steps to determine the median: Step1: Arrange the observation in an ascending/descending order Step2: For an odd number of terms, find the middle term Step3: For an even number of terms, the average of middle two terms
- 5. Median Example: Calculate the median of the following example: 34 72 39 55 24 26 75 23 35 51 82 66 69 85 56 70 76 89 26 41 Step1:Arrange inascendingorder 2324262634353941515556666970727576828589 Step2:Themiddlevaluesare55and56 Step3:Medianis(55+56)/2= 55.5 Median is not affected by theextreme values Median is not reflecting theinformation about all the numbers.
- 6. Mean Arithmetic mean is the average of a group of members. Computed by dividing the sum of the numbers by the total numbers.
- 8. Percentiles 99 values (dividers) which divide the data into 100 equal parts. nth percentile means that n % of the data is below than value. For example 87th percentile means 87% of the values are lower than this number. Percentiles are widely used in tests such as CAT, JEE, GRE etc. The results of these exams are reported in percentile form along with raw scores.
- 9. Quartiles Are measure of central tendency that divide a group of data into four equal parts. These quartiles are denoted as Q1, Q2 and Q3. Q1 is 25th percentile, Q2 is 50th percentile and Q3 is 75th percentile.
- 10. Measure of Variability- Ungrouped data Describe the dispersion or spread of the data set. Provides significant information along with measure of central tendency.
- 11. Range and Interquartile range Range is the difference between the largest value of a data set and the smallest value of the data set. Easy to compute Not considered as a good measure as it considers the extreme values of the dataset. Interquartile range is the difference between first quartile and third quartile of a dataset i.e. Interquartile Range = Q3 - Q1 It indicates the range of 50% of the dataset.
- 12. Mean Absolute deviation Average of the absolute values of the deviations around the mean for a set of numbers
- 13. Variation Average of the squared deviations from the mean for a set of numbers
- 14. Standard Deviation Square root of the variance
- 15. Chebyshev’s Theorem: Helps in estimating the approximate percentage of values that lie within a given number of standard deviation from the mean of a set of data if the data is normally distributed.
- 16. Chebyshev’s theorem statesthatatleast1–1/k2valueswillfallwithin+standarddeviationofthe meanregardlessoftheshapeofthedistribution Assuming the average weight of 56 kg and standard deviation of 10 kg. Estimate that how much proportion of the population lie within the range of mean + 2 * SD a. If the distribution is normal. b. If the distribution is not normal.
- 17. Z-Scores is a numerical measurement used in statistics of a value's relationship to the mean (average) of a group of values, measured in terms of standard deviation from the mean. If a Z-score is 0, it indicates that the data point's score is identical to the mean score. A Z-score of 1 would indicate a value that is one standard deviation from the mean. Z-scores may be positive or negative, with a positive value indicating the score is above the mean and a negative score indicating it is below the mean.
- 19. Coefficient of Variation Is the ratio of standard deviation to the mean expressed in percentage 𝐶𝑉 = 𝜎 𝜇 (100) CV is a relative comparison of a SD to the mean.
- 20. Skewness
- 21. Kurtosis
- 22. Mean – Grouped data
- 24. Box Plot Diagram
- 25. Thankyou