Framing an Appropriate Research Question 6b9b26d93da94caf993c038d9efcdedb.pdf
Yahoo's Organizational Overview and SWOT Analysis
1. 1 | P a g e
Introduction:
Organization Overview:
Yahoo was established in 1995 in Delaware and launched a highly successful initial public offering IPO
in April 1996. The founders of Yahoo David Filo and Jerry Yang were PhD candidates in electrical
engineering at Stanford University when they set up this company.Yahoo’s stock price rose to the high
of $120 in 2000 but 2009 has been trading under $14.
Now, Yahoo is the second leading global Internet brand and one of the most trafficked Internet
destinations worldwide. At present, Yahoo has offices in more than 25 countries, provinces, or
territories. In 2008 Yahoo’s revenues increased by 3.4 percent to $7.2 billion which was $6.9 billion in
2007. But their net income decreased by 35.7 percent to $424 million compare with 2007. We found that
the company owned and operated online properties and services. They also provide advertising offerings
and access to Internet users beyond Yahoo through its distribution network of third-party entities, who
have integrated its advertising offerings into their Web sites. Most importantly Yahoo generates
revenues by providing marketing services to advertisers across hundreds of Web sites. Yahooprovides
many of the services to users are free and charge fees for a range of premium services.
Yahoo’s core strategy and operations is to become the starting point for Internet users. To become the
starting point for Internet users they provide must-buy marketing solutions for the world’s largest
advertisers and also to deliver industry-leading open platforms that attract developers and publishers.
Vision and Mission:
Vision and mission statement of Yahoo is- “Yahoo powers and delights our communities of users,
advertisers, and publishers—all of us united in creating indispensable experiences, and fueled by trust.”
Excellence, Innovation, Customer Fixation, Teamwork, Community, and Fun those are the Company’s
code of morals.
2. 2 | P a g e
Organizational Chart:
Current situation:
Now, Yahoo is the second leading global Internet brand and one of the most trafficked Internet
destinations worldwide. At present, Yahoo has offices in more than 25 countries, provinces, or
territories. In 2008 Yahoo’s revenues increased by 3.4 percent to $7.2 billion which was $6.9 billion in
2007. But their net income decreased by 35.7 percent to $424 million compare with 2007. We found that
the company owned and operated online properties and services. They also provide advertising offerings
and access to Internet users beyond Yahoo through its distribution network of third-party entities, who
have integrated its advertising offerings into their Web sites. Most importantly Yahoo generates
CEO
Co-founder
and Chief
Yahoo
Co-founder
and Chief
Yahoo
Executive
vice
president,
General
Counsel
and
secretary
Executive VP
products &
Chief
Technology
Engineering
and Operation
Executive VP
North America
Chief
Marketing
Office Global
Marketing
Chief of
Human
Resource
3. 3 | P a g e
revenues by providing marketing services to advertisers across hundreds of Web sites. Yahoo provides
many of the services to users are free and charge fees for a range of premium services.
Products and Services:
Yahoo offers various services which include Yahoo Groups, Yahoo Answers, and Flickr and are
generally provided to users free of charge.
Yahoo search offers include Yahoo Search, Yahoo Local, Yahoo Yellow Pages and Yahoo Maps
those are available free to users.
It also provides marketing services to advertisers across hundreds of web sites.
The Yahoo Communications includes Yahoo Mail, Zimbra Mail, and Yahoo Messenger those
provide a wide range of communication services to users.
Strategy of Yahoo:
Yahoo’s core strategy is to become the starting point for Internet users. To become the starting point for
Internet users they provide must-buy marketing solutions for the world’s largest advertisers and also to
deliver industry-leading open platforms that attract developers and publishers.
Existing Strategies:
Horizontal Integration: Analyzing the case we found that Yahoo try to increase control over the
competitors. They have resumed discussion with Microsoft about search and advertising partnerships as
both company struggles to compete with Google.
Market development: At present, Yahoo has offices in more than 25 countries, provinces, or territories.
In 2008 Yahoo’s revenues increased $7.2 billion by 3.4 percent which was $6.9 billion in 2007.
Market Penetration: According to the case, Yahoo owned and operated online properties and services.
They also provide advertising offerings and access to Internet users beyond Yahoo through its
distribution network of third-party entities, who have integrated its advertising offerings into their Web
sites.
4. 4 | P a g e
Products development: Most importantly Yahoo generates revenues by providing marketing services
to advertisers across hundreds of Web sites. Yahoo provides many of the services to users are free and
charge fees for a range of premium services.
Internal Factors Analysis:
As we know Internal factors analyze or audit requires gathering and assimilating information about the
firm’s management, marketing, finance, productions/operations, research and development, and
management information system.
Management function:
We know function of management includes:-
1. Planning: Yahoo’s core strategy is to become the starting point for Internet users. To become the
starting point for Internet users they provide must-buy marketing solutions for the world’s largest
advertisers and also to deliver industry-leading open platforms that attract developers and publishers.
2. Organizing: Yahoo organizing their departments quite good that’s why their revenues is increased
10% in 2007 to 2008.
3. Motivating: They should take some steps to motivate the employees. We know without employees
motivates the company cannot implement or achieve their goals.
4. Staffing: Analyzing the case we found that Yahoo has been extensively reducing its workforce
because of profit decline. They eliminated 675 employees at 1st quarter of 2009 and at the end of 2009
they also eliminated 700 employees.
5. Controlling: To increase the profit and reduced the cost Yahoo closed its third video property, Maven
Network based in Cambridge Massachusetts and also they plan to close twenty video services.
Internal Factors Evaluation (IFE) Matrix:
We know Internal Factors Evaluation (IFE) Matrix helps to evaluate the major strengths and weaknesses
in the functional areas of a business.
5. 5 | P a g e
Strengths:
1. one of the most important strength of Yahoo is it has reputation among the search engine business and
it is the second leading internet brand in the industry.
2. Yahoo offers various services which include Yahoo Groups, Yahoo Answers, and Flickr and are
generally provided to users free of charge.
3. It also provides marketing services to advertisers across hundreds of web sites.
4. In 2008 Yahoo’s revenues increased by 3.4 percent from 2007.
5. Aggressive cost cutting allowed to Yahoo to increase the profits.
6. Yahoo’s market capacity, revenue, operating margin ratios is above the industry benchmark.
Weaknesses:
1. According to the case, Net Income of Yahoo in 2008 was $ 424,298 million which is 77% lesser
compared to net income in 2006.
2. It generates more revenues but because of its overall advertising spend the net income is goes down.
3. In 2008 its current ratio, net profit margin, earning per share, total assets turnover ratios is lower than
the 2006.
4. Yahoo only possessed 17 percent of internet traffic where their main competitors Google has 72
percent.
5. Yahoo closed its third video property, Maven Network based in Cambridge Massachusetts and they
plan to close twenty video services which includes network site Yahoo! 360 and its Web hosting service
GeoCities.
6. 6 | P a g e
Key Internal Factors Weight Rating Weighted
Score
Strengths
1. In the search engine business Yahoo is the second leading
internet brand in the industry.
0.08 3 0.24
2. Yahoo offers various services which include Yahoo Groups,
Yahoo Answers, and Flickr and are generally provided to users
free of charge.
0.09 4 0.36
3. It also provides marketing services to advertisers across
hundreds of web sites.
0.10 3 0.30
4. In 2008 Yahoo’s revenues increased by 3.4 percent from 2007. 0.07 3 0.21
5. Aggressive cost cutting allowed to Yahoo to increase the
profits.
0.08 4 0.32
6. Yahoo’s market capacity, revenue, operating margin ratios is
above the industry benchmark.
0.08 3 0.24
Weaknesses
1. According to the case, Net Income of Yahoo in 2008 was $
424,298 million which is 77% lesser compared to net income in
2006.
0.10 1 0.10
2. It generates more revenues but because of its overall advertising
spend the net income is goes down.
0.09 2 0.18
3. In 2008 its current ratio, net profit margin, earning per share,
total assets turnover ratios is lower than the 2006.
0.12 1 0.12
4. Yahoo only possessed 17 percent of internet traffic where their
main competitor Google has 72 percent.
0.10 1 0.10
5. Yahoo closed its third video property, Maven Network and they
plan to close twenty video services which includes network site
Yahoo! 360 and its Web hosting service GeoCities.
0.09 2 0.18
Total 1.00 2.35
7. 7 | P a g e
External Factors Analysis:
The purpose of an external factors analysis is to find out the list of opportunities that could benefit a firm
and threats that should be avoided.
Opportunity:
1. In the Internet search business industry, Yahoo is the second most leading worldwide internet
brand.
2. Yahoo improved identification that customers use additional of their time online.
3. Another opportunity for Yahoo is in USA, $ 23 billion revenue from Internet advertisement
remains them strong.
4. Until 2006 there are 1.1 billion internet user around the world and 211 million in USA.
5. The increasing numbers of Internet users are now spend huge time in the online.
Threats:
1. Due to economic recession the development of economy has been slowed in the USA and
globally.
2. Internet media and market research firm comScoreInc, uttered concerns about deceleration in
online growth.
3. At some stage in 2008, Google had 72% of internet passage whereas Yahoo only haunted 17%
of internet passage.
4. Yahoo works with the internet products, services and substance markets. And that is incredibly
aggressive and characterize by quick transform, converging technologies and growing
opposition.
5. Increasing strength of competitors: In internet ear, Google, Microsoft, Amazon.com, EBay,
Monster.com, MySpace, Facebook, and YouTube are the more than Yahoo. We can see that
Google 50% people at present. But Yahoo user men are 29%.
6. More Internet related businesses: At present all most work are complete by internet. As a result
many internet related company are increasing which is a threat for yahoo.
7. Rapidly technology changes: For changing technology rapidly, it is difficult to be up to date all
the time. And changing legislative, Man can not to use internet easily.
8. 8 | P a g e
8. The search engine industry has low barrier entry, technical and regulatory makes it easier for
new firms to enter the industry.
External Factor Evaluation (EFE) Matrix:
We know External Factor Evaluation Matrix allows summarize and evaluate a firm external
opportunities and threats. Here we evaluate the Yahoo’s external opportunities and threats:-
Key External Factors Weight Rating Weighted
Score
Opportunities:
1. In the Internet search business industry, Yahoo is the second
most leading worldwide internet brand.
0.08 3 0.24
2. Yahoo improved identification that customers use additional
of their time online.
0.10 2 0.20
3. Another opportunity for Yahoo is in USA revenue from
Internet advertisement remains them strong.
0.10 4 0.40
4. Until 2006 there are 1.1 billion internet user around the world
and 211 million in USA.
0.07 3 0.21
5. The increasing numbers of Internet users are now spend huge
time in the online.
0.08 4 0.32
Threats:
6. Due to economic recession the development of economy has
been slowed in the USA and globally.
0.08 3 0.24
7. Internet media and market research firm comScoreInc, uttered
concerns about deceleration in online growth.
0.10 3 0.30
8. At some stage in 2008, Google had 72% of internet passage
whereas Yahoo only haunted 17% of internet passage.
0.12 4 0.48
9. Increasing strength of competitors 0.10 3 0.30
9. 9 | P a g e
10. It is difficult to be up to date all the time because technology
is changing rapidly.
0.08 3 0.24
11. The search engine industry has low barrier entry, technical
and regulatory makes it easier for new firms to enter the
industry.
0.09 4 0.36
Total 1.00 3.29
Porter’s Five forces Model:
We know Porter’s five forces model of competitive analysis is a widely used approach for developing
strategies many industries. The Porter’s five forces discussed below:
1. Rivalry among competing firms: According to the case we found that Google has 72% of Internet
traffic on the other hand Yahoo only possessed 17% followed by MSN at 6% and IACI at 4%. Another
fact is that Google has 42% of search engine utilization compared to Yahoo which has 23.8%. Yahoo’s
another vital competitors Microsoft has a strong desire to increase its internet presence. Their main
competitors Google has expanded well beyond search related functions into areas such as e-mail
(Gmail), mapping (Google Maps), web-based productivity applications (Google Apps), a finance
offering (iGoogle), a mobile Internet software platform(Android) and browser software(Google
Chrome).
2. Potential entry of new competitor: The search engine industry has low barrier entry, technical and
regulatory makes it easier for new firms to enter the industry. By analyzing the case we found that there
are 1.1 billion internet users around the world and also internet advertisement generates more revenue
which is encouraged to new entries to enter in the industry.
3. Potential development of substitute products: The industry has more potential substitute products.
From the case we know that there are top 25 Internet properties exist including Yahoo, Google and so on
provides internet search engine services.
4. Bargaining power of Suppliers: Yahoo should pursue a backward integration strategy to gain control
or ownerships of suppliers.
10. 10 | P a g e
5. Bargaining power of Buyers: According to the case, there are more than 20 Internet properties
existing in the industry which provide internet search engine services. So, customers have plenty of
option, they can switch to competing brands or substitutes product.
CPM (competitive profile matrix):
We know CPM identifies a firm’s major competitors and its strength and weakness. For understanding
the external environment and the competition in a particular industry, they use CPM. It finds out firm’s
key competitors and then compares with firm’s critical success factors. Like advertising, product quality,
market share etc. As it compares the strengths and weakness, firm should know which area they need to
improve and which need to protect. In CPM rating refers to strength and weakness where,
a) 4= major strength
b) 3= minor strength
c) 2= minor weakness
d) 1= major weakness
In this case we found Yahoo’s main competitor is Google. They have another competitors like MSN,
AOL, Microsoft, ASK and other but bigger competitor is Google.
Google is a top web property in all major global markets today. It is a big name in international market
and most of the people choose Google then the other sites like Yahoo! Reason is Google provides very
speedy results.
Now we are going to make CPM between Yahoo and Google:
Critical success
factor
Yahoo Google
weight Rating Score Rating Score
Advertisement 0.05 2 0.10 3 0.15
Online product and 0.10 3 0.30 4 0.40
11. 11 | P a g e
service
Market share 0.20 2 0.40 4 0.80
Number of
advertisement member
0.10 2 0.20 4 0.40
Earnings per share 0.15 2 0.30 3 0.45
Global leader and
technology
0.25 2 0.50 4 1.00
Brand reputation 0.15 4 0.60 4 0.60
Total 1.00 2.40 3.80
The weight ranging from .0-1.0 means low impotence to high importance. And this number indicates
how important the factor is.
In CPM of Yahoo’s is the strongest in only “brand reputation” because it indicated by rating 4 where
Google is strong in “online product service, Market shares, number of advertisement member, brand
reputation and global technology” it also indicated by rating 4. Yahoo has so many minor weaknesses
and that’s why they got 2 ratings. Still they have no major weakness. But in overall analysis Google is
stronger than Yahoo because Google’s total weighted score is 3.8 where Yahoo got 2.4 score.
Financial Analysis:
Yahoo’s revenue was $23.4 billion in 2008 which is record and exceeded 2007’s performance. The
company’s former record was $21.2 billion that means revenue increased 10.6% in 2008. But because of
their overall advertising spending the net income is decreased. Here, by analyzing various ratios we are
analyzing the company’s financial performance.
12. 12 | P a g e
Liquidity Ratios:
Liquidity ratios measure a firm’s ability to meet maturing short-time obligations. It is one of the vital
ratios to know the organization's position.
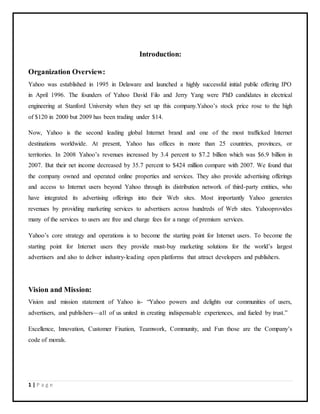
1. Current Ratio: Current assets / Current liabilities.
Current Ratio (2006) = $ 3,750,142 / $ 1,473,994
= 2.54 times
Current Ratio (2007) = $ 3,237,722 / $ 2,300,448
= 1.41 times
Current Ratio (2008) =$ 4,745,498 / $ 1,705,015
= 2.78 times
Interpretation: We know, current ratio measures the company’s ability to pay off its current liabilities.
Here we can see that Yahoo’s current ratio is above 1 that means by these current assets they can meet
current liabilities.
5.54
1.41
2.78
0
1
2
3
4
5
6
2006 2007 2008
Current Ratio
Current Ratio
13. 13 | P a g e
2. Quick Ratio: (Current assets-Inventory) or (Cash and equivalents + Marketable securities +
Account receivables) / Current liabilities
Quick Ratio (2006) = $ (3,750,142 –217,779) / $ 1,473,994
= 2.40 times
Quick Ratio (2007) = $ (3,237,722- 180,716) / $ 2,300,448
= 1.33 times
Quick Ratio (2008) = $ (4,745,498 – 233,061) / $ 1,705,015
= 2.67 times
Interpretation: Quick ratio measures which a firm can meet its short-term liabilities without relying
upon the sale or revenue of its inventory. In 2006 the Yahoo’s quick ratio was 2.4 times and in 2007 it’s
goes down. But in 2008 quick ratio again increase and all three years their quick ratio was above 1.5
which is good enough expect 2007.
2.4
1.33
2.67
0
0.5
1
1.5
2
2.5
3
2006 2007 2008
Quick Ratio
Quick Ratio
14. 14 | P a g e
Leverage Ratios:
We know, Leverage ratios measure the extent to which a firm has been financed by debt.
1. Debt-to-Total-Assets Ratio: Total Debt / Total Assets
Debt-to-Total-Assets Ratio (2006) = $2,352,998 / $11,513,608
= 20.44%
Debt-to-Total-Assets Ratio (2007) = $ 2,696,910 / $ 12,229,741
= 22.05%
Debt-to-Total-Assets Ratio (2008) = $ 2,438,906 / $ 13,689,848
= 17.81%
Interpretation: Debt-to-Total-Assets Ratio represents the percentage of total funds that are provided by
creditors. From the chart we can see that 17.81% funds collected from creditors out of total funds in
2008 which is less than the other two years 2006 and 2007.
20.44%
22.05%
17.81%
0.00%
5.00%
10.00%
15.00%
20.00%
25.00%
2006 2007 2008
Debt-to-Total-Assets Ratio
Debt-to-Total-Assets Ratio
15. 15 | P a g e
2. Debt-to-Equity Ratio: Total debt / Total stockholders’ equity
Debt-to-Equity Ratio (2006) = $2,352,998 / 9,160,610
= 25.68%
Debt-to-Equity Ratio (2007) = $ 2,696,910 / 9,532,831
= 28.29%
Debt-to-Equity Ratio (2008) = $ 2,438,906 / 13,689,848
= 17.81%
Interpretation:Debt-to-Equity Ratio measures the percentage of total funds provided by creditors
versus by owners. In 2006, 2007 and 2008 respectively 25.68%, 28.29 and 17.81% funds collected from
creditors comparing with owners or stockholders.
Activity Ratios:
1. Total Assets Turnover: Sales / Total Assets
Total Assets Turnover (2006) = 6,425,679 / 11,513,608
= 0.56 times
Total Assets Turnover (2007) = 6,969,274 / 12,229,741
= 0.57 times
Total Assets Turnover (2008) = 7,208,502 / 13,689,848
25.68%
28.29%
17.81%
0.00%
10.00%
20.00%
30.00%
2006 2007 2008
Debt-to-Equity Ratio
Debt-to-Equity Ratio
16. 16 | P a g e
= 0.53 times
Interpretation: We know, Total Assets Turnover measure whether a firm is generating a sufficient
volume of business for the size of its assets investment. In 2006 their Total Assets Turnover was 0.56
times that means every 0.56 times they are generating revenue from assets investment. In 2007 the total
assets turnover was increased but 2008 it fall down.
Profitability Ratio:
1. Net Profit Margin: Net Income / Sales
Net Profit Margin (2006) = $751,391 / $6,425,679
= 11.70%
Net Profit Margin (2007) = 660,000 / 6,969,274
= 9.47%
Net Profit Margin (2008) = $424,298 / $7,208,502
= 5.89%
0.56
0.57
0.53
0.5
0.52
0.54
0.56
0.58
2006 2007 2008
Total Assets Turnover
Total Assets Turnover
17. 17 | P a g e
Interpretation: We know net profit margin shows how many percent revenues or sales they can convert
to net income or profit. Here we can see that Yahoo in 2006 their net profit was 11.70% which is quite
good but after that their profit margin goes down which is threated for them. In 2008 their profit margin
only 5.89%.
2. Return on Total Assets: Net Income / Total Assets
Return on Total Assets (2006) = $751,391 / $11,513,608
= 6.53%
Return on Total Assets (2007) = $660,000 / $12,229,741
= 5.40%
Return on Total Assets (2008) = $424,298 / $13,689,848
= 3.1%
11.70%
9.47%
5.89%
0.00%
5.00%
10.00%
15.00%
2006 2007 2008
Net Profit Margin
Net Profit Margin
6.53%
5.40%
3.10%
0.00%
2.00%
4.00%
6.00%
8.00%
2006 2007 2008
Return on Total Assets
Return on Total Assets
18. 18 | P a g e
Interpretation:As we know Return on Total Assets ratio measure how efficiently a company can
manage its assets to produce profits. In 2006 ROA was 6.53% but after that it was decreased
dramatically which is almost half in 2008 compare with 2006. That means Yahoo cannot manage its
assets effectively to make profit.
3. Return on Stockholders’ Equity: Net Income/ Total stockholders’ equity
Return on Stockholders’ Equity (2006) = 751,391 / 9,160,610
= 8.20%
Return on Stockholders’ Equity (2007) = 660,000 / 9,532,831
= 6.92%
Return on Stockholders’ Equity (2008) = 424,298 / 11,250,942
= 3.77%
Interpretation:As we know Return on Equity measures a company’s profitability by revealing how
much profit a company generates with the money shareholders have invested. By analyzing Yahoo’s
ROE we found that in 2006 their position was good enough but in 2008 it’s decreased huge.
8.20%
6.92%
3.77%
0.00%
2.00%
4.00%
6.00%
8.00%
10.00%
2006 2007 2008
Return on Stockholders’ Equity
Return on Stockholders’
Equity
19. 19 | P a g e
4. Earnings Per Share (EPS): Net income / Number of shares of common stock outstanding
Earnings per Share (2006) = $ 0.52
Earnings per Share (2007) = $ 0.47
Earnings per Share (2008) = $ 0.29
Interpretation: From 2006 to 2008 the company’s net income is decreased very badly. That’s why their
earning per share decrease every year. In 2006 it was $0.56 which is decreased it 2007 & 2008 both
years.
Total Observation: Yahoo passes very tough time in internet-search business industry. In 2008 the
company’s all kinds of ratio trend is backward. In 2008 their net income is $424,298 which was
$751,391 in 2006 that means within 2 years their net income decreased almost 50% which is serious
threated for them.
Revenues by groups of similar service:
Yahoo makes good amount of revenues from owned and operate sites, affiliate sites, marketing service
and fees. In 2006 they make $6.4 million and 2008 it increased which is $7.2 million. From marketing
service they make more revenue which is 88% of its total group of similar service revenues.
SWOT Matrix:
We know the Strengths-Weaknesses-Opportunities-Threats (SWOT) Matrix is an important matching
tool that helps managers develop four types of strategies those are- SO (Strengths-Opportunities), WO
(Weaknesses-Opportunities), ST (Strengths-Threats), and WT (Weaknesses-Threats) strategies.
Strengths
1. Yahoo has reputation
among the search engine
business and it is the second
leading internet brand in the
industry.
2. Yahoo offers various
Weaknesses
1. According to the case, Net
Income of Yahoo is decreased
every year.
2. The net income is goes
down because of Its overall
advertising spend.
20. 20 | P a g e
services to users free of
charge.
3. It also provides marketing
services to advertisers across
hundreds of web sites.
4. In 2008 Yahoo’s revenues
increased by 3.4 percent from
2007.
5. Aggressive cost cutting
allowed to Yahoo to increase
the profits.
3. In 2008 its current ratio, net
profit margin, earning per
share, total assets turnover
ratios is lower than the 2006.
4. Yahoo only possessed 17
percent of internet traffic
5. Yahoo closed its third video
property.
Opportunities
1. Yahoo improved
identification that customers
use additional of their time
online.
2. Another opportunity for
Yahoo is in USA revenues
from Internet advertisement
remains them strong.
3. Until 2006 there are 1.1
billion internet user around the
world and 211 million in
USA.
4. The increasing numbers of
Internet users are now spend
huge time in the online.
SO Strategies
1. Improving the service
planning to lead the market.
(S1, S2, S3, O1, O4,O5)
2. Increasing marketing
service to the advertisers. (S3,
S4, O2, O3)
3. Invest to cope up with
advance technology and
attract to customers. (S1, S2,
O1, O3, O4)
WO Strategies
1. Control the cost to increase
the revenue. (W1, W2, W3,
W5, O3. O4).
2. Try to negotiate with
Microsoft to lead the
market.(W3, W4, O1, O2, O3)
Threats
1. Due to economic recession
the development of economy
ST Strategies
1. Introduced new products
and service to increase market
WT Strategies
1. Increase service and
product promotion. (W4, T1,
21. 21 | P a g e
has been slowed in the USA
and globally.
2. Concerns about deceleration
in online growth.
3. At some stage in 2008,
Google had 72% of internet
passage whereas Yahoo only
haunted 17% of internet
passage.
4. The search engine industry
has low barrier entry,
technical and regulatory
makes it easier for new firms
to enter the industry.
share. (S1,S2,S5, T1, T3, T4)
2. Attract the new customers.
(S1, S2, T2,T3)
T3)
2. Reduced the cost and follow
low cost strategy. (W1,W2,
W3, W5, T1, T4)
Finding and Recommendations:
Finding:
1. Yahoo’s current ratio, Net profit Margin, Total Assets turnover, Debt ratio, ROE and ROA ratios
trend is backward.
2. Yahoo’s stock price is goes down. In 2000 which was $120 but in 2009 it has traded under $14.
3. Their revenues increased in 2008 by 3.4 percent from 2007 but their net income decreased because of
operating expenses is high.
4. By Analyzing the case we found that Yahoo’s main competitor is Google which has 72 percent of
Internet traffic where Yahoo has only 17 percent.
5. They are trying to merger with Microsoft about search and advertising partnerships as both company
struggles to compete with Google.
22. 22 | P a g e
6. We also found that in 2009 aggressive cost cutting allowed them to increase the profit 7 percent.
7. Yahoo offers various services which include Yahoo Groups, Yahoo Answers, Flickr, search offering
includes Yahoo search, and Yahoo Local, Yahoo Yellow pages, Yahoo Maps and their communications
segment include Yahoo Mail, Zimba Mail and generally provide those services to users free of charge.
8. It also provides marketing services to advertisers across hundreds of web sites which is make huge
profit and they also have more opportunity to make profit from these services.
9. The search engine industry has low barrier entry, technical and regulatory makes it easier for new
firms to enter the industry.
10. Another opportunity for Yahoo is in USA revenues from Internet advertisement remains them
strong.
Recommendations:
1. Yahoo should control their operating and other cost especially the advertising cost. Then they will
make more profit.
2. They should continue discussions with Microsoft about search and advertising partnerships to
compete with Google.
3. They should formulate new strategy and implement it for competing with the existing competitors as
well as the new competitors.
4. They should utilize their opportunities to take effective actions. Their main opportunity is- the
increasing numbers of Internet users are now spend huge time in the online.
5. Yahoo offers various services and they also have good reputation insearch engine business industry.
So, they should utilize their goodwill effectively and efficiently.
Conclusion:
Yahoo was established in 1995 in Delaware and launched a highly successful initial public offering IPO
in April 1996. Now, Yahoo is the second leading global Internet brand and one of the most trafficked
23. 23 | P a g e
Internet destinations worldwide. Yahoo’s core strategy and operations is to become the starting point for
Internet users. To become the starting point for Internet users they provide must-buy marketing solutions
for the world’s largest advertisers and also to deliver industry-leading open platforms that attract
developers and publishers.
The company owned and operated online properties and services. Most importantly Yahoo generates
revenues by providing marketing services to advertisers across hundreds of Web sites. Many of the
services Yahoo provides to users are free; it does charge fees for a range of premium services. In 2008
Yahoo’s revenues increased by 3.4 percent to $7.2 billion which was $6.9 billion in 2007. But their net
income decreased by 35.7 percent to $424 million compare with 2007. Yahoo’s current ratio, Net profit
Margin, Total Assets turnover, Debt ratio, ROE and ROA ratios trend is backward. They are trying to
merger with Microsoft about search and advertising partnerships as both company struggles to compete
with Google. We also found that in 2009 aggressive cost cutting allowed them to increase the profit 7
percent.We would like to say that if they overcome their weaknesses, faces the threats effectively and
utilize their opportunities and strengths, they will become a one of the market leader in the industry.
References:
1. David F.R (2011) Strategic Management concepts and cases. Thirteenth edition.Prentice Hall. Case 4-
AirTran Airways, Inc.-2009.