
Recommended
Recommended
More Related Content
Viewers also liked
Viewers also liked (16)
Similar to Mongolian economy as of april 2015 (nso go m)
Similar to Mongolian economy as of april 2015 (nso go m) (20)
More from Serod Ichinkhorloo
More from Serod Ichinkhorloo (16)
Recently uploaded
Recently uploaded (20)
Mongolian economy as of april 2015 (nso go m)
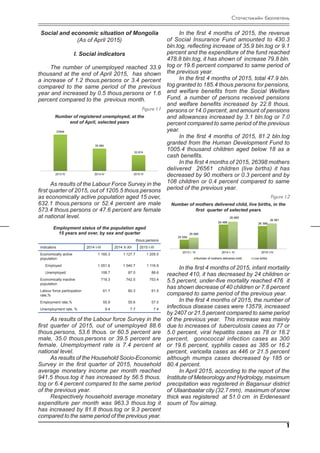
- 1. 1 Ñòàòèñòèêèéí áþëëåòåíü Social and economic situation of Mongolia (As of April 2015) I. Social indicators The number of unemployed reached 33.9 thousand at the end of April 2015, has shown a increase of 1.2 thous.persons or 3.4 percent compared to the same period of the previous year and increased by 0.5 thous.persons or 1.6 percent compared to the previous month. Figure I.1 Figure I.2 Number of registered unemployed, at the end of April, selected years Number of mothers delivered child, live births, in the first quarter of selected years As results of the Labour Force Survey in the first quarter of 2015, out of 1205.5 thous.persons as economically active population aged 15 over, 632.1 thous.persons or 52.4 percent are male 573.4 thous.persons or 47.6 percent are female at national level. In the first 4 months of 2015, the revenue of Social Insurance Fund amounted to 430.3 bln.tog, reflecting increase of 35.9 bln.tog or 9.1 percent and the expenditure of the fund reached 478.8 bln.tog, it has shown of increase 79.8 bln. tog or 19.6 percent compared to same period of the previous year. In the first 4 months of 2015, total 47.9 bln. tog granted to 185.4 thous.persons for pensions, and welfare benefits from the Social Welfare Fund, a number of persons received pensions and welfare benefits increased by 22.8 thous. persons or 14.0 percent, and amount of pensions and allowances increased by 3.1 bln.tog or 7.0 percent compared to same period of the previous year. In the first 4 months of 2015, 81.2 bln.tog granted from the Human Development Fund to 1005.4 thousand children aged below 18 as a cash benefits. In the first 4 months of 2015, 26398 mothers delivered 26561 children (live births) it has decreased by 90 mothers or 0.3 percent and by 108 children or 0.4 percent compared to same period of the previous year. 37646 35 084 33 874 2013 IV 2014 IV 2015 IV Employment status of the population aged 15 years and over, by sex and quarter thous.persons Indicators 2014 I-III 2014 X-XII 2015 I-III Economically active population 1 160.3 1 127.7 1 205.5 Employed 1 051.6 1 040.7 1 116.9 Unemployed 108.7 87.0 88.6 Economically inactive population 719.3 742.5 753.4 Labour force participation rate,% 61.7 60.3 61.5 Employment rate,% 55.9 55.6 57.0 Unemployment rate, % 9.4 7.7 7.4 As results of the Labour force Survey in the first quarter of 2015, out of unemployed 88.6 thous.persons, 53.6 thous. or 60.5 percent are male, 35.0 thous.persons or 39.5 percent are female. Unemployment rate is 7.4 percent at national level. As results of the Household Socio-Economic Survey in the first quarter of 2015, household average monetary income per month reached 941.5 thous.tog it has increased by 56.5 thous. tog or 6.4 percent compared to the same period of the previous year. Respectively household average monetary expenditure per month was 963.3 thous.tog it has increased by 81.8 thous.tog or 9.3 percent compared to the same period of the previous year. 25 559 26 488 26 398 25 685 26 669 26 561 2013 I- IV 2014 I- IV 2015 I-IV Number of mothers delivered child, live births, in the first 4 months of selected years Number of mothers delivered child Live births In the first 4 months of 2015, infant mortality reached 410, it has decreased by 24 children or 5.5 percent, under-five mortality reached 476 it has shown decrease of 40 children or 7.8 percent compared to same period of the previous year. In the first 4 months of 2015, the number of infectious disease cases were 13579, increased by 2407 or 21.5 percent compared to same period of the previous year. This increase was mainly due to increases of tuberculosis cases as 77 or 5.0 percent, viral hepatitis cases as 78 or 18.2 percent, gonococcal infection cases as 300 or 19.6 percent, syphilis cases as 385 or 16.2 percent, varicella cases as 446 or 21.5 percent although mumps cases decreased by 185 or 80.4 percent. In April 2015, according to the report of the Institute of Meteorology and Hydrology, maximum precipitation was registered in Baganuur district of Ulaanbaatar city (32.7 mm), maximum of snow thick was registered at 51.0 cm in Erdenesant soum of Tov aimag.
- 2. Ñòàòèñòèêèéí áþëëåòåíü 2 In April 2015, Shinejinst soum of Bayankhongor aimag had the highest air temperature (33.0°C), while Tsetsen-Uul soum of Zavkhan aimag had the lowest air temperature (-29.0°C). Maximum wind speed reached 28 m/ sec in Bugat soum of Govi-Altai aimag. Asmeasuredbyover10airqualitymonitoring stations, the average daily concentration of nitrogen dioxide and sulfur dioxide exceeded by 23-29 times and dust content with less than 2.5 and 10 micron in the atmosphere of Ulaanbaatar exceeded the maximum acceptable level by 9-26 times. In the first 4 months of 2015, 1957 disasters and accidents occurred. As a result, 43 people died, 126.6 thous.head livestock and animals were lost. There were reported 1658 construction fires and 104 animal madness diseases. Estimated damage caused by the construction fires amounted to 4.3 bln.tog, by animal madness diseases 24.7 mln.tog and total expenditure for disasters and accidents was 62.2 mln.tog. In the first 4 months of 2015, 25 persons died from fires of consruction, 7 people from drowning in rivers and lakes, 6 people from mining and rock falls artisanal, 3 people from a heavy fall of snow and severe storms, 1 people from fires of forest and slug firearms accidents respectively. The occurance of disaster and accidents increased by 197, compared to same period of previous year. At the national level, 10451 crimes were registered in the first 4 months of 2015, shows an increase of 1332 crime or 14.6 percent compared to same period of the previous year. This increase was mainly due to number of crime against the right of ownership (1027), inflicted injury to someone’s body (116), crimes against the rules of safety of traffic and use of motor vehicles (111), economic crimes (73) compared to same period of the previous year. GDP by production approach reached 4525.7 bln.tog at current price and 2854.9 bln.tog at 2010 constant price in the first quarter of 2015, up 9.4 percent at current price and 4.4 percent at constant price compared with the same period of the previous year. GDP by expenditure approach reached 4540.3 bln.tog at current price, 2921.9 bln.tog at 2010 constant price in the first quarter of 2015, up 10.0 percent at current price and 4.4 percent at constant price compared with the same period of the previous year. According to report of the Bank of Mongolia, money supply (broad money or M2) reached to 9.7 trill.tog at the end of April 2015, decreased by 198.7 bln.tog or 2.0 percent from the previous month, decreased by 498.3 bln.tog or 4.9 percent compared to same period of the previous year. Table II.1 Money indicators, at end of March of selected years, bln.tog Indicators 2014 IV 2015 III 2015 IV Money М2 10 203.3 9 903.7 9 705.0 Time deposit total 7 192.8 7 370.3 7 203.4 Time deposit in DC 5 740.0 5 187.7 5 115.1 Time deposit in FC 1 452.8 2 182.6 2 088.3 Total loans outstanding 11 737.7 12 270.5 12 296.7 Principal in arrears 299.0 559.6 587.8 Non-performing loans 616.2 703.0 747.0 Rate of principal in arrears in total loans outstanding 2.5 4.6 4.8 Rate of non-performing loans in total loans outstanding 5.2 5.7 6.1 At the end of April 2015, currency issued in circulation reached 734.9 bln.tog decreased by 32.1 bln.tog or 4.6 percent from the previous month and by 106.7 bln.tog or 12.7 percent compared to same period of the previous year. Loans outstanding amounted to 12.3 trill. tog, at the end of April 2015, it has increased by 26.3 bln.tog or 0.2 percent from previous month and increased by 559.0 bln.tog or 4.8 percent compared to same period of the previous year. Principals in arrears reached 587.8 bln.tog at the end of April 2015, increased by 28.1 bln. tog or 5.0 percent from previous month, by 288.8 bln.tog or 2.0 times compared to same period of the previous year. At the end of April 2015, the non-performing loans over the bank system reached 747.0 bln. tog, increased by 44.1 bln.tog or 6.3 percent from the previous month, by 130.9 bln.tog or 21.2 percent compared to same period of the previous year. In the first 4 months of 2015, 15.4 тln.shares were traded valued at 431.2 bln.tog in the stock market. The securities trading was increased by 372.0 bln.tog or 7.3 times and shares increased by 280.7 thous.shares or 1.9 percent compared to same period of the previous year. Totally 3874 persons have injured and 406 persons died caused by crimes. The number of injured has increased by 545 or 16.4 percent and the death cases has increased by 54 persons or 15.3 percent compared to same period of the previous year. Figure I.3 Number of committed offences, in the first 4 months of selected years 8 378 9119 10451 2013 I- IV 2014 I- IV 2015 I-IV
- 3. 3 Ñòàòèñòèêèéí áþëëåòåíü In the first 4 months of 2015, total equilibrated revenue and grants of the General Government Budget amounted to 1675.0 bln.tog and total expenditure and net lending amounted to 1919.8 bln.tog, representing a deficit of 244.8 bln.tog in the equilibrated balance. Figure II.3 Total turnover of foreign trade in the first 4 months of selected years, mln.USD Total external trade turnover decreased 471.8 mln.US dollars or 15.9 percent of the total, imports decreased by 491.9 mln.US dollars or 32.2 percent but exports increased by 20.1 mln. US dollars or 1.4 percent compared to same period of the previous year. External trade balance showed a deficit of 94.0 mln.US dollars in the first 4 months of 2014, while it was in surplus of 418.0 mln.US dollars in the first 4 months of 2015. Table II.2 Exports by some commodities, as, a first quarter of last 3 years, thous.t 2014 I-IV 2015 I-IV 2015 I-IV 2014 I-IV Coal 5363.2 4254.1 79.3 Copper concentrate 316.5 414.7 131.0 Iron ores 1581.6 1500.3 94.9 Crude petroleum oil (thous.barrel) 2094.6 2518.0 120.2 Zinc ores and concentrate 27.0 42.7 158.1 Gold, unwrought or in semi-manu- factured forms 2.5 3.4 136.1 % National consumer price index, by group percent Weight 2015 IV 2015 IV 2015 IV 2014 IV 2014 XII 2015 III Overall index 100.0 109.2 102.9 100.9 Food and non-alcoholic beverages 29.3 106.2 107.2 102.7 Alcoholic beverages, tobacco 3.2 107.6 100.8 100.2 Clothing, footwear and cloth 16.1 112.9 102.5 100.7 Housing, water, electricity and fuels 12.3 114.0 98.7 99.0 Furnishings, household equipment 4.7 110.7 102.4 100.9 Health 3.6 109.3 101.5 100.5 Transport 12.2 106.2 101.4 100.2 Communication 4.4 100.0 100.0 100.1 Recreation and culture 2.8 109.3 101.9 101.0 Education 4.7 116.8 100.0 100.0 Restaurants and hotels 2.6 106.3 101.7 100.1 Miscellaneuos goods and services 4.1 108.4 101.8 100.4 Table II.3 Figure II.1 Total turnover of stocks, in the first 4 months of selected years bln.tog 10.4 59.2 431.2 2013 I- IV 2014 I- IV 2015 I-IV Total turnover of stocks, in the first 4 months of selected years bln.tog Figure II.2 Total equilibrated revenue, expenditure, equilibrated balance of General Government budget in the first 4 months of selected years, bln.tog 1 589.4 1 675.8 1 675.0 1 453.4 1 781.5 1 919.8 136.0 - 105.6 -244.8 2013 I-IV 2014 I-IV 2015 I-IV Total equilibrated revenue, expenditure, equilibrated balance of General Government budget in the first 4 months of selected years, bln.tog Total equilibrated revenue Total expenditure Equilibrated balance Compared to same period of the previous year, tax revenue has increased by 38.3 bln.tog or 2.7 percent. This increase was mainly due to increases of 102.8 bln.tog or 72.4 percent in other taxes, 31.5 bln.tog or 23.2 percent in excise taxes, 23.3 bln.tog or 8.2 percent in social security contributions, although value added tax revenue decreased by 115.0 bln.tog or 27.6 percent, revenue of foreign activities decreased by 17.0 bln.tog or 16.4 percent compared to same period of the previous year. In the first 4 months of 2015, total expenditure and net lending of the General Government Budget reached 1919.8 bln.tog increased 138.3 bln.tog or 7.8 percent compared to same period of the previous year. This increase was mainly due to increases of 77.6 bln.tog or 10.1 percent in expenditure on goods and services and 30.6 bln.tog or 4.7 percent in current transfers expenditure, 14.7 bln.tog or 8.3 percent in capital expenditure. In the first 4 months of 2015, Mongolia traded with 115 countries from all over the world and total external trade turnover reached 2486.5 mln. US dollars, of which 1452.3 mln.US dollars was made up by exports and 1034.3 mln.US dollars by imports. 2 953.3 2 958.4 2 486.5 1 212.5 1 432.2 1 452.3 1 740.8 1 526.2 1 034.3 - 528.3 - 94.0 418.0 2013 I-IV 2014 I-IV 2015 I-IV Total turnover of foreign trade in the first 4 months of selected years, mln.USD Total turnover Exports Imports Balance In April 2015 the national consumer price index increased by 0.9 percent from the previous month, 2.9 percent from beginning of the year and 9.2 percent over the same period of the previous year. An increase as 0.9 percent was mainly due to increases of 2.7 percent in food and non-alcoholic beverages and 0.7 percent in clothing, footwear and cloth.
- 4. Ñòàòèñòèêèéí áþëëåòåíü 4 Figure II.5 Figure II.6 Carried freight and carried passengers by railway transport, in the first 4 months of selected years Carried freight and carried passengers by air transport, in the first 4 months of selected years As of the first 4 months of 2015, 15.6 mln. head breeding animals have been gave a birth and it is equals to 70.3 percent of total breeding animals. Survival of young animals amounted 15314.5 thous.head and it has increased by 1969.4 thous.head or 14.8 percent compared with the same period of the previous year. In the first 4 months of 2015, natural losses of adult animals reached 233.0 thous.heads at national level and increased by 82.7 thous.heads or 55.1 percent compared to same period of the previous year. Out of the losses of adult animals, 12.3 thousand were horses, 14.2 thousand were cows, 0.3 thousand were camels, 98.1 thousand were sheeps and 108.1 thousand goats. The industrial production index (seasonally adjusted) in April 2015 was 114.3 (2010=100) up by 7.5 percent from the previous month, by 11.4 percent compared to the same period of previous year and decreased by 14.9 percent from beginning of the year. In the mining and quarrying sectors the mining products such as gold, coal, crude oil, copper with concentrate, molybdenium with concentrate increased by 2.4-34.3 percent, the production of products such as, bakery products, pure water, bread, fodder, beauty cream, metal steel, combed down, metal foundries, beer, buuz and dumpling, kind of sausage, vacuum windows and doors, copper (99 %) increased by 1.3 percent to 7.1 times in the manufacturing sector compared to the same period of the previous year. CHAIRMAN OF THE NATIONAL STATISTICAL OFFICE OF MONGOLIA S.MENDSAIKHAN 13 May, 2015 % Gross industrial output, in the first quarter of selected years 2014 2015 2015 I-IV 2014 I-IV IV I-IV IV I-IV Total 745.8 2415.6 709.4 2467.8 102.2 Mining and quarrying 455.9 1601.6 444.7 1554.5 97.1 Manufacturing 237.4 583.1 209.2 638.5 109.5 Electricity, thermal energy and water supply 52.6 230.9 55.6 274.8 119.0 In the first 4 months of 2015, 5659.6 thous. tons freight and 927.9 thous.passengers (double counting) were carried by railway transport. Compared to same period of the previous year, the carried freight decreased by 402.6 thous.t or 6.6 percent and the number of carried passengers decreased by 155.5 thous.persons or 14.4 percent. 6 326.8 6 062.2 5 659.6 1 216.0 1 083.4 927.9 2013 I-IV 2014 I-IV 2015 I-IV Carried freight and carried passengers by railway transport, in the first 4 months of selected years Carried freight, thous.t Carried passengers, thous.persons The revenue from railway transport in the first 4 months of 2015 reached 109.6 bln.tog reflecting decrease of 12.5 bln.tog or 10.3 percent compared to same period of the previous year. In the first 4 months of 2015, 812.1 tons freight and 167.3 thous.passengers (double counting) were carried by air transport. Compared to same period of the previous year, carried freight decreased by 269.5 tons or 24.9 percent and the number of carried passengers decreased by 36.1 thous.persons or 17.7 percent. 1151.6 1081.6 812.1 217.2 203.4 167.3 2013 I-IV 2014 I-IV 2015 I-IV Carried freight and carried passengers by air transport, in the first 4 months of selected years Carried freight, t Carried passengers, thous.persons