Solid Waste Management
•
1 like•229 views

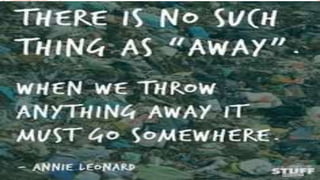
This study examined solid waste management practices in Ukhra Village, India. It found that most households dispose of waste by throwing it in open land. The study evaluated waste generated from residential, commercial, and institutional sources, finding for example that each household produces an average of 76.4 kg of wet waste per year. It provided suggestions for improving solid waste management, such as establishing a budget, training programs, and a new management model for the village.

Recommended
More Related Content
What's hot
What's hot (20)
Similar to Solid Waste Management
Similar to Solid Waste Management (20)
More from Satabdi Sen
More from Satabdi Sen (6)
Recently uploaded
Recently uploaded (20)
Solid Waste Management
- 1. 1
- 2. A STUDY ON SOLID WASTE MANAGEMENT PRACTICES OF VILLAGERS, WITH SPECIAL REFERENCE TO UKHRA VILLAGE, BANKOLA COLLIERY Presented By: Satabdi Sen 2
- 3. FLOW OF PRESENTATION 3 Conclusion Glimpses of waste disposal sites and Solid Waste Management System Suggestions Data Analysis and Findings Research Methodology Research Gap Objectives of the study Important Terms
- 4. IMPORTANT TERMS Waste Solid Waste Solid Waste Management 4
- 5. OBJECTIVE OF THE STUDY 5 To study the socio-economic status of the people residing in the village-Ukhra. To study the present solid waste disposal practices prevailing in the society. To study and evaluate the amount of various solid waste generated from different categories of sources of solid waste generation.
- 6. RESEARCH GAP Most of the researches that are conducted on Solid Waste Management focuses mostly on MSW (Municipality Solid Waste). So to focus on Solid wastes generated in villages, this study is conducted. 6
- 7. SCHEMATIC VIEW OF STUDY 7
- 9. RESEARCH METHODOLOGY Research Design: Exploratory Tools of Data Collection: Interview schedule Graphical Presentation: Bar Graph and Pie Chart Universe: 9
- 10. CONT… Universe Universe Size Sample Size Sampling Method Residential Source: 1. Gulzarbagh Ward 2. Kankar Danga Ward 275 235 55 47 Cluster Sampling Commercial Source: 1. Open Air Market 2. Daily Market 50 110 10 22 Purposive Sampling Simple Random Institutional Source: 1. Schools 2. Dispensary 20 1 4 1 Simple Random No Sampling method 10
- 11. DATA ANALYSIS 11
- 12. PART 1: SOCIO-ECONOMIC CONDITION OF THE RESPONDENT FROM THE RESIDENTIAL SOURCE 12 36.30% 16.70% 12.70% 12.70% 12.70% 12.70% 4% 2.00% No education Primary Upper Primary Secondary Higher Secondary Graduate Post Graduate Others Education Qualifications
- 13. CONT…. Family Size 13 37% 40% 16% 6% 1% 1 2 3 4 5 Criteria Number of Family members Frequency 1 1-4 38 2 5-8 41 3 9-12 16 4 13-16 6 5 17 and more 1
- 14. CONT… 64.70% 16.70% 6.90% 11.80% 1 2 3 More than 3 1 2 3 More than 3 14
- 15. CONT… 47% 53% Permanent source of income Yes No 15
- 16. PART 2: PREVAILING WASTE DISPOSAL PRACTICES IN THE VILLAGE. Prevailing waste disposal practices 16 87% 3% 9% 1% Open Land Burned Pond Others Residential Source
- 17. CONT… Prevailing waste disposal practices 17 90% 10% 0%0% 0% Open land Pond Burned Rag pickers Others Open air market 82% 9% 9% Open Land Along the road Rag Pickers Daily Market
- 18. CONT… Prevailing waste disposal practices 18 Open Land 20% Burned 60% Rag pickers 20% Schools 0 20 40 60 80 100 120 Burned Percent Dispensary
- 19. Evaluation of the quantities of various types of solid wastes generated from different sources of waste generation. 19 76.4 15.74 0.028 Residential Source 2808 1385 151 0.57 Institutional Source
- 20. CONT… 20 248 0 0 Wet Waste Dry Non recyclables Dry Recyclables Quantity in Kg Open air market 415.37 142.08 81.66 Wet Waste Dry Non recyclable Recyclable Quantity in Kg Daily market
- 21. WILLINGNESS TO PAY THE SERVICE CHARGE FOR THE SWM PROJECT IF IMPLEMENTED. No money 20% 10 to 15 10% 21 to 25 10% 26 to 30 50% 36-40 10% 21 No money 18% 10 to 15 11% 16to20 14% 21 to 25 6% 26-30 26% 36-40 16% 40+ 9% Residential Source Open Air Market
- 22. WILLINGNESS TO PAY THE SERVICE CHARGE FOR THE SWM PROJECT IF IMPLEMENTED. No money 16% 26-30 26% 36-40 16% 46-50 16% 56-60 26% 22 Daily Market Rs. 200 50%Rs.1000 25% Rs.50 25% School
- 23. OBJECTIVES FINDINGS Objective-1: To study the socio- economic status of the people in the village-Ukhra. 1. 64.7% of households rely on 1 earning member in a family. 2. Around 53% of respondents did not have a permanent source of income. Objective-2: To study the Present Solid Waste disposal practices prevailing in the society. Residential Source: 87% of sample population prefer to throw the garbage in open land. Open Air Market 90% of the respondent responded that they throw the garbage in open land and the remaining 10% throw the wastes in the river. Daily Market 82% of the respondent throw the garbage in open land. Schools 60% of the respondent from schools responded that they prefer to burn the daily solid waste generated. Dispensary The waste that is collected is burned in a open land behind the dispensary 23
- 24. OBJECTIVES FINDINGS Objective 3: To study evaluate the amount of various solid waste generated from various categories of sources of solid waste generation. Residential Source: 1.Each household generate an average amount of 76.44 Kg of wet wastes each year. 2.Each household generate an average amount of 0.28 Kg of recyclable items each year. Commercial Source: A. Open Air Market Each vendors of the Haat Bazaar generate an average amount of 248 Kg of wet wastes each year. B. Daily Market 1.Each shops of the daily market generates an average amount of 415 Kg of wet wastes every year. 2.Each shops of the daily market generates an average amount of 81.66 Kg of recyclable items each year. Institutional Source: Each school generates an average amount of 2808.28 Kg. wet wastes each year. Each school generates an average amount of 0.57 Kg of recyclable items each year. 24
- 25. LIMITATIONS OF THE STUDY Data is collected from only 2 wards, as a result the entire HH population of the village is not taken into consideration for the study. The quantity of solid wastes considered for the study is an estimated data that is obtained by the responses of the respondents along with observing the containers used for collection of solid waste . Hence, proper accurate data about the weight is not available. And its under further study. 25
- 26. SUGGESTIONS A proposal on Solid Waste Management has been suggested to the CSR wing of Eastern Coalfields Limited, Bankola Area . Estimated Budget Outlay For SWM Project. Projected Cash flow 26
- 27. SUMMARY 27 1. Clean Environment 2. Employment 3.Empowerment 1. Framing of Budget. 2. Training and Awareness Programme Framing Of SWM Model Study on: 1. Socio-Economic Conditions of Villagers 2. Prevailing Waste Disposal System 3. Quantity of Various Waste
- 28. PROPOSED MODEL FOR SWM 28
- 29. 29 GLIMPSES OF DISPOSAL PRACTICES
- 30. INFRASTRUCTURE FOR SOLID WASTE MANAGEMENT 30
- 31. CONT… 31 COMPOSTING SITE SEGREGATION SITE
- 32. 32