
Recommended
Recommended
More Related Content
What's hot
What's hot (20)
Similar to Weekly Market Notes for August 14, 2017
Similar to Weekly Market Notes for August 14, 2017 (20)
Recently uploaded
Recently uploaded (20)
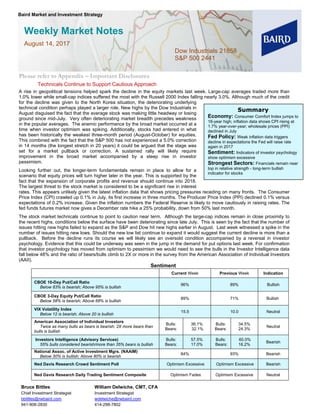
Weekly Market Notes for August 14, 2017
- 1. Bruce Bittles Chief Investment Strategist bbittles@rwbaird.com 941-906-2830 William Delwiche, CMT, CFA Investment Strategist wdelwiche@rwbaird.com 414-298-7802 Please refer to Appendix – Important Disclosures Technicals Continue to Support Cautious Approach A rise in geopolitical tensions helped spark the decline in the equity markets last week. Large-cap averages traded more than 1.0% lower while small-cap indices suffered the most with the Russell 2000 Index falling nearly 3.0%. Although much of the credit for the decline was given to the North Korea situation, the deteriorating underlying technical condition perhaps played a larger role. New highs by the Dow Industrials in August disguised the fact that the average stock was making little headway or losing ground since mid-July. Very often deteriorating market breadth precedes weakness in the popular averages. The anemic performance by the broad market occurred at a time when investor optimism was spiking. Additionally, stocks had entered in what has been historically the weakest three-month period (August-October) for equities. This combined with the fact that the S&P 500 has not experienced a 5.0% correction in 14 months (the longest stretch in 20 years) it could be argued that the stage was set for a market pullback or correction. A sustained rally will likely require improvement in the broad market accompanied by a steep rise in investor pessimism. Looking further out, the longer-term fundamentals remain in place to allow for a scenario that equity prices will turn higher later in the year. This is supported by the fact that the expansion of corporate profits and revenue should continue into 2018. The largest threat to the stock market is considered to be a significant rise in interest rates. This appears unlikely given the latest inflation data that shows pricing pressures receding on many fronts. The Consumer Price Index (CPI) crawled up 0.1% in July, its first increase in three months. The Producer Price Index (PPI) declined 0.1% versus expectations of 0.2% increase. Given the inflation numbers the Federal Reserve is likely to move cautiously in raising rates. The fed funds futures market now gives a December rate hike a 25% probability, down from 50% last month. The stock market technicals continue to point to caution near term. Although the large-cap indices remain in close proximity to the recent highs, conditions below the surface have been deteriorating since late July. This is seen by the fact that the number of issues hitting new highs failed to expand as the S&P and Dow hit new highs earlier in August. Last week witnessed a spike in the number of issues hitting new lows. Should the new low list continue to expand it would suggest the current decline is more than a pullback. Before the decline runs its course we will likely see an oversold condition accompanied by a reversal in investor psychology. Evidence that this could be underway was seen in the jump in the demand for put options last week. For confirmation that investor psychology has moved from optimism to pessimism we would need to see the bulls in the Investor Intelligence data fall below 48% and the ratio of bears/bulls climb to 2X or more in the survey from the American Association of Individual Investors (AAII). Sentiment Current Week Previous Week Indication CBOE 10-Day Put/Call Ratio Below 83% is bearish; Above 95% is bullish 96% 89% Bullish CBOE 3-Day Equity Put/Call Ratio Below 58% is bearish; Above 68% is bullish 89% 71% Bullish VIX Volatility Index Below 12 is bearish; Above 20 is bullish 15.5 10.0 Neutral American Association of Individual Investors Twice as many bulls as bears is bearish; 2X more bears than bulls is bullish Bulls: Bears: 36.1% 32.1% Bulls: Bears: 34.5% 24.3% Neutral Investors Intelligence (Advisory Services) 55% bulls considered bearish/more than 35% bears is bullish Bulls: Bears: 57.5% 17.0% Bulls: Bears: 60.0% 16.2% Bearish National Assoc. of Active Investment Mgrs. (NAAIM) Below 30% is bullish; Above 80% is bearish 84% 93% Bearish Ned Davis Research Crowd Sentiment Poll Optimism Excessive Optimism Excessive Bearish Ned Davis Research Daily Trading Sentiment Composite Optimism Fades Optimism Excessive Neutral Weekly Market Notes August 14, 2017 Dow Industrials 21858 S&P 500 2441 Baird Market and Investment Strategy Summary Economy: Consumer Comfort Index jumps to 16-year high; inflation data shows CPI rising at 1.7% year-over-year; wholesale prices (PPI) declined in July Fed Policy: Weak inflation data triggers decline in expectations the Fed will raise rate again in 2017 Sentiment: Indicators of investor psychology show optimism excessive Strongest Sectors: Financials remain near top in relative strength - long-term bullish indicator for stocks
- 2. Weekly Market Notes Robert W. Baird & Co. Page 2 of 4 Source: StockCharts RS Ranking RS Current Previous Trend Leaders: Independent Power Producers Laggards: Leaders: Internet Software & Services; Data Processing & Outsourced Services; Application Software; Systems Software; Home Entertainment Software Laggards: Leaders: Asset Management & Custody Banks; Property & Casualty Insurance; Industrials REITs Laggards: Leaders: Aerospace & Defense; Construction Machinery & Heavy Trucks; Diversified Support Services Laggards: Construction & Engineering; Trading Companies & Distributors Leaders: Managed Health Care Laggards: Health Care Distributors; Health Care Services; Health Care Facilities Leaders: Auto Parts & Equipment; Homebuilding; Specialized Consumer Services; Cable & Satellite; Computer & Electronics Retail Laggards: Tires & Rubber; Motorcycle Manufacturers; Household Appliances; Leisure Products; Advertising; Distributors; Department Stores; Apparel Retail; Specialty Stores; Automotive Retail; Homefurnishing Retail Leaders: Laggards: Construction Materials Leaders: Laggards: Leaders: Distillers & Vintners; Personal Products Laggards: Leaders: Laggards: Oil & Gas Drilling; Oil & Gas Equipment & Services; Oil & Gas Exploration Prduction ** Denotes Current Relative Strength‐Based Overweight Sectors Utilities 1 ** 5 Sub‐Industry Detail Financials 3 ** 1 Information Technology 2 ** 2 Health Care 5 ** 4 Industrials 4 ** 3 Consumer Staples 9 10 Telecom Services 8 6 + Consumer Discretionary 6 7 ‐ Materials 7 8 Energy 10 9 200-Day Moving Average
- 3. Weekly Market Notes Robert W. Baird & Co. Page 3 of 4 Appendix – Important Disclosures and Analyst Certification This is not a complete analysis of every material fact regarding any company, industry or security. The opinions expressed here reflect our judgment at this date and are subject to change. The information has been obtained from sources we consider to be reliable, but we cannot guarantee the accuracy. ADDITIONAL INFORMATION ON COMPANIES MENTIONED HEREIN IS AVAILABLE UPON REQUEST The Dow Jones Industrial Average, S&P 500, S&P 400 and Russell 2000 are unmanaged common stock indices used to measure and report performance of various sectors of the stock market; direct investment in indices is not available. Baird is exempt from the requirement to hold an Australian financial services license. Baird is regulated by the United States Securities and Exchange Commission, FINRA, and various other self-regulatory organizations and those laws and regulations may differ from Australian laws. This report has been prepared in accordance with the laws and regulations governing United States broker-dealers and not Australian laws. Copyright 2017 Robert W. Baird & Co. Incorporated Other Disclosures United Kingdom (“UK”) disclosure requirements for the purpose of distributing this research into the UK and other countries for which Robert W. Baird Limited (“RWBL”) holds a MiFID passport. This material is distributed in the UK and the European Economic Area (“EEA”) by RWBL, which has an office at Finsbury Circus House, 15 Finsbury Circus, London EC2M 7EB and is authorized and regulated by the Financial Conduct Authority (“FCA”). For the purposes of the FCA requirements, this investment research report is classified as investment research and is objective. The views contained in this report (i) do not necessarily correspond to, and may differ from, the views of Robert W. Baird Limited or any other entity within the Baird Group, in particular Robert W. Baird & Co. Incorporated, and (ii) may differ from the views of another individual of Robert W. Baird Limited. All substantially material sources of the information contained in this report are disclosed. All sources of information in this report are reliable, but where there is any doubt as to reliability of a particular source, this is clearly indicated. Robert W. Baird Group and or one of its affiliates may at any time have a long or short position in the company/companies mentioned in this report. Where the Group holds a long or short position exceeding 0.5% of the total issued share capital of the issuer, this will be disclosed separately by your RWBL representative upon request. This material is only directed at and is only made available to persons in the EEA who would satisfy the criteria of being "Professional" investors under MiFID and to persons in the UK falling within articles 19, 38, 47, and 49 of the Financial Services and Markets Act of 2000 (Financial Promotion) Order 2005 (all such persons being referred to as “relevant persons”). Accordingly, this document is intended only for persons regarded as investment professionals (or equivalent) and is not to be distributed to or passed onto any other person (such as persons who would be classified as Retail clients under MiFID). Robert W. Baird & Co. Incorporated and RWBL have in place organizational and administrative arrangements for the disclosure and avoidance of conflicts of interest with respect to research recommendations. Robert W. Baird Group and or one of its affiliates may be party to an agreement with the issuer that is the subject of this report relating to the provision of services of investment firms. An outline of the general approach taken by Robert W. Baird Limited in relation to conflicts of interest is available from your RWBL representative upon request. Baird’s policies and procedures are designed to identify and effectively manage conflicts of interest related to the preparation and content of research reports and to promote objective and reliable research that reflects the truly held opinions of research analysts. Analysts certify on a quarterly basis that such research reports accurately reflect their personal views.
- 4. Weekly Market Notes Robert W. Baird & Co. Page 4 of 4 This material is not intended for persons in jurisdictions where the distribution or publication of this research report is not permitted under the applicable laws or regulations of such jurisdiction. Investment involves risk. The price of securities may fluctuate and past performance is not indicative of future results. Any recommendation contained in the research report does not have regard to the specific investment objectives, financial situation and the particular needs of any individuals. You are advised to exercise caution in relation to the research report. If you are in any doubt about any of the contents of this document, you should obtain independent professional advice. RWBL is exempt from the requirement to hold an Australian financial services license. RWBL is regulated by the FCA under UK laws, which may differ from Australian laws. As such, this document has not been prepared in accordance with Australian laws.