SlideShare a Scribd company logo
1 of 20
The following report offers a detailed insight into
Retail Food Group (RFG). RFG is a food retailer
that provides the majority of its services to the
Australian market. The firms head office is
located in the Gold Coast, QLD.
Our report gives an in-depth insight into
macroeconomic factors, the industries that RFG
operates in as well as a firm level analysis.
Our findings have shown that the company has
been on an aggressive path, led by acquisitions of
Gloria Jean’s and most recently Hudson Pacific.
The firm has consistently returned a revenue and
profit increase year on year. RFG’s increase in
revenue and profit both outstrip the average
growth of the Australian economy, as well as the
food industry as a whole.
The recent announcement regarding the Hudson
Pacific acquisition has given RFG a solid base to
build its future on. Being able to supply inventory
to its franchises gives the firm a great vertical
supply chain. Due to this we have forecast
revenues to increase by 50%, though we are largely expecting this to be offset by increased
operating costs.
We have forecasted the firms NPAT to be 1.6% higher this coming fiscal year (FY2017) due
to the costs associated with the Hudson acquisition. We expect NPAT to grow at circa 15%
the following two years as RFG is able to see the full benefits from the Hudson acquisition.
Our forecast gives a target share range of $6.30 - $6.60, and as such we currently believe
the security is a hold.
EFN415 – Queensland University of Technology Page 1
Current Share Price $6.55
52Week high $7.17
52Week low $3.98
Market Capitalisation $1.08B
16th September, 2016
Retail Food Group LTD
RFG.ASX
Price Performance As of 12/09/2016
Table of Contents
Table of Contents...................................................................................................................................2
ECONOMIC ANALYSIS - MARKET SUMMARY.........................................................................................3
Gross Domestic Product....................................................................................................................3
Interest Rates....................................................................................................................................4
Inflation Rates...................................................................................................................................5
Unemployment Rates........................................................................................................................5
Australian Consumer Confidence......................................................................................................6
INDUSTRY ANALYSIS..............................................................................................................................7
Porter’s Five Forces Analysis..............................................................................................................7
Threat of Existing Competitors......................................................................................................7
Threat of New Entrants..................................................................................................................9
Threat of Substitute Products........................................................................................................9
Threat of Bargaining Power of Buyers.........................................................................................10
COMPANY ANALYSIS............................................................................................................................10
Company Profile..............................................................................................................................10
Key Executives.............................................................................................................................12
COMPANY STRATEGY.......................................................................................................................12
Competitive Strategy...................................................................................................................12
Recent Highlights.........................................................................................................................12
Business Strategy.........................................................................................................................12
SWOT Analysis.................................................................................................................................13
VALUATION..........................................................................................................................................15
Buy, Sell or Hold Recommendation.....................................................................................................18
Appendix..............................................................................................................................................19
References...........................................................................................................................................20
............................................................................................................................................................20
EFN415 – Queensland University of Technology Page 2
ECONOMIC ANALYSIS - MARKET SUMMARY
Gross Domestic Product
Risk: Neutral – Positive Outlook: 3.3%-3.6%
After the Global Financial Crisis in 2007
the world has experienced slow growth.
Its impact is still being experienced today
in some parts. In addition to this, during
the World Economic Outlook forum of
2016 the International Monetary Fund
(IMF) stated that annual growth for both
the United States of America (USA) and
Europe has been shown to be slowing.
Despite this, the global economy has
continued to grow, albeit at a slower
than average pace and is predicted to
grow at 3.8% for 2017 (IMF, 2016).
Commodity prices have recently trended
upwards which is a positive sign for the
global economy as well as the Australian
economy which is heavily dependent on commodities.
According to the official Reserve Bank of Australia (RBA) figures, the Australian economy
grew by 3.1% in 2016 compared to 2.9% in 2015. It is the largest percentage expansion since
2012. The Australian Bureau of Statistics (ABS, 2016) says that an increase in both
household consumption expenditure and public gross fixed capital formation has been the
major drivers for this growth. Although there have not been significant contributions from
net exports, the Australian dollar has been
able to retain its strong position. Gross
domestic product (GDP) is slightly higher than
RBA forecasts for the third quarter and GDP
growth rate has risen above forecasts to
3.30%. This increase is most likely due to the
fact that the domestic economy has begun to
advance from the mining collapse as well as
seeing the benefits from the aforementioned
improving commodity prices.
EFN415 – Queensland University of Technology Page 3
Figure 1
Figure 2
Our outlook is neutral-positive as household consumption and public capital formation are
currently negating the risk associated with the end of the mining boom. In the short term
our outlook has used the IMF projections. Our longer term view uses the Organisation for
Economic Cooperation and Development (OECD) forecasted growth. The growth that was
projected is 3.0% - 3.2% for the Australian economy and a global growth target of 3.5% -
3.8%. These forecast ranges are an estimate for the next fifteen years.
Interest Rates
Risk: Positive Outlook – Easing bias
The RBA met on the 6th of September, 2017 and decided to leave the official cash rate
unchanged at 1.50%. The RBA had made a
number of observations around the global
economy and how it was tracking. Funding
costs for borrowers remain low, as evident by
the record low cash rate and the monetary
policies around the world remain
accommodative.
As at the 9th
September, the Cash Rate
Futures implied yield curve shows a 76%
current market expectation of a potential
further rate cut by September 2017. This can
be seen as an easing bias in market
expectations. Our outlook takes this bias into
consideration.
EFN415 – Queensland University of Technology Page 4
Figure 3
Figure 4
Inflation Rates
Risk: Low Outlook: 1.5%-2.5%
The recent outlook on employment rates and
wage growth has a tendency to push down
inflation. Nonetheless, the depreciation in
the exchange rate is likely to have upward
pressure on inflation rates in the Australian
economy. These two effects are expected to
offset one another. Therefore, we forecast
that inflation at the end of this year is
forecast to remain moderate. According to
the indexes that are released on a quarterly
basis by the ABS, consumer prices in
Australia rose 1.0% in the quarter ending
June 2016. This was down 0.3% from 1.3% in
the previous quarter and slightly below
market consensus, as well as being below the
RBA’s target range of 2%-3%. As economic
growth improves it would be expected that inflation rises back toward the target range.
Our outlook considers the RBA current inflation and the RBA’s targeted inflation rate range
of between 2%-3%.
Unemployment Rates
Risk: Low-Medium Outlook: Steady
Unemployment rates around the world vary significantly. Data released by The World Bank,
show the stark contrast in these rates. They have unemployment rates at 4.9% in the USA
but 10.1% for the Eurozone. Australia's unemployment rate has been relatively stable until
a sudden drop to 5.7% in July 2016. This is below the forecasts of 5.9% (ABS, 2016).
Continued economic growth combined with both low inflation and interest rates should see
unemployment rates remain steady in the near to medium term.
EFN415 – Queensland University of Technology Page 5
Figure 5
Australian Consumer Confidence
Risk: Medium Outlook: Steady to positive
The Westpac-Melbourne Institute Consumer Sentiment Index for Australia rose 2% to 101 in
August of 2016, compared to a 3% drop in July. The public expectations of economic
conditions over the next 12 months increased by 3.5%. This increase followed the Consumer
Sentiment Index with a sharp decline a month earlier. Both point to an improving consumer
sentiment.
Further evidence of improving consumer confidence is show by the likelihood of consumers
to undertake large purchases. The measure of whether this was a “Good Time to Buy Major
Household Items” was up by 1.6%. For housing, 'The Time to Buy a House' index jumped to
10.1%. This was a strong performance after the index fell 1.8% in July. Despite these
positive outlooks consumer’s view on the outlook over the next 5 years dipped marginally
by 0.7% (University of Melbourne, 2016). We believe that this decline in longer term
consumer sentiment could have been caused by negative news stories about the end of the
mining boom. With continued growth and falling unemployment it would be expected that
this outlook would improve.
EFN415 – Queensland University of Technology Page 6
INDUSTRY ANALYSIS
Along with the growing economy, consumer spending has been forecast to increase over
the next few quarters as the benefits of the last RBA rate cut are passed (partially) onto
borrowers. The chance of a further rate drop and improving consumer confidence survey
results suggests that consumer consumption will remain strong.
Consumer trends drive performance in the industry sectors that RFG has their portfolio of
brands. Of the consumer discretionary market, RFG operates in three main markets; Bread
and Cake Retailing, Café and Coffee Shops and Fast Food Services.
Industry RFG Market Share Market Size FY2016 Growth Forecast Growth
Bread and Cake 21.50% $753m 1.80% 1.40%
Coffee Shops 16.50% $2,400m 3.80% 3.70%
Fast Food >1% $19,300m 3.90% 1.50%
Figure 6
As shown in Figure 6, the highest rate of forecast growth in the coffee shop industry. RFG
through the acquisition of Gloria Jeans are a significant player in this market. RFG have no
stated plans to expand in the fast food industry which despite its size is forecasting
significantly slower then previously.
Porter’s Five Forces Analysis
Outlook: Does not support long term growth above GDP rates.
Threat of Existing Competitors
Risk: High
The RFG brands of Crust and Pizza Capers have
faced significant competitor pressures. This
has seen strong competitors in Domino’s and
Pizza Hut battling for market share. Domino’s
price, product differentiation and
improvements in ordering have helped them
surged in the market to comfortably take top
spot of pizza chains, gaining 4.8% of the Fast
Food Services Industry according to their
annual report. RFG have stated they do not
wish to compete on price, instead relying on
product quality as the unique competitive
advantage.
EFN415 – Queensland University of Technology Page 7
Figure 7
Industry reports indicate that the recent acquisition of Gloria Jeans increased RFG’s market
share in the Coffee Shop industry to 16.5%, making RFG a clear industry leader in a market
that is traditionally characterised by low levels of market share and discerning tastes among
consumers. Gloria Jeans was acquired after facing significant competition from another
global competitor in Starbucks who after closing underperforming stores, has sold its
Australian business rights to the parent company of 7-Eleven. RFG have however improved
on the traditional coffee shop distribution by acquiring Cafe2U (mobile coffee vans) and
Coffee Nation, which is an operator of more than 1000 self-service coffee machines.
There are a number of competitive moves in which a company is able to respond to
competitors to gain an advantage.
• Changes in prices – a company is able to change prices up or down in order to gain
some sort term advantages over the market. RFG have demonstrated an ability to
occupy the premium end of their market. This is evidenced by their lack of
willingness to compete on price in the gourmet pizza market. By undertaking vertical
acquisitions, RFG maybe able to provide buffers against rival price wars. A rival who
discounts still has to purchase raw materials and will still have to meet the demand
of the suppliers and their price. With the acquisition of Hudson’s RFG controls
significant portions of their supply chain and may have the ability to reduce price
beyond the scale of many other rivals.
• Improve product differentiation – RFG has stated that they are increasing franchise
independence to encourage product innovation. RFG have released a number of
concept stores which it has begun to roll out to significantly improve the consumer
experience. Whilst we recognise the potential to improve based on store fit out, the
brands that RFG own are not known for their menu rotation.
• Creatively using channels of distribution – As evidenced by the purchase of mobile
coffee distributors, and the possibility of drive through coffee service, RFG shows
innovation in their coffee business. Outside of this part of the business, RFG has
largely remained a traditional retailer in the remaining business sectors in which it
operates.
• Exploiting relationships with suppliers - RFG have a stated goal of becoming vertically
integrated which they believe will deliver greater control over product development,
cost and quality which they believe will give them a competitive advantage
EFN415 – Queensland University of Technology Page 8
Threat of New Entrants
Risk: High
In the coffee shop industry, market research performed by IbisWorld shows competition is
high and the trend is increasing. In addition, the industry is subject to external competition
from other hospitality industry such as restaurants and convenience stores. The industry
possess low barriers to entry due to the low start-up costs, and is also reflected in the high
fragmentation in the market as whole. In terms of life cycle stage, the coffee industry is in a
growth phase. This will increase the attractiveness of this industry to new competitors. This
all points to the threat of new entrants being high.
Retailing in bread and cakes shows a medium level of competition with an increasing trend.
Fragmentation remains high and competition generally focuses on price and product range,
with factors such as health benefits and dietary requirements gaining prominence. Product
expansion amongst supermarkets and convenience stores poses a threat to RFG as well as
the café and coffee shop industries expanding into cakes, pastries and sweetbreads. The life
cycle of this industry is in a mature stage which will limit the attractiveness to new
competitors. Overall the risks of other industries expanding product ranges into traditional
products offered by this sector is high.
In the fast food industry, the industry is moving towards saturation as it moves into the
mature life cycle stage. This is making it harder for new competition to find suitable
locations and build a significant sustainable market share. There has been an observable
increase in premium food offerings within the industry and from supermarkets. This trend
will increase competitors in the premium pizza market that RFG operates in.
Threat of Substitute Products
Risk: High
RFG trades in industries that see new entrants as well as new ideas. As such there are
threats of substitute products coming through constantly. We have seen a dynamic shift of
the consumer to healthier options and niche brands. This shifts the emphasis to companies
like RFG to ensure they are keeping up with consumer demand. Concern exists as to RFG’s
ability to show significant product nimbleness to deal with this risk. As mentioned previously
RFG has begun to allow individual franchises to experiment with product differentiation
which should help with the added benefit of meeting the demand of geographic locations
without the need for central oversight.
EFN415 – Queensland University of Technology Page 9
Threat of Bargaining Power of Buyers
Risk: Low
RFG is primarily a direct to consumer retailer and make the majority of their revenues from
their franchisees. The end consumer in the market place has plenty of choice and as such is
responsive to competitive forces in price, quality and product differentiation. RFG has
chosen to occupy a premium segment of their chosen industry segments which has allowed
them to receive higher margins but this will be impacted as competitors increase the quality
of competing offerings or lower their prices.
COMPANY ANALYSIS
Company Profile
RFG is the owner, developer and manager of the Donut King, Brumby’s Bakery, Michel’s
Patisserie, bb’s Café, Esquires, Gloria Jean’s Coffees, It’s A Grind, The Coffee Guy, Café2U,
Pizza Capers Gourmet Kitchen and Crust Gourmet Pizza Bar franchise systems. Its major
franchises are household Australian names.
In addition, the company is a significant wholesale coffee roaster supplying existing brand
systems and third party accounts under the Evolution Coffee Roasters Group, Roasting
Australia and Di Bella Coffee brands.
The Group’s main operations are in within the Australian market (69% of the network),
however they do have a market presence in Europe (8%), America (4%), Asia (8%) and parts
of the Middle East (5%)
EFN415 – Queensland University of Technology Page 10
Figure 8
Five of the major franchises that RFG owns and operates are;
Besides doughnuts, Donut King also serves a variety of other food
items and beverages such as coffee and teas, soft drinks,
milkshakes, soft serve ice creams, frozen carbonated beverages,
and hot dogs
Brumby's bakeries sell a range of sweet and savoury food. Various
flavours of pies and sausage rolls, loaves of bread, cheese and
bacon buns and rolls, cream buns and rolls, and small cakes and
pastries are the types of products sold.
Michel's Patisserie is a chain of bakery-style food outlets selling
cakes, pies, savouries, and espresso coffee
In addition to pizza, Pizza Capers also serves a wide variety of
other food items, as well as beverages and desserts such as:
chicken wings, pasta, calzones, garlic bread, salads, soft drinks, ice
creams and gelato
Gloria Jean's Coffees is a franchised specialty coffeehouse
company that has opened more than 1,000 coffee houses across
39 markets worldwide, including over 460 in Australia. In 2014
Gloria Jeans was purchased by the Retail Food Group for $163.5
million, RFG’s largest acquisition to date
EFN415 – Queensland University of Technology Page 11
Key Executives
Retail Food Group is run by a strong group of executives, all of which have proven
experience in the food industry, and critically in the franchise systems.
Name Position
Colin Archer Independent Chairman
Anthony (Tony) Alford Non-Executive Chairman
Andre Nell Managing Director
Gary Alford CEO
Peter McGettigan CFO
Mike Gilbert Chief Franchise Officer
Damian Tarry Director of Human Resources
COMPANY STRATEGY
Competitive Strategy
RFG's upper hand lies in its franchisee model, existing store footprint and the quality of its
products. Moreover, because of the large business establishment, it is additionally feasible
for the company to adventure economies of scale. Product marketing research and
innovation, along with IT support are done at corporate level, which gives a relief to the
franchise owners. These economies of scale would not be achievable at smaller levels of
operations, which many cafes and bakeries are. As premium quality adequately shields RFG
from value rivalry, generally stable level of working costs permits the group to increase a
higher operating edge than its competitors.
Recent Highlights
Without a doubt, the highlight for Retail Food Group in the past few years has been its
acquisition of the Gloria Jeans Coffee brand. The 2015 annual report stated that the
purchase of Gloria Jean's increased RFG’s store count by 358 domestically and 420 around
the world, making Retail Food Group the "clear leader in retail food franchises specialising in
coffee". As part of this acquisition, the company elected to write down the value of sub-
scale and underperforming brands in 2015 such as BB's Cafe and Esquires Coffee by $18.5
million, denting bottom-line profits. BB's Cafe and Esquires stores were converted to Gloria
Jean's stores or Michelle's
Business Strategy
EFN415 – Queensland University of Technology Page 12
The group is proceeding to divest non-core business by the transition from a wholesale
bakery supply to Michel’s Patisserie franchisees to a more traditional royalty-based system.
While this reduced significant amounts of revenue generated from wholesale (over $20
million per annum), operating costs declined at higher rate and led to higher NPAT margin.
RFG has continued on its aggressive acquisition strategy and has recently acquired
Melbourne-based food business Hudson Pacific. The group explicitly expresses its intention
to acquire further brands to expand its franchise system and expand them into the global
market. This global expansion will allow them to tap into faster growth world markets.
Delivering on this strategy, RFG announced that during 2016, 57% of all new outlets opened
were outside of Australia.
SWOT Analysis
Strengths
By employing a franchise system, RFG has low capital investment and enjoys a healthy
percentage of revenue, which is generated by royalties from thousands of individual
franchise owners. Because RFG produces and supplies its own brand of coffee to all stores, it
ensures that a major cash outlay is kept within the business, and not put into the hands of
rivals. RFG is not afraid of altering the markets perception of the brand, it is willing to take
short term setbacks to allow the long term future of the brand to flourish, as shown by the
rebranding of stores in 2015. The group likes to hold a substantial amount of cash reserves
in order to allow the acquisition of any brands that threaten to remove market share from
RFG. At the conclusion of FY2016, the group held $17.4m in cash reserves.
Weaknesses
The RFG business owns many brands, however the popularity of these brands is a
shortcoming. Compared to brands such as Starbucks, Domino’s Pizza or Subway, there is a
large difference in brand awareness of those firms compared to the brands that RFG holds.
Whilst going forward, the group aims to be more cutting edge and develop market leading
franchises, in the past the lack of marketing initiatives and inability to acquire these
competitors at an early stage of growth may prove a hard to overcome obstacle.
EFN415 – Queensland University of Technology Page 13
Opportunities
With the acquisition of the Gloria Jeans Brand, RFG gained immediate international
exposure that it previously lacked. The past financial year has seen the commissioning of
three international coffee roasting facilities and distribution hubs to complement existing
facilities in Australia, New Zealand and North America. The group’s Los Angeles roasting
facility has been re-badged as Di Bella Coffee. Management has stated that the North
American market is a priority, and as such the business has appointed a sales and
distribution team. This team will develop coffee blends more suitable to the American taste.
The ability for the firm to penetrate into these international markets will be a key factor in
medium to long term growth for RFG. Just less than 17% of the group’s EBITDA was
generated internationally during the latest half-year. The firm’s executives expect that
measure to grow over the coming years and is demonstrated by 57% of all new openings
being located outside of Australia.
Threats
The growth of mobile technology and the ability for “on the go” ordering is something that
RFG will need to look to implement. In Australia, Domino’s Pizza has gained a stranglehold
on the Pizza industry due to its investment in ordering technology. If RFG ignore this area of
development, there is a chance the brand becomes stagnant and competitors gain an
advantage. As shown by the Porter Five Factor analysis, RFG operates in industries that
produces high risk in four out of five factors.
EFN415 – Queensland University of Technology Page 14
VALUATION
The valuation method used to give an intrinsic value of the company is a discounted cash
flow (DCF) model. While the most recent annual report is unavailable at the time of writing,
figures were released in a full year results presentation during which the FY2016 financial
statements were released. At this time, the acquisition of Hudson Pacific Corporation was
announced. These figures have been used as part of our valuation.
Capital Structure
As stated in the 2015 annual report, the target gearing ratio for the firm is between 40-60%
as the proportion of net debt to equity. The firm has a stated goal of growth through
acquisition with the purchase of Hudson Pacific expected to raise the D/E ratio to 55%.
Whilst this is not used in our valuation, we believe this is an important item of note for
investors.
Effective Tax Rate
The average effective tax rate paid by RFG over the previous three years was 26.85%. As the
nominal tax rate on enterprises in Australia is set at 30% we have used this for our model.
This rate is currently a topic of political discussion and we have factored this into our model
by lowering the tax rate to 28.50% for FY2019.
Cost of Equity
Cost of equity for RFG was calculated using the dividend growth model as opposed to the
CAPM due to the widely varying expected rates of returns on the ASX. The firm has
announced its upcoming dividend. This resulted in a cost of equity of 16.68%. We have used
this figure in our WACC calculation.
Cost of Debt
The overwhelming majority of the firm’s debt is from bank loans, and according to the latest
annual report, the weighted average effective interest rate is 4.3%. This will be used as the
cost of debt.
WACC Calculation
Using the figures outlined above for cost of equity, cost of debt and effective tax rate as well
as using the levels of total debt and equity as outlined in the latest annual report of
$276.3m (total liabilities) and $680m (total assets), the WACC figure for RFG is 12.81%
EFN415 – Queensland University of Technology Page 15
Net Borrowings
We have forecast net borrowings to increase by $50m reflecting the additional borrows that
are needed to fund the Hudson Pacific acquisition. This can be seen in the balance sheet
under total debt. We made an adjustment from the total $55m to account for timing
differences. FY2018 and FY2019 both forecast an additional $5m in borrowings to account
for the timing lapse and other expenses, such as plant or other capital requirements that
may arise from the Hudson acquisition.
Interest Expense
Interest expense has trended upwards as a result of the increase in borrowings (due to
acquisitions). For FY2017 we are predicting interest expense to rise in line with the
proposed additional borrowings. Interest futures as predicted by the ASX are showing a high
probability that the official cash rate will be lowered in the coming years, but are not pricing
in a full cut. If a rate cut occurs, it can be expected to be passed on to some extent. We have
tested the model with a rate cut of 0.25%, and the impact on share valuation is minimal. As
such we are not predicting any changes in cost of debt or market risk premium. The interest
expenses will rise in line with changes in net borrowings.
Plowback Ratio
Plowback ratio has been on average 76.55% over the last five years, and for our forecast we
have simplified this to 75%.
Changes in Working Capital
Assets
Based on the firm’s plowback ratio of 75%, we are expecting assets to rise in line
with this reinvestment policy.
Cash
Cash on hand increased following the Gloria Jeans acquisition, and as such we have
forecasted a similar increase to occur in FY2017 post Hudson acquisition. We do
forecast a year on year increase however due to the nature of the Hudson
acquisition and the business model going forward.
EFN415 – Queensland University of Technology Page 16
Current Liabilities
Similarly, for liabilities post Gloria Jeans acquisition we saw an increase in liabilities.
This reflects increase in trade, other payables and provisions. In line with this we
predict a 12% rise in liabilities for FY2017. In addition to this the firm has taken on
additional debt with the purchase of Hudson Pacific which has also been accounted
for. In FY2018 and FY2019 total liabilities will rise in line with net borrowings and our
forecasted increase in capital requirements.
Operating Activities
Revenue
We forecasted revenue predictions based on the values given by RFG during the
Hudson acquisition presentation. We have reason to believe these figures as RFG
have a demonstrated the ability to integrate and deliver on forecasted acquisition
revenue. In FY2018 we have forecasted a conservative 10% increase in revenue to
allow for the impact of a full year revenue receipt from the Hudson acquisition.
Included in this, we have allowed for growth as predicted in industry trends and that
has been observed within the existing business. FY2019 revenue growth slows down
reflecting the full year integration of Hudson, as well the realisation of the stated
acquisition benefits. These assumptions are higher than the forecasted economic
growth and inflation rates but are in line with forecasted industry growth rates.
Operating Expenses
As RFG takes control of Hudson, we forecasted a 68% increase in operating expenses
for FY2017. This increase is due to the large amount of additional capital now owned
by RFG and the hefty initial outlays that can be expected. During the Hudson
presentation RFG advised a combined targeted NPAT for FY2017. We have used this
figure to guide our prediction for the operating expense of the firm during FY2017.
The following year, FY2018, we have forecasted an increase of 12%. This figure is
again due to full year impacts, integration and restructuring costs. FY2019 sees an
expense growth of 2.5%. We forecasted this figure based on expected costs relating
to restructuring, positive impacts from vertical integrating supply lines, negated by
rising costs as per our inflation outlook.
EFN415 – Queensland University of Technology Page 17
Depreciation and Amortization
We have modelled the rate of depreciation for FY2017 to increase due to the
Hudson acquisition. As we have mentioned this acquisition will bring assets of plant,
property and equipment which we expect to have a large depreciation expense.
We’ve used the increase following the acquisition of Gloria Jeans as a baseline for
this assumption. We assume that once RFG are able to rework production scales, the
higher rate will reduce to a more constant 30% year on year increase. We believe
this reflects the more capital intensive structure of Hudson Pacific.
Terminal Value of the Firm
To arrive at the terminal value of the firm we estimated an internal growth rate based on
the plowback assumption of 75%. The ROE average of the firm has been 22%, but due to the
managements long term growth forecast of 2.5%, we forecasted a ROE of 15.2% going
forward into the future. These assumptions give the perpetuity growth rate of 3.80%. This
is above our long term growth forecast GDP growth, and the company outlook from the
Porter Five Factor does not support this. We used the assumption of 3.60%, reflecting the
deployment of the brands into the global markets producing growth at the higher end our
outlook, but within estimates for world growth.
Buy, Sell or Hold Recommendation
Using the discounted cash flow model we estimate the value of the company at
approximately $6.50. As at close of market 12 September the price was $6.55 or 1.8%
higher than our valuation. We have calculated our range based on the potential change in
terminal growth rates, using an Australian growth rate of 3.3% and a world growth rate of
3.8% as ranges. This gives an indicative price range of $6.30 - $6.60. As closing price is within
this range, we recommend to hold this share as it is currently priced adequately for its
estimated valuation.
EFN415 – Queensland University of Technology Page 18
Appendix
Appendix 1 – Valuation Model
($M) CAGR
2014 2015 2016 (14-16) 2017 2018 2019 Proposed Borrowings ($M) 50,000 276,300
Revenue 128,000 210,400 274,600 28.97% 411,900 453,090 475,745 Risk Free 1.86% 680,000
% growth 64.38% 30.51% -31.15% 10.00% 5.00% Cost of Debt 4.30%
Marginal Tax Rate 30.00%
Operating Expense 68,900 151,900 170,900 35.37% 287,112 321,565 329,605 Plowback ratio 75.00%
% growth 120.46% 12.51% -67.78% 12.00% 2.50%
Dep./Amort. 1,568- 3,707- 6,584- 61.33% 10,622- 13,809- 17,951-
% sales -1.23% -1.76% -2.40% 25.09% -2.58% -3.05% -3.77%
EBITDA 59,100 58,500 103,700 20.61% 124,788 131,525 146,140
% margin 46.17% 27.80% 37.76% -6.48% 30.30% 29.03% 30.72% Items CAGR 2017 2018 2019 Avg YOY Growth
Revenue 28.97% 50.00% 10.00% 5.00% 21.67%
Add Back Dep./Amort. 1,568- 3,707- 6,584- 10,622- 13,809- 17,951- Operating Expense 35.37% 68.00% 12.00% 2.50% 27.50%
Dep./Amort. 61.33% 61.33% 30.00% 30.00% 40.44%
EBIT 57,532 54,793 97,116 19.07% 114,166 117,716 128,189
% margin 44.95% 26.04% 35.37% -7.68% 27.72% 25.98% 26.94%
Interest Expense 4,728- 7,076- 9,195- 24.82% 11,345- 11,560- 11,775- Interest Expense 24.82% 0.00% 0.00% 0.00% 0.00%
% growth Tax -26.85% 30.00% 30.00% 28.50% 29.50%
Net Income 24.26% 24.26% 24.26% 24.26% 24.26%
EBT 52,804 47,717 87,921 18.52% 102,821 106,156 116,414
41.25% 22.68% 32.02%
Items CAGR 2017 2018 2019 Avg YOY Growth
Tax 15,890- 14,165- 26,287- 18.27% 30,846- 31,847- 33,178- Current Assets 20.82% 7.00% 7.00% 7.00% 7.00%
Calculated Tax Rate -27.62% -25.85% -27.07% -26.85% Cash and Cash Equi. 14.62% 14.62% 1.50% 1.50% 5.87%
Current Liabilities 37.54% 12.00% 2.50% 2.50% 5.67%
Total Debt 50,000 5,000 5,000
Net Income 36,914 40,628 70,829 24.26% 71,975 85,869 95,011
% margin 28.84% 19.31% 25.79% -3.65% 17.47% 18.95% 19.97%
% growth -33.04% 33.58% 0.81% -32.25% 8.46% 5.38%
Change in NWC 38,468- 46,670 86,982 11,372 12,231
Free Cash Flow 5,867 124,083 180,924 111,050 125,193
WACC 12.810%
Discount Period 1.0 2.0 3.0
Discount Factor 0.8864 0.7858 0.6966
PV of Free Cash Flow 160,379 87,262 87,204
($M) CAGR
2014 2015 2016 (14-16) 2017 2018 2019
Current Assets 50,659 90,182 89,346 20.82% 182,270 195,029 208,681
Cash and Cash Equi. (Included) 11,559 17,149 17,406 14.62% 19,951 20,250 20,554
Liabilities
Current Liabilities 19,034 97,025 49,519 37.54% 55,461 56,848 58,269
Net Borrowings 68,949 156,169 206,607 50,000 5,000 5,000
Net Working Capital
31,625 6,843- 39,827 7.99% 126,809 138,181 150,412
Terminal Value
Terminal Year Free Cash Flow 125,193
Perpetuity Growth Rate 3.60%
Terminal Year EBITDA 146,140
Terminal Value 1,408,249
Implied Exit Multiple 10.23
Discount Period 4
Discount Factor 0.6558
Present Value of Terminal Value 923,555
% of Enterprise Value 1
Enterprise value
Present value of Free Cash Flow 334,845
Terminal Value 1,408,249
Discount Factor 0.6558
Present Value of Terminal Value 1,258,400
% of Enterprise Value 100.00%
Enterprise value 1,258,400
Less: Total debt 206,772-
Plus: Cash and Cash Equi. 17,406
Net Debt 189,366
Implied Equity Value 1,069,034
Number of shares on issue (M) 164968
Implied share price 6.48$
Balance Sheet
Balance Sheet
Historical Forecast
Equity ($M)
Growth Model
Cash Flow
Historical Forecast Inputs (For 2017) Inputs (At EOFY 16)
Debt ($M)
EFN415 – Queensland University of Technology Page 19
References
ABS. (2016). Retrieved from ABS: http://www.abs.gov.au/
ASX. (2016). Retrieved from ASX: http://www.asx.com.au/data/trt/ib_expectation_curve_graph.pdf
Bank, W. (2016). Retrieved from World Bank:
http://data.worldbank.org/indicator/SL.UEM.TOTL.NE.ZS
Dominos. (2016). Annual Report. Dominos. Retrieved from http://dominosinvestors.com.au/reports-
presentations
IBISWorld. (2016). Australian Industry Report. IBISWorld.
IMF. (2016). World Economic Outlook Update, International Monetary Fund, January . IMF.
Melbourne, U. o. (2016, July). Retrieved from University of Melbourne:
https://melbourneinstitute.com/miaesr/publications/indicators/csi.html
OECD. (2013). OECD Economic Outlook volume 2013/1, Growth Prospects and Fiscal Requirements
over the long term. OECD. Retrieved from OECD:
https://www.oecd.org/eco/growth/Growth-prospects-and-fiscal-requirements-over-the-
long-term.pdf
Reserve Bank of Australia. (2016). Retrieved from Reserve Bank of Australia:
http://www.rba.gov.au/statistics/
Retail Food Group . (2015). Annual Report 2015. RFG.
Retail Food Group. (2012). Annual Report 2012. RFG.
Retail Food Group. (2013). Annual Report 2013. RFG.
Retail Food Group. (2014). Annual Report 2014. RFG.
Retail Food Group. (2016). FY2016 Presentation. Retrieved from RFG: https://www.rfg.com.au/
EFN415 – Queensland University of Technology Page 20

More Related Content

What's hot

The World This Week - 9th to 13th May, 2016
The World This Week - 9th to 13th May, 2016The World This Week - 9th to 13th May, 2016
The World This Week - 9th to 13th May, 2016Karvy Private Wealth
 
The World This Week - 2nd to 06th May 2016
The World This Week - 2nd to 06th May 2016The World This Week - 2nd to 06th May 2016
The World This Week - 2nd to 06th May 2016Karvy Private Wealth
 
Special report-09-apr-2019-epic-research
Special report-09-apr-2019-epic-researchSpecial report-09-apr-2019-epic-research
Special report-09-apr-2019-epic-researchEpic Research Limited
 
The World This Week - 15th Feb to 19th Feb, 2016
The World This Week - 15th Feb to 19th Feb, 2016The World This Week - 15th Feb to 19th Feb, 2016
The World This Week - 15th Feb to 19th Feb, 2016Karvy Private Wealth
 
The World This Week - 25th to 29th April, 2016
The World This Week - 25th to 29th April, 2016The World This Week - 25th to 29th April, 2016
The World This Week - 25th to 29th April, 2016Karvy Private Wealth
 
The World This Week - 4th to 8th July, 2016
The World This Week - 4th to 8th July, 2016The World This Week - 4th to 8th July, 2016
The World This Week - 4th to 8th July, 2016Karvy Private Wealth
 
The World This Week - 16th to 19th August, 2016
The World This Week - 16th to 19th August, 2016The World This Week - 16th to 19th August, 2016
The World This Week - 16th to 19th August, 2016Karvy Private Wealth
 
The World This Week - 8th to 12th August, 2016
The World This Week - 8th to 12th August, 2016The World This Week - 8th to 12th August, 2016
The World This Week - 8th to 12th August, 2016Karvy Private Wealth
 
The World This Week November 14 - November 18 2016
The World This Week November 14 - November 18 2016The World This Week November 14 - November 18 2016
The World This Week November 14 - November 18 2016Karvy Private Wealth
 
The World This Week October 31 - November 4 - 2016
The World This Week October 31 - November 4 - 2016The World This Week October 31 - November 4 - 2016
The World This Week October 31 - November 4 - 2016Karvy Private Wealth
 
Advice for the Wise - September 2016
Advice for the Wise - September 2016Advice for the Wise - September 2016
Advice for the Wise - September 2016Karvy Private Wealth
 
The world this week October 10 - October 14 - 2016
The world this week October  10 - October 14  - 2016The world this week October  10 - October 14  - 2016
The world this week October 10 - October 14 - 2016Karvy Private Wealth
 
The World This Week - 18th to 22nd July, 2016
The World This Week - 18th to 22nd July, 2016The World This Week - 18th to 22nd July, 2016
The World This Week - 18th to 22nd July, 2016Karvy Private Wealth
 
The World This Week - 11th to 15th July, 2016
The World This Week - 11th to 15th July, 2016The World This Week - 11th to 15th July, 2016
The World This Week - 11th to 15th July, 2016Karvy Private Wealth
 
The World This Week - 18th - 22nd April, 2016
The World This Week - 18th - 22nd April, 2016The World This Week - 18th - 22nd April, 2016
The World This Week - 18th - 22nd April, 2016Karvy Private Wealth
 

What's hot (20)

Advice for the Wise - August 2016
Advice for the Wise - August 2016Advice for the Wise - August 2016
Advice for the Wise - August 2016
 
Advice for the Wise - May 2016
Advice for the Wise - May 2016Advice for the Wise - May 2016
Advice for the Wise - May 2016
 
The World This Week - 9th to 13th May, 2016
The World This Week - 9th to 13th May, 2016The World This Week - 9th to 13th May, 2016
The World This Week - 9th to 13th May, 2016
 
The World This Week - 2nd to 06th May 2016
The World This Week - 2nd to 06th May 2016The World This Week - 2nd to 06th May 2016
The World This Week - 2nd to 06th May 2016
 
Special report-09-apr-2019-epic-research
Special report-09-apr-2019-epic-researchSpecial report-09-apr-2019-epic-research
Special report-09-apr-2019-epic-research
 
The World This Week - 15th Feb to 19th Feb, 2016
The World This Week - 15th Feb to 19th Feb, 2016The World This Week - 15th Feb to 19th Feb, 2016
The World This Week - 15th Feb to 19th Feb, 2016
 
The World This Week - 25th to 29th April, 2016
The World This Week - 25th to 29th April, 2016The World This Week - 25th to 29th April, 2016
The World This Week - 25th to 29th April, 2016
 
The World This Week - 4th to 8th July, 2016
The World This Week - 4th to 8th July, 2016The World This Week - 4th to 8th July, 2016
The World This Week - 4th to 8th July, 2016
 
The World This Week - 16th to 19th August, 2016
The World This Week - 16th to 19th August, 2016The World This Week - 16th to 19th August, 2016
The World This Week - 16th to 19th August, 2016
 
aa_sp15
aa_sp15aa_sp15
aa_sp15
 
Advice For The Wise - April 2016
Advice For The Wise - April 2016Advice For The Wise - April 2016
Advice For The Wise - April 2016
 
Advice for the Wise October 2016
Advice for the Wise   October 2016Advice for the Wise   October 2016
Advice for the Wise October 2016
 
The World This Week - 8th to 12th August, 2016
The World This Week - 8th to 12th August, 2016The World This Week - 8th to 12th August, 2016
The World This Week - 8th to 12th August, 2016
 
The World This Week November 14 - November 18 2016
The World This Week November 14 - November 18 2016The World This Week November 14 - November 18 2016
The World This Week November 14 - November 18 2016
 
The World This Week October 31 - November 4 - 2016
The World This Week October 31 - November 4 - 2016The World This Week October 31 - November 4 - 2016
The World This Week October 31 - November 4 - 2016
 
Advice for the Wise - September 2016
Advice for the Wise - September 2016Advice for the Wise - September 2016
Advice for the Wise - September 2016
 
The world this week October 10 - October 14 - 2016
The world this week October  10 - October 14  - 2016The world this week October  10 - October 14  - 2016
The world this week October 10 - October 14 - 2016
 
The World This Week - 18th to 22nd July, 2016
The World This Week - 18th to 22nd July, 2016The World This Week - 18th to 22nd July, 2016
The World This Week - 18th to 22nd July, 2016
 
The World This Week - 11th to 15th July, 2016
The World This Week - 11th to 15th July, 2016The World This Week - 11th to 15th July, 2016
The World This Week - 11th to 15th July, 2016
 
The World This Week - 18th - 22nd April, 2016
The World This Week - 18th - 22nd April, 2016The World This Week - 18th - 22nd April, 2016
The World This Week - 18th - 22nd April, 2016
 

Similar to Retail Food Group Valuation

WestpacWeekly 31 August 2015
WestpacWeekly 31 August 2015WestpacWeekly 31 August 2015
WestpacWeekly 31 August 2015Melanie Pope
 
MSFCap2016FP_Group6
MSFCap2016FP_Group6MSFCap2016FP_Group6
MSFCap2016FP_Group6Gavin Yeh
 
BSIF Investment-Environment-Committee-Report-Spring-2016
BSIF Investment-Environment-Committee-Report-Spring-2016BSIF Investment-Environment-Committee-Report-Spring-2016
BSIF Investment-Environment-Committee-Report-Spring-2016Julian Fung
 
Investment Outlook 2016 - Franklin Templeton Investments
Investment Outlook 2016 - Franklin Templeton InvestmentsInvestment Outlook 2016 - Franklin Templeton Investments
Investment Outlook 2016 - Franklin Templeton InvestmentsCarlos Francisco Gómez Guzmán
 
Laurentian Bank Securities - Economic Research and Strategy
Laurentian Bank Securities - Economic Research and Strategy Laurentian Bank Securities - Economic Research and Strategy
Laurentian Bank Securities - Economic Research and Strategy Mark MacIsaac
 
Economic forecast-summary-russia-oecd-economic-outlook-november-2016
Economic forecast-summary-russia-oecd-economic-outlook-november-2016Economic forecast-summary-russia-oecd-economic-outlook-november-2016
Economic forecast-summary-russia-oecd-economic-outlook-november-2016Bankir_Ru
 
150925 insights stick_to_staple_plays
150925 insights stick_to_staple_plays150925 insights stick_to_staple_plays
150925 insights stick_to_staple_playsChen Linda
 
‘Over the Horizon’ share market commentary – March 2014
‘Over the Horizon’ share market commentary – March 2014‘Over the Horizon’ share market commentary – March 2014
‘Over the Horizon’ share market commentary – March 2014David Offer
 
‘Over the Horizon’ share market commentary – March 2014
‘Over the Horizon’ share market commentary – March 2014‘Over the Horizon’ share market commentary – March 2014
‘Over the Horizon’ share market commentary – March 2014David Offer
 
LBS Asset Allocation August Update - July 28, 2017
LBS Asset Allocation August Update - July 28, 2017LBS Asset Allocation August Update - July 28, 2017
LBS Asset Allocation August Update - July 28, 2017Mark MacIsaac
 
The World This Week - August 26 - August 30, 2013
The World This Week - August 26 - August 30, 2013The World This Week - August 26 - August 30, 2013
The World This Week - August 26 - August 30, 2013Karvy Private Wealth
 
Stanford Endowment Fund - Asset Allocation
Stanford Endowment Fund - Asset AllocationStanford Endowment Fund - Asset Allocation
Stanford Endowment Fund - Asset AllocationKUN YANG
 
Mpb investment matters apr 2017
Mpb investment matters apr 2017Mpb investment matters apr 2017
Mpb investment matters apr 2017Terry Menage
 
Economic Outlook- Nov'15
Economic Outlook- Nov'15Economic Outlook- Nov'15
Economic Outlook- Nov'15choice broking
 
Cdl research nigeria-inflation_monitor_july_2013_and_fixed_income_market_review
Cdl research nigeria-inflation_monitor_july_2013_and_fixed_income_market_reviewCdl research nigeria-inflation_monitor_july_2013_and_fixed_income_market_review
Cdl research nigeria-inflation_monitor_july_2013_and_fixed_income_market_reviewsenjbine
 

Similar to Retail Food Group Valuation (20)

WestpacWeekly 31 August 2015
WestpacWeekly 31 August 2015WestpacWeekly 31 August 2015
WestpacWeekly 31 August 2015
 
MSFCap2016FP_Group6
MSFCap2016FP_Group6MSFCap2016FP_Group6
MSFCap2016FP_Group6
 
FOMC - Federal Reserve Meeting Transcript March 16 2016
FOMC - Federal Reserve Meeting Transcript March 16 2016FOMC - Federal Reserve Meeting Transcript March 16 2016
FOMC - Federal Reserve Meeting Transcript March 16 2016
 
xTAP QuarterlyLetter 201609
xTAP QuarterlyLetter 201609xTAP QuarterlyLetter 201609
xTAP QuarterlyLetter 201609
 
TAP QuarterlyLetter 201603
TAP QuarterlyLetter 201603TAP QuarterlyLetter 201603
TAP QuarterlyLetter 201603
 
BSIF Investment-Environment-Committee-Report-Spring-2016
BSIF Investment-Environment-Committee-Report-Spring-2016BSIF Investment-Environment-Committee-Report-Spring-2016
BSIF Investment-Environment-Committee-Report-Spring-2016
 
HSBC-News30
HSBC-News30HSBC-News30
HSBC-News30
 
Investment Outlook 2016 - Franklin Templeton Investments
Investment Outlook 2016 - Franklin Templeton InvestmentsInvestment Outlook 2016 - Franklin Templeton Investments
Investment Outlook 2016 - Franklin Templeton Investments
 
Laurentian Bank Securities - Economic Research and Strategy
Laurentian Bank Securities - Economic Research and Strategy Laurentian Bank Securities - Economic Research and Strategy
Laurentian Bank Securities - Economic Research and Strategy
 
Economic forecast-summary-russia-oecd-economic-outlook-november-2016
Economic forecast-summary-russia-oecd-economic-outlook-november-2016Economic forecast-summary-russia-oecd-economic-outlook-november-2016
Economic forecast-summary-russia-oecd-economic-outlook-november-2016
 
150925 insights stick_to_staple_plays
150925 insights stick_to_staple_plays150925 insights stick_to_staple_plays
150925 insights stick_to_staple_plays
 
‘Over the Horizon’ share market commentary – March 2014
‘Over the Horizon’ share market commentary – March 2014‘Over the Horizon’ share market commentary – March 2014
‘Over the Horizon’ share market commentary – March 2014
 
‘Over the Horizon’ share market commentary – March 2014
‘Over the Horizon’ share market commentary – March 2014‘Over the Horizon’ share market commentary – March 2014
‘Over the Horizon’ share market commentary – March 2014
 
LBS Asset Allocation August Update - July 28, 2017
LBS Asset Allocation August Update - July 28, 2017LBS Asset Allocation August Update - July 28, 2017
LBS Asset Allocation August Update - July 28, 2017
 
Mps current
Mps currentMps current
Mps current
 
The World This Week - August 26 - August 30, 2013
The World This Week - August 26 - August 30, 2013The World This Week - August 26 - August 30, 2013
The World This Week - August 26 - August 30, 2013
 
Stanford Endowment Fund - Asset Allocation
Stanford Endowment Fund - Asset AllocationStanford Endowment Fund - Asset Allocation
Stanford Endowment Fund - Asset Allocation
 
Mpb investment matters apr 2017
Mpb investment matters apr 2017Mpb investment matters apr 2017
Mpb investment matters apr 2017
 
Economic Outlook- Nov'15
Economic Outlook- Nov'15Economic Outlook- Nov'15
Economic Outlook- Nov'15
 
Cdl research nigeria-inflation_monitor_july_2013_and_fixed_income_market_review
Cdl research nigeria-inflation_monitor_july_2013_and_fixed_income_market_reviewCdl research nigeria-inflation_monitor_july_2013_and_fixed_income_market_review
Cdl research nigeria-inflation_monitor_july_2013_and_fixed_income_market_review
 

Recently uploaded

Instant Issue Debit Cards - School Designs
Instant Issue Debit Cards - School DesignsInstant Issue Debit Cards - School Designs
Instant Issue Debit Cards - School Designsegoetzinger
 
Quarter 4- Module 3 Principles of Marketing
Quarter 4- Module 3 Principles of MarketingQuarter 4- Module 3 Principles of Marketing
Quarter 4- Module 3 Principles of MarketingMaristelaRamos12
 
VIP Call Girls LB Nagar ( Hyderabad ) Phone 8250192130 | ₹5k To 25k With Room...
VIP Call Girls LB Nagar ( Hyderabad ) Phone 8250192130 | ₹5k To 25k With Room...VIP Call Girls LB Nagar ( Hyderabad ) Phone 8250192130 | ₹5k To 25k With Room...
VIP Call Girls LB Nagar ( Hyderabad ) Phone 8250192130 | ₹5k To 25k With Room...Suhani Kapoor
 
VIP Kolkata Call Girl Jodhpur Park 👉 8250192130 Available With Room
VIP Kolkata Call Girl Jodhpur Park 👉 8250192130  Available With RoomVIP Kolkata Call Girl Jodhpur Park 👉 8250192130  Available With Room
VIP Kolkata Call Girl Jodhpur Park 👉 8250192130 Available With Roomdivyansh0kumar0
 
03_Emmanuel Ndiaye_Degroof Petercam.pptx
03_Emmanuel Ndiaye_Degroof Petercam.pptx03_Emmanuel Ndiaye_Degroof Petercam.pptx
03_Emmanuel Ndiaye_Degroof Petercam.pptxFinTech Belgium
 
02_Fabio Colombo_Accenture_MeetupDora&Cybersecurity.pptx
02_Fabio Colombo_Accenture_MeetupDora&Cybersecurity.pptx02_Fabio Colombo_Accenture_MeetupDora&Cybersecurity.pptx
02_Fabio Colombo_Accenture_MeetupDora&Cybersecurity.pptxFinTech Belgium
 
Booking open Available Pune Call Girls Shivane 6297143586 Call Hot Indian Gi...
Booking open Available Pune Call Girls Shivane  6297143586 Call Hot Indian Gi...Booking open Available Pune Call Girls Shivane  6297143586 Call Hot Indian Gi...
Booking open Available Pune Call Girls Shivane 6297143586 Call Hot Indian Gi...Call Girls in Nagpur High Profile
 
00_Main ppt_MeetupDORA&CyberSecurity.pptx
00_Main ppt_MeetupDORA&CyberSecurity.pptx00_Main ppt_MeetupDORA&CyberSecurity.pptx
00_Main ppt_MeetupDORA&CyberSecurity.pptxFinTech Belgium
 
TEST BANK For Corporate Finance, 13th Edition By Stephen Ross, Randolph Weste...
TEST BANK For Corporate Finance, 13th Edition By Stephen Ross, Randolph Weste...TEST BANK For Corporate Finance, 13th Edition By Stephen Ross, Randolph Weste...
TEST BANK For Corporate Finance, 13th Edition By Stephen Ross, Randolph Weste...ssifa0344
 
(ANIKA) Budhwar Peth Call Girls Just Call 7001035870 [ Cash on Delivery ] Pun...
(ANIKA) Budhwar Peth Call Girls Just Call 7001035870 [ Cash on Delivery ] Pun...(ANIKA) Budhwar Peth Call Girls Just Call 7001035870 [ Cash on Delivery ] Pun...
(ANIKA) Budhwar Peth Call Girls Just Call 7001035870 [ Cash on Delivery ] Pun...ranjana rawat
 
Independent Call Girl Number in Kurla Mumbai📲 Pooja Nehwal 9892124323 💞 Full ...
Independent Call Girl Number in Kurla Mumbai📲 Pooja Nehwal 9892124323 💞 Full ...Independent Call Girl Number in Kurla Mumbai📲 Pooja Nehwal 9892124323 💞 Full ...
Independent Call Girl Number in Kurla Mumbai📲 Pooja Nehwal 9892124323 💞 Full ...Pooja Nehwal
 
OAT_RI_Ep19 WeighingTheRisks_Apr24_TheYellowMetal.pptx
OAT_RI_Ep19 WeighingTheRisks_Apr24_TheYellowMetal.pptxOAT_RI_Ep19 WeighingTheRisks_Apr24_TheYellowMetal.pptx
OAT_RI_Ep19 WeighingTheRisks_Apr24_TheYellowMetal.pptxhiddenlevers
 
05_Annelore Lenoir_Docbyte_MeetupDora&Cybersecurity.pptx
05_Annelore Lenoir_Docbyte_MeetupDora&Cybersecurity.pptx05_Annelore Lenoir_Docbyte_MeetupDora&Cybersecurity.pptx
05_Annelore Lenoir_Docbyte_MeetupDora&Cybersecurity.pptxFinTech Belgium
 
(DIYA) Bhumkar Chowk Call Girls Just Call 7001035870 [ Cash on Delivery ] Pun...
(DIYA) Bhumkar Chowk Call Girls Just Call 7001035870 [ Cash on Delivery ] Pun...(DIYA) Bhumkar Chowk Call Girls Just Call 7001035870 [ Cash on Delivery ] Pun...
(DIYA) Bhumkar Chowk Call Girls Just Call 7001035870 [ Cash on Delivery ] Pun...ranjana rawat
 
Call US 📞 9892124323 ✅ Kurla Call Girls In Kurla ( Mumbai ) secure service
Call US 📞 9892124323 ✅ Kurla Call Girls In Kurla ( Mumbai ) secure serviceCall US 📞 9892124323 ✅ Kurla Call Girls In Kurla ( Mumbai ) secure service
Call US 📞 9892124323 ✅ Kurla Call Girls In Kurla ( Mumbai ) secure servicePooja Nehwal
 
High Class Call Girls Nagpur Grishma Call 7001035870 Meet With Nagpur Escorts
High Class Call Girls Nagpur Grishma Call 7001035870 Meet With Nagpur EscortsHigh Class Call Girls Nagpur Grishma Call 7001035870 Meet With Nagpur Escorts
High Class Call Girls Nagpur Grishma Call 7001035870 Meet With Nagpur Escortsranjana rawat
 
VVIP Pune Call Girls Katraj (7001035870) Pune Escorts Nearby with Complete Sa...
VVIP Pune Call Girls Katraj (7001035870) Pune Escorts Nearby with Complete Sa...VVIP Pune Call Girls Katraj (7001035870) Pune Escorts Nearby with Complete Sa...
VVIP Pune Call Girls Katraj (7001035870) Pune Escorts Nearby with Complete Sa...Call Girls in Nagpur High Profile
 
The Economic History of the U.S. Lecture 19.pdf
The Economic History of the U.S. Lecture 19.pdfThe Economic History of the U.S. Lecture 19.pdf
The Economic History of the U.S. Lecture 19.pdfGale Pooley
 
Best VIP Call Girls Noida Sector 18 Call Me: 8448380779
Best VIP Call Girls Noida Sector 18 Call Me: 8448380779Best VIP Call Girls Noida Sector 18 Call Me: 8448380779
Best VIP Call Girls Noida Sector 18 Call Me: 8448380779Delhi Call girls
 

Recently uploaded (20)

Instant Issue Debit Cards - School Designs
Instant Issue Debit Cards - School DesignsInstant Issue Debit Cards - School Designs
Instant Issue Debit Cards - School Designs
 
Quarter 4- Module 3 Principles of Marketing
Quarter 4- Module 3 Principles of MarketingQuarter 4- Module 3 Principles of Marketing
Quarter 4- Module 3 Principles of Marketing
 
VIP Call Girls LB Nagar ( Hyderabad ) Phone 8250192130 | ₹5k To 25k With Room...
VIP Call Girls LB Nagar ( Hyderabad ) Phone 8250192130 | ₹5k To 25k With Room...VIP Call Girls LB Nagar ( Hyderabad ) Phone 8250192130 | ₹5k To 25k With Room...
VIP Call Girls LB Nagar ( Hyderabad ) Phone 8250192130 | ₹5k To 25k With Room...
 
Commercial Bank Economic Capsule - April 2024
Commercial Bank Economic Capsule - April 2024Commercial Bank Economic Capsule - April 2024
Commercial Bank Economic Capsule - April 2024
 
VIP Kolkata Call Girl Jodhpur Park 👉 8250192130 Available With Room
VIP Kolkata Call Girl Jodhpur Park 👉 8250192130  Available With RoomVIP Kolkata Call Girl Jodhpur Park 👉 8250192130  Available With Room
VIP Kolkata Call Girl Jodhpur Park 👉 8250192130 Available With Room
 
03_Emmanuel Ndiaye_Degroof Petercam.pptx
03_Emmanuel Ndiaye_Degroof Petercam.pptx03_Emmanuel Ndiaye_Degroof Petercam.pptx
03_Emmanuel Ndiaye_Degroof Petercam.pptx
 
02_Fabio Colombo_Accenture_MeetupDora&Cybersecurity.pptx
02_Fabio Colombo_Accenture_MeetupDora&Cybersecurity.pptx02_Fabio Colombo_Accenture_MeetupDora&Cybersecurity.pptx
02_Fabio Colombo_Accenture_MeetupDora&Cybersecurity.pptx
 
Booking open Available Pune Call Girls Shivane 6297143586 Call Hot Indian Gi...
Booking open Available Pune Call Girls Shivane  6297143586 Call Hot Indian Gi...Booking open Available Pune Call Girls Shivane  6297143586 Call Hot Indian Gi...
Booking open Available Pune Call Girls Shivane 6297143586 Call Hot Indian Gi...
 
00_Main ppt_MeetupDORA&CyberSecurity.pptx
00_Main ppt_MeetupDORA&CyberSecurity.pptx00_Main ppt_MeetupDORA&CyberSecurity.pptx
00_Main ppt_MeetupDORA&CyberSecurity.pptx
 
TEST BANK For Corporate Finance, 13th Edition By Stephen Ross, Randolph Weste...
TEST BANK For Corporate Finance, 13th Edition By Stephen Ross, Randolph Weste...TEST BANK For Corporate Finance, 13th Edition By Stephen Ross, Randolph Weste...
TEST BANK For Corporate Finance, 13th Edition By Stephen Ross, Randolph Weste...
 
(ANIKA) Budhwar Peth Call Girls Just Call 7001035870 [ Cash on Delivery ] Pun...
(ANIKA) Budhwar Peth Call Girls Just Call 7001035870 [ Cash on Delivery ] Pun...(ANIKA) Budhwar Peth Call Girls Just Call 7001035870 [ Cash on Delivery ] Pun...
(ANIKA) Budhwar Peth Call Girls Just Call 7001035870 [ Cash on Delivery ] Pun...
 
Independent Call Girl Number in Kurla Mumbai📲 Pooja Nehwal 9892124323 💞 Full ...
Independent Call Girl Number in Kurla Mumbai📲 Pooja Nehwal 9892124323 💞 Full ...Independent Call Girl Number in Kurla Mumbai📲 Pooja Nehwal 9892124323 💞 Full ...
Independent Call Girl Number in Kurla Mumbai📲 Pooja Nehwal 9892124323 💞 Full ...
 
OAT_RI_Ep19 WeighingTheRisks_Apr24_TheYellowMetal.pptx
OAT_RI_Ep19 WeighingTheRisks_Apr24_TheYellowMetal.pptxOAT_RI_Ep19 WeighingTheRisks_Apr24_TheYellowMetal.pptx
OAT_RI_Ep19 WeighingTheRisks_Apr24_TheYellowMetal.pptx
 
05_Annelore Lenoir_Docbyte_MeetupDora&Cybersecurity.pptx
05_Annelore Lenoir_Docbyte_MeetupDora&Cybersecurity.pptx05_Annelore Lenoir_Docbyte_MeetupDora&Cybersecurity.pptx
05_Annelore Lenoir_Docbyte_MeetupDora&Cybersecurity.pptx
 
(DIYA) Bhumkar Chowk Call Girls Just Call 7001035870 [ Cash on Delivery ] Pun...
(DIYA) Bhumkar Chowk Call Girls Just Call 7001035870 [ Cash on Delivery ] Pun...(DIYA) Bhumkar Chowk Call Girls Just Call 7001035870 [ Cash on Delivery ] Pun...
(DIYA) Bhumkar Chowk Call Girls Just Call 7001035870 [ Cash on Delivery ] Pun...
 
Call US 📞 9892124323 ✅ Kurla Call Girls In Kurla ( Mumbai ) secure service
Call US 📞 9892124323 ✅ Kurla Call Girls In Kurla ( Mumbai ) secure serviceCall US 📞 9892124323 ✅ Kurla Call Girls In Kurla ( Mumbai ) secure service
Call US 📞 9892124323 ✅ Kurla Call Girls In Kurla ( Mumbai ) secure service
 
High Class Call Girls Nagpur Grishma Call 7001035870 Meet With Nagpur Escorts
High Class Call Girls Nagpur Grishma Call 7001035870 Meet With Nagpur EscortsHigh Class Call Girls Nagpur Grishma Call 7001035870 Meet With Nagpur Escorts
High Class Call Girls Nagpur Grishma Call 7001035870 Meet With Nagpur Escorts
 
VVIP Pune Call Girls Katraj (7001035870) Pune Escorts Nearby with Complete Sa...
VVIP Pune Call Girls Katraj (7001035870) Pune Escorts Nearby with Complete Sa...VVIP Pune Call Girls Katraj (7001035870) Pune Escorts Nearby with Complete Sa...
VVIP Pune Call Girls Katraj (7001035870) Pune Escorts Nearby with Complete Sa...
 
The Economic History of the U.S. Lecture 19.pdf
The Economic History of the U.S. Lecture 19.pdfThe Economic History of the U.S. Lecture 19.pdf
The Economic History of the U.S. Lecture 19.pdf
 
Best VIP Call Girls Noida Sector 18 Call Me: 8448380779
Best VIP Call Girls Noida Sector 18 Call Me: 8448380779Best VIP Call Girls Noida Sector 18 Call Me: 8448380779
Best VIP Call Girls Noida Sector 18 Call Me: 8448380779
 

Retail Food Group Valuation

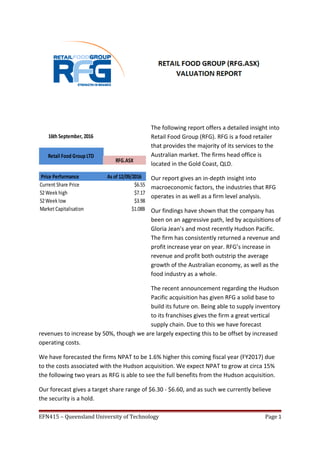
  • 1. The following report offers a detailed insight into Retail Food Group (RFG). RFG is a food retailer that provides the majority of its services to the Australian market. The firms head office is located in the Gold Coast, QLD. Our report gives an in-depth insight into macroeconomic factors, the industries that RFG operates in as well as a firm level analysis. Our findings have shown that the company has been on an aggressive path, led by acquisitions of Gloria Jean’s and most recently Hudson Pacific. The firm has consistently returned a revenue and profit increase year on year. RFG’s increase in revenue and profit both outstrip the average growth of the Australian economy, as well as the food industry as a whole. The recent announcement regarding the Hudson Pacific acquisition has given RFG a solid base to build its future on. Being able to supply inventory to its franchises gives the firm a great vertical supply chain. Due to this we have forecast revenues to increase by 50%, though we are largely expecting this to be offset by increased operating costs. We have forecasted the firms NPAT to be 1.6% higher this coming fiscal year (FY2017) due to the costs associated with the Hudson acquisition. We expect NPAT to grow at circa 15% the following two years as RFG is able to see the full benefits from the Hudson acquisition. Our forecast gives a target share range of $6.30 - $6.60, and as such we currently believe the security is a hold. EFN415 – Queensland University of Technology Page 1 Current Share Price $6.55 52Week high $7.17 52Week low $3.98 Market Capitalisation $1.08B 16th September, 2016 Retail Food Group LTD RFG.ASX Price Performance As of 12/09/2016
  • 2. Table of Contents Table of Contents...................................................................................................................................2 ECONOMIC ANALYSIS - MARKET SUMMARY.........................................................................................3 Gross Domestic Product....................................................................................................................3 Interest Rates....................................................................................................................................4 Inflation Rates...................................................................................................................................5 Unemployment Rates........................................................................................................................5 Australian Consumer Confidence......................................................................................................6 INDUSTRY ANALYSIS..............................................................................................................................7 Porter’s Five Forces Analysis..............................................................................................................7 Threat of Existing Competitors......................................................................................................7 Threat of New Entrants..................................................................................................................9 Threat of Substitute Products........................................................................................................9 Threat of Bargaining Power of Buyers.........................................................................................10 COMPANY ANALYSIS............................................................................................................................10 Company Profile..............................................................................................................................10 Key Executives.............................................................................................................................12 COMPANY STRATEGY.......................................................................................................................12 Competitive Strategy...................................................................................................................12 Recent Highlights.........................................................................................................................12 Business Strategy.........................................................................................................................12 SWOT Analysis.................................................................................................................................13 VALUATION..........................................................................................................................................15 Buy, Sell or Hold Recommendation.....................................................................................................18 Appendix..............................................................................................................................................19 References...........................................................................................................................................20 ............................................................................................................................................................20 EFN415 – Queensland University of Technology Page 2
  • 3. ECONOMIC ANALYSIS - MARKET SUMMARY Gross Domestic Product Risk: Neutral – Positive Outlook: 3.3%-3.6% After the Global Financial Crisis in 2007 the world has experienced slow growth. Its impact is still being experienced today in some parts. In addition to this, during the World Economic Outlook forum of 2016 the International Monetary Fund (IMF) stated that annual growth for both the United States of America (USA) and Europe has been shown to be slowing. Despite this, the global economy has continued to grow, albeit at a slower than average pace and is predicted to grow at 3.8% for 2017 (IMF, 2016). Commodity prices have recently trended upwards which is a positive sign for the global economy as well as the Australian economy which is heavily dependent on commodities. According to the official Reserve Bank of Australia (RBA) figures, the Australian economy grew by 3.1% in 2016 compared to 2.9% in 2015. It is the largest percentage expansion since 2012. The Australian Bureau of Statistics (ABS, 2016) says that an increase in both household consumption expenditure and public gross fixed capital formation has been the major drivers for this growth. Although there have not been significant contributions from net exports, the Australian dollar has been able to retain its strong position. Gross domestic product (GDP) is slightly higher than RBA forecasts for the third quarter and GDP growth rate has risen above forecasts to 3.30%. This increase is most likely due to the fact that the domestic economy has begun to advance from the mining collapse as well as seeing the benefits from the aforementioned improving commodity prices. EFN415 – Queensland University of Technology Page 3 Figure 1 Figure 2
  • 4. Our outlook is neutral-positive as household consumption and public capital formation are currently negating the risk associated with the end of the mining boom. In the short term our outlook has used the IMF projections. Our longer term view uses the Organisation for Economic Cooperation and Development (OECD) forecasted growth. The growth that was projected is 3.0% - 3.2% for the Australian economy and a global growth target of 3.5% - 3.8%. These forecast ranges are an estimate for the next fifteen years. Interest Rates Risk: Positive Outlook – Easing bias The RBA met on the 6th of September, 2017 and decided to leave the official cash rate unchanged at 1.50%. The RBA had made a number of observations around the global economy and how it was tracking. Funding costs for borrowers remain low, as evident by the record low cash rate and the monetary policies around the world remain accommodative. As at the 9th September, the Cash Rate Futures implied yield curve shows a 76% current market expectation of a potential further rate cut by September 2017. This can be seen as an easing bias in market expectations. Our outlook takes this bias into consideration. EFN415 – Queensland University of Technology Page 4 Figure 3 Figure 4
  • 5. Inflation Rates Risk: Low Outlook: 1.5%-2.5% The recent outlook on employment rates and wage growth has a tendency to push down inflation. Nonetheless, the depreciation in the exchange rate is likely to have upward pressure on inflation rates in the Australian economy. These two effects are expected to offset one another. Therefore, we forecast that inflation at the end of this year is forecast to remain moderate. According to the indexes that are released on a quarterly basis by the ABS, consumer prices in Australia rose 1.0% in the quarter ending June 2016. This was down 0.3% from 1.3% in the previous quarter and slightly below market consensus, as well as being below the RBA’s target range of 2%-3%. As economic growth improves it would be expected that inflation rises back toward the target range. Our outlook considers the RBA current inflation and the RBA’s targeted inflation rate range of between 2%-3%. Unemployment Rates Risk: Low-Medium Outlook: Steady Unemployment rates around the world vary significantly. Data released by The World Bank, show the stark contrast in these rates. They have unemployment rates at 4.9% in the USA but 10.1% for the Eurozone. Australia's unemployment rate has been relatively stable until a sudden drop to 5.7% in July 2016. This is below the forecasts of 5.9% (ABS, 2016). Continued economic growth combined with both low inflation and interest rates should see unemployment rates remain steady in the near to medium term. EFN415 – Queensland University of Technology Page 5 Figure 5
  • 6. Australian Consumer Confidence Risk: Medium Outlook: Steady to positive The Westpac-Melbourne Institute Consumer Sentiment Index for Australia rose 2% to 101 in August of 2016, compared to a 3% drop in July. The public expectations of economic conditions over the next 12 months increased by 3.5%. This increase followed the Consumer Sentiment Index with a sharp decline a month earlier. Both point to an improving consumer sentiment. Further evidence of improving consumer confidence is show by the likelihood of consumers to undertake large purchases. The measure of whether this was a “Good Time to Buy Major Household Items” was up by 1.6%. For housing, 'The Time to Buy a House' index jumped to 10.1%. This was a strong performance after the index fell 1.8% in July. Despite these positive outlooks consumer’s view on the outlook over the next 5 years dipped marginally by 0.7% (University of Melbourne, 2016). We believe that this decline in longer term consumer sentiment could have been caused by negative news stories about the end of the mining boom. With continued growth and falling unemployment it would be expected that this outlook would improve. EFN415 – Queensland University of Technology Page 6
  • 7. INDUSTRY ANALYSIS Along with the growing economy, consumer spending has been forecast to increase over the next few quarters as the benefits of the last RBA rate cut are passed (partially) onto borrowers. The chance of a further rate drop and improving consumer confidence survey results suggests that consumer consumption will remain strong. Consumer trends drive performance in the industry sectors that RFG has their portfolio of brands. Of the consumer discretionary market, RFG operates in three main markets; Bread and Cake Retailing, Café and Coffee Shops and Fast Food Services. Industry RFG Market Share Market Size FY2016 Growth Forecast Growth Bread and Cake 21.50% $753m 1.80% 1.40% Coffee Shops 16.50% $2,400m 3.80% 3.70% Fast Food >1% $19,300m 3.90% 1.50% Figure 6 As shown in Figure 6, the highest rate of forecast growth in the coffee shop industry. RFG through the acquisition of Gloria Jeans are a significant player in this market. RFG have no stated plans to expand in the fast food industry which despite its size is forecasting significantly slower then previously. Porter’s Five Forces Analysis Outlook: Does not support long term growth above GDP rates. Threat of Existing Competitors Risk: High The RFG brands of Crust and Pizza Capers have faced significant competitor pressures. This has seen strong competitors in Domino’s and Pizza Hut battling for market share. Domino’s price, product differentiation and improvements in ordering have helped them surged in the market to comfortably take top spot of pizza chains, gaining 4.8% of the Fast Food Services Industry according to their annual report. RFG have stated they do not wish to compete on price, instead relying on product quality as the unique competitive advantage. EFN415 – Queensland University of Technology Page 7 Figure 7
  • 8. Industry reports indicate that the recent acquisition of Gloria Jeans increased RFG’s market share in the Coffee Shop industry to 16.5%, making RFG a clear industry leader in a market that is traditionally characterised by low levels of market share and discerning tastes among consumers. Gloria Jeans was acquired after facing significant competition from another global competitor in Starbucks who after closing underperforming stores, has sold its Australian business rights to the parent company of 7-Eleven. RFG have however improved on the traditional coffee shop distribution by acquiring Cafe2U (mobile coffee vans) and Coffee Nation, which is an operator of more than 1000 self-service coffee machines. There are a number of competitive moves in which a company is able to respond to competitors to gain an advantage. • Changes in prices – a company is able to change prices up or down in order to gain some sort term advantages over the market. RFG have demonstrated an ability to occupy the premium end of their market. This is evidenced by their lack of willingness to compete on price in the gourmet pizza market. By undertaking vertical acquisitions, RFG maybe able to provide buffers against rival price wars. A rival who discounts still has to purchase raw materials and will still have to meet the demand of the suppliers and their price. With the acquisition of Hudson’s RFG controls significant portions of their supply chain and may have the ability to reduce price beyond the scale of many other rivals. • Improve product differentiation – RFG has stated that they are increasing franchise independence to encourage product innovation. RFG have released a number of concept stores which it has begun to roll out to significantly improve the consumer experience. Whilst we recognise the potential to improve based on store fit out, the brands that RFG own are not known for their menu rotation. • Creatively using channels of distribution – As evidenced by the purchase of mobile coffee distributors, and the possibility of drive through coffee service, RFG shows innovation in their coffee business. Outside of this part of the business, RFG has largely remained a traditional retailer in the remaining business sectors in which it operates. • Exploiting relationships with suppliers - RFG have a stated goal of becoming vertically integrated which they believe will deliver greater control over product development, cost and quality which they believe will give them a competitive advantage EFN415 – Queensland University of Technology Page 8
  • 9. Threat of New Entrants Risk: High In the coffee shop industry, market research performed by IbisWorld shows competition is high and the trend is increasing. In addition, the industry is subject to external competition from other hospitality industry such as restaurants and convenience stores. The industry possess low barriers to entry due to the low start-up costs, and is also reflected in the high fragmentation in the market as whole. In terms of life cycle stage, the coffee industry is in a growth phase. This will increase the attractiveness of this industry to new competitors. This all points to the threat of new entrants being high. Retailing in bread and cakes shows a medium level of competition with an increasing trend. Fragmentation remains high and competition generally focuses on price and product range, with factors such as health benefits and dietary requirements gaining prominence. Product expansion amongst supermarkets and convenience stores poses a threat to RFG as well as the café and coffee shop industries expanding into cakes, pastries and sweetbreads. The life cycle of this industry is in a mature stage which will limit the attractiveness to new competitors. Overall the risks of other industries expanding product ranges into traditional products offered by this sector is high. In the fast food industry, the industry is moving towards saturation as it moves into the mature life cycle stage. This is making it harder for new competition to find suitable locations and build a significant sustainable market share. There has been an observable increase in premium food offerings within the industry and from supermarkets. This trend will increase competitors in the premium pizza market that RFG operates in. Threat of Substitute Products Risk: High RFG trades in industries that see new entrants as well as new ideas. As such there are threats of substitute products coming through constantly. We have seen a dynamic shift of the consumer to healthier options and niche brands. This shifts the emphasis to companies like RFG to ensure they are keeping up with consumer demand. Concern exists as to RFG’s ability to show significant product nimbleness to deal with this risk. As mentioned previously RFG has begun to allow individual franchises to experiment with product differentiation which should help with the added benefit of meeting the demand of geographic locations without the need for central oversight. EFN415 – Queensland University of Technology Page 9
  • 10. Threat of Bargaining Power of Buyers Risk: Low RFG is primarily a direct to consumer retailer and make the majority of their revenues from their franchisees. The end consumer in the market place has plenty of choice and as such is responsive to competitive forces in price, quality and product differentiation. RFG has chosen to occupy a premium segment of their chosen industry segments which has allowed them to receive higher margins but this will be impacted as competitors increase the quality of competing offerings or lower their prices. COMPANY ANALYSIS Company Profile RFG is the owner, developer and manager of the Donut King, Brumby’s Bakery, Michel’s Patisserie, bb’s Café, Esquires, Gloria Jean’s Coffees, It’s A Grind, The Coffee Guy, Café2U, Pizza Capers Gourmet Kitchen and Crust Gourmet Pizza Bar franchise systems. Its major franchises are household Australian names. In addition, the company is a significant wholesale coffee roaster supplying existing brand systems and third party accounts under the Evolution Coffee Roasters Group, Roasting Australia and Di Bella Coffee brands. The Group’s main operations are in within the Australian market (69% of the network), however they do have a market presence in Europe (8%), America (4%), Asia (8%) and parts of the Middle East (5%) EFN415 – Queensland University of Technology Page 10 Figure 8
  • 11. Five of the major franchises that RFG owns and operates are; Besides doughnuts, Donut King also serves a variety of other food items and beverages such as coffee and teas, soft drinks, milkshakes, soft serve ice creams, frozen carbonated beverages, and hot dogs Brumby's bakeries sell a range of sweet and savoury food. Various flavours of pies and sausage rolls, loaves of bread, cheese and bacon buns and rolls, cream buns and rolls, and small cakes and pastries are the types of products sold. Michel's Patisserie is a chain of bakery-style food outlets selling cakes, pies, savouries, and espresso coffee In addition to pizza, Pizza Capers also serves a wide variety of other food items, as well as beverages and desserts such as: chicken wings, pasta, calzones, garlic bread, salads, soft drinks, ice creams and gelato Gloria Jean's Coffees is a franchised specialty coffeehouse company that has opened more than 1,000 coffee houses across 39 markets worldwide, including over 460 in Australia. In 2014 Gloria Jeans was purchased by the Retail Food Group for $163.5 million, RFG’s largest acquisition to date EFN415 – Queensland University of Technology Page 11
  • 12. Key Executives Retail Food Group is run by a strong group of executives, all of which have proven experience in the food industry, and critically in the franchise systems. Name Position Colin Archer Independent Chairman Anthony (Tony) Alford Non-Executive Chairman Andre Nell Managing Director Gary Alford CEO Peter McGettigan CFO Mike Gilbert Chief Franchise Officer Damian Tarry Director of Human Resources COMPANY STRATEGY Competitive Strategy RFG's upper hand lies in its franchisee model, existing store footprint and the quality of its products. Moreover, because of the large business establishment, it is additionally feasible for the company to adventure economies of scale. Product marketing research and innovation, along with IT support are done at corporate level, which gives a relief to the franchise owners. These economies of scale would not be achievable at smaller levels of operations, which many cafes and bakeries are. As premium quality adequately shields RFG from value rivalry, generally stable level of working costs permits the group to increase a higher operating edge than its competitors. Recent Highlights Without a doubt, the highlight for Retail Food Group in the past few years has been its acquisition of the Gloria Jeans Coffee brand. The 2015 annual report stated that the purchase of Gloria Jean's increased RFG’s store count by 358 domestically and 420 around the world, making Retail Food Group the "clear leader in retail food franchises specialising in coffee". As part of this acquisition, the company elected to write down the value of sub- scale and underperforming brands in 2015 such as BB's Cafe and Esquires Coffee by $18.5 million, denting bottom-line profits. BB's Cafe and Esquires stores were converted to Gloria Jean's stores or Michelle's Business Strategy EFN415 – Queensland University of Technology Page 12
  • 13. The group is proceeding to divest non-core business by the transition from a wholesale bakery supply to Michel’s Patisserie franchisees to a more traditional royalty-based system. While this reduced significant amounts of revenue generated from wholesale (over $20 million per annum), operating costs declined at higher rate and led to higher NPAT margin. RFG has continued on its aggressive acquisition strategy and has recently acquired Melbourne-based food business Hudson Pacific. The group explicitly expresses its intention to acquire further brands to expand its franchise system and expand them into the global market. This global expansion will allow them to tap into faster growth world markets. Delivering on this strategy, RFG announced that during 2016, 57% of all new outlets opened were outside of Australia. SWOT Analysis Strengths By employing a franchise system, RFG has low capital investment and enjoys a healthy percentage of revenue, which is generated by royalties from thousands of individual franchise owners. Because RFG produces and supplies its own brand of coffee to all stores, it ensures that a major cash outlay is kept within the business, and not put into the hands of rivals. RFG is not afraid of altering the markets perception of the brand, it is willing to take short term setbacks to allow the long term future of the brand to flourish, as shown by the rebranding of stores in 2015. The group likes to hold a substantial amount of cash reserves in order to allow the acquisition of any brands that threaten to remove market share from RFG. At the conclusion of FY2016, the group held $17.4m in cash reserves. Weaknesses The RFG business owns many brands, however the popularity of these brands is a shortcoming. Compared to brands such as Starbucks, Domino’s Pizza or Subway, there is a large difference in brand awareness of those firms compared to the brands that RFG holds. Whilst going forward, the group aims to be more cutting edge and develop market leading franchises, in the past the lack of marketing initiatives and inability to acquire these competitors at an early stage of growth may prove a hard to overcome obstacle. EFN415 – Queensland University of Technology Page 13
  • 14. Opportunities With the acquisition of the Gloria Jeans Brand, RFG gained immediate international exposure that it previously lacked. The past financial year has seen the commissioning of three international coffee roasting facilities and distribution hubs to complement existing facilities in Australia, New Zealand and North America. The group’s Los Angeles roasting facility has been re-badged as Di Bella Coffee. Management has stated that the North American market is a priority, and as such the business has appointed a sales and distribution team. This team will develop coffee blends more suitable to the American taste. The ability for the firm to penetrate into these international markets will be a key factor in medium to long term growth for RFG. Just less than 17% of the group’s EBITDA was generated internationally during the latest half-year. The firm’s executives expect that measure to grow over the coming years and is demonstrated by 57% of all new openings being located outside of Australia. Threats The growth of mobile technology and the ability for “on the go” ordering is something that RFG will need to look to implement. In Australia, Domino’s Pizza has gained a stranglehold on the Pizza industry due to its investment in ordering technology. If RFG ignore this area of development, there is a chance the brand becomes stagnant and competitors gain an advantage. As shown by the Porter Five Factor analysis, RFG operates in industries that produces high risk in four out of five factors. EFN415 – Queensland University of Technology Page 14
  • 15. VALUATION The valuation method used to give an intrinsic value of the company is a discounted cash flow (DCF) model. While the most recent annual report is unavailable at the time of writing, figures were released in a full year results presentation during which the FY2016 financial statements were released. At this time, the acquisition of Hudson Pacific Corporation was announced. These figures have been used as part of our valuation. Capital Structure As stated in the 2015 annual report, the target gearing ratio for the firm is between 40-60% as the proportion of net debt to equity. The firm has a stated goal of growth through acquisition with the purchase of Hudson Pacific expected to raise the D/E ratio to 55%. Whilst this is not used in our valuation, we believe this is an important item of note for investors. Effective Tax Rate The average effective tax rate paid by RFG over the previous three years was 26.85%. As the nominal tax rate on enterprises in Australia is set at 30% we have used this for our model. This rate is currently a topic of political discussion and we have factored this into our model by lowering the tax rate to 28.50% for FY2019. Cost of Equity Cost of equity for RFG was calculated using the dividend growth model as opposed to the CAPM due to the widely varying expected rates of returns on the ASX. The firm has announced its upcoming dividend. This resulted in a cost of equity of 16.68%. We have used this figure in our WACC calculation. Cost of Debt The overwhelming majority of the firm’s debt is from bank loans, and according to the latest annual report, the weighted average effective interest rate is 4.3%. This will be used as the cost of debt. WACC Calculation Using the figures outlined above for cost of equity, cost of debt and effective tax rate as well as using the levels of total debt and equity as outlined in the latest annual report of $276.3m (total liabilities) and $680m (total assets), the WACC figure for RFG is 12.81% EFN415 – Queensland University of Technology Page 15
  • 16. Net Borrowings We have forecast net borrowings to increase by $50m reflecting the additional borrows that are needed to fund the Hudson Pacific acquisition. This can be seen in the balance sheet under total debt. We made an adjustment from the total $55m to account for timing differences. FY2018 and FY2019 both forecast an additional $5m in borrowings to account for the timing lapse and other expenses, such as plant or other capital requirements that may arise from the Hudson acquisition. Interest Expense Interest expense has trended upwards as a result of the increase in borrowings (due to acquisitions). For FY2017 we are predicting interest expense to rise in line with the proposed additional borrowings. Interest futures as predicted by the ASX are showing a high probability that the official cash rate will be lowered in the coming years, but are not pricing in a full cut. If a rate cut occurs, it can be expected to be passed on to some extent. We have tested the model with a rate cut of 0.25%, and the impact on share valuation is minimal. As such we are not predicting any changes in cost of debt or market risk premium. The interest expenses will rise in line with changes in net borrowings. Plowback Ratio Plowback ratio has been on average 76.55% over the last five years, and for our forecast we have simplified this to 75%. Changes in Working Capital Assets Based on the firm’s plowback ratio of 75%, we are expecting assets to rise in line with this reinvestment policy. Cash Cash on hand increased following the Gloria Jeans acquisition, and as such we have forecasted a similar increase to occur in FY2017 post Hudson acquisition. We do forecast a year on year increase however due to the nature of the Hudson acquisition and the business model going forward. EFN415 – Queensland University of Technology Page 16
  • 17. Current Liabilities Similarly, for liabilities post Gloria Jeans acquisition we saw an increase in liabilities. This reflects increase in trade, other payables and provisions. In line with this we predict a 12% rise in liabilities for FY2017. In addition to this the firm has taken on additional debt with the purchase of Hudson Pacific which has also been accounted for. In FY2018 and FY2019 total liabilities will rise in line with net borrowings and our forecasted increase in capital requirements. Operating Activities Revenue We forecasted revenue predictions based on the values given by RFG during the Hudson acquisition presentation. We have reason to believe these figures as RFG have a demonstrated the ability to integrate and deliver on forecasted acquisition revenue. In FY2018 we have forecasted a conservative 10% increase in revenue to allow for the impact of a full year revenue receipt from the Hudson acquisition. Included in this, we have allowed for growth as predicted in industry trends and that has been observed within the existing business. FY2019 revenue growth slows down reflecting the full year integration of Hudson, as well the realisation of the stated acquisition benefits. These assumptions are higher than the forecasted economic growth and inflation rates but are in line with forecasted industry growth rates. Operating Expenses As RFG takes control of Hudson, we forecasted a 68% increase in operating expenses for FY2017. This increase is due to the large amount of additional capital now owned by RFG and the hefty initial outlays that can be expected. During the Hudson presentation RFG advised a combined targeted NPAT for FY2017. We have used this figure to guide our prediction for the operating expense of the firm during FY2017. The following year, FY2018, we have forecasted an increase of 12%. This figure is again due to full year impacts, integration and restructuring costs. FY2019 sees an expense growth of 2.5%. We forecasted this figure based on expected costs relating to restructuring, positive impacts from vertical integrating supply lines, negated by rising costs as per our inflation outlook. EFN415 – Queensland University of Technology Page 17
  • 18. Depreciation and Amortization We have modelled the rate of depreciation for FY2017 to increase due to the Hudson acquisition. As we have mentioned this acquisition will bring assets of plant, property and equipment which we expect to have a large depreciation expense. We’ve used the increase following the acquisition of Gloria Jeans as a baseline for this assumption. We assume that once RFG are able to rework production scales, the higher rate will reduce to a more constant 30% year on year increase. We believe this reflects the more capital intensive structure of Hudson Pacific. Terminal Value of the Firm To arrive at the terminal value of the firm we estimated an internal growth rate based on the plowback assumption of 75%. The ROE average of the firm has been 22%, but due to the managements long term growth forecast of 2.5%, we forecasted a ROE of 15.2% going forward into the future. These assumptions give the perpetuity growth rate of 3.80%. This is above our long term growth forecast GDP growth, and the company outlook from the Porter Five Factor does not support this. We used the assumption of 3.60%, reflecting the deployment of the brands into the global markets producing growth at the higher end our outlook, but within estimates for world growth. Buy, Sell or Hold Recommendation Using the discounted cash flow model we estimate the value of the company at approximately $6.50. As at close of market 12 September the price was $6.55 or 1.8% higher than our valuation. We have calculated our range based on the potential change in terminal growth rates, using an Australian growth rate of 3.3% and a world growth rate of 3.8% as ranges. This gives an indicative price range of $6.30 - $6.60. As closing price is within this range, we recommend to hold this share as it is currently priced adequately for its estimated valuation. EFN415 – Queensland University of Technology Page 18
  • 19. Appendix Appendix 1 – Valuation Model ($M) CAGR 2014 2015 2016 (14-16) 2017 2018 2019 Proposed Borrowings ($M) 50,000 276,300 Revenue 128,000 210,400 274,600 28.97% 411,900 453,090 475,745 Risk Free 1.86% 680,000 % growth 64.38% 30.51% -31.15% 10.00% 5.00% Cost of Debt 4.30% Marginal Tax Rate 30.00% Operating Expense 68,900 151,900 170,900 35.37% 287,112 321,565 329,605 Plowback ratio 75.00% % growth 120.46% 12.51% -67.78% 12.00% 2.50% Dep./Amort. 1,568- 3,707- 6,584- 61.33% 10,622- 13,809- 17,951- % sales -1.23% -1.76% -2.40% 25.09% -2.58% -3.05% -3.77% EBITDA 59,100 58,500 103,700 20.61% 124,788 131,525 146,140 % margin 46.17% 27.80% 37.76% -6.48% 30.30% 29.03% 30.72% Items CAGR 2017 2018 2019 Avg YOY Growth Revenue 28.97% 50.00% 10.00% 5.00% 21.67% Add Back Dep./Amort. 1,568- 3,707- 6,584- 10,622- 13,809- 17,951- Operating Expense 35.37% 68.00% 12.00% 2.50% 27.50% Dep./Amort. 61.33% 61.33% 30.00% 30.00% 40.44% EBIT 57,532 54,793 97,116 19.07% 114,166 117,716 128,189 % margin 44.95% 26.04% 35.37% -7.68% 27.72% 25.98% 26.94% Interest Expense 4,728- 7,076- 9,195- 24.82% 11,345- 11,560- 11,775- Interest Expense 24.82% 0.00% 0.00% 0.00% 0.00% % growth Tax -26.85% 30.00% 30.00% 28.50% 29.50% Net Income 24.26% 24.26% 24.26% 24.26% 24.26% EBT 52,804 47,717 87,921 18.52% 102,821 106,156 116,414 41.25% 22.68% 32.02% Items CAGR 2017 2018 2019 Avg YOY Growth Tax 15,890- 14,165- 26,287- 18.27% 30,846- 31,847- 33,178- Current Assets 20.82% 7.00% 7.00% 7.00% 7.00% Calculated Tax Rate -27.62% -25.85% -27.07% -26.85% Cash and Cash Equi. 14.62% 14.62% 1.50% 1.50% 5.87% Current Liabilities 37.54% 12.00% 2.50% 2.50% 5.67% Total Debt 50,000 5,000 5,000 Net Income 36,914 40,628 70,829 24.26% 71,975 85,869 95,011 % margin 28.84% 19.31% 25.79% -3.65% 17.47% 18.95% 19.97% % growth -33.04% 33.58% 0.81% -32.25% 8.46% 5.38% Change in NWC 38,468- 46,670 86,982 11,372 12,231 Free Cash Flow 5,867 124,083 180,924 111,050 125,193 WACC 12.810% Discount Period 1.0 2.0 3.0 Discount Factor 0.8864 0.7858 0.6966 PV of Free Cash Flow 160,379 87,262 87,204 ($M) CAGR 2014 2015 2016 (14-16) 2017 2018 2019 Current Assets 50,659 90,182 89,346 20.82% 182,270 195,029 208,681 Cash and Cash Equi. (Included) 11,559 17,149 17,406 14.62% 19,951 20,250 20,554 Liabilities Current Liabilities 19,034 97,025 49,519 37.54% 55,461 56,848 58,269 Net Borrowings 68,949 156,169 206,607 50,000 5,000 5,000 Net Working Capital 31,625 6,843- 39,827 7.99% 126,809 138,181 150,412 Terminal Value Terminal Year Free Cash Flow 125,193 Perpetuity Growth Rate 3.60% Terminal Year EBITDA 146,140 Terminal Value 1,408,249 Implied Exit Multiple 10.23 Discount Period 4 Discount Factor 0.6558 Present Value of Terminal Value 923,555 % of Enterprise Value 1 Enterprise value Present value of Free Cash Flow 334,845 Terminal Value 1,408,249 Discount Factor 0.6558 Present Value of Terminal Value 1,258,400 % of Enterprise Value 100.00% Enterprise value 1,258,400 Less: Total debt 206,772- Plus: Cash and Cash Equi. 17,406 Net Debt 189,366 Implied Equity Value 1,069,034 Number of shares on issue (M) 164968 Implied share price 6.48$ Balance Sheet Balance Sheet Historical Forecast Equity ($M) Growth Model Cash Flow Historical Forecast Inputs (For 2017) Inputs (At EOFY 16) Debt ($M) EFN415 – Queensland University of Technology Page 19
  • 20. References ABS. (2016). Retrieved from ABS: http://www.abs.gov.au/ ASX. (2016). Retrieved from ASX: http://www.asx.com.au/data/trt/ib_expectation_curve_graph.pdf Bank, W. (2016). Retrieved from World Bank: http://data.worldbank.org/indicator/SL.UEM.TOTL.NE.ZS Dominos. (2016). Annual Report. Dominos. Retrieved from http://dominosinvestors.com.au/reports- presentations IBISWorld. (2016). Australian Industry Report. IBISWorld. IMF. (2016). World Economic Outlook Update, International Monetary Fund, January . IMF. Melbourne, U. o. (2016, July). Retrieved from University of Melbourne: https://melbourneinstitute.com/miaesr/publications/indicators/csi.html OECD. (2013). OECD Economic Outlook volume 2013/1, Growth Prospects and Fiscal Requirements over the long term. OECD. Retrieved from OECD: https://www.oecd.org/eco/growth/Growth-prospects-and-fiscal-requirements-over-the- long-term.pdf Reserve Bank of Australia. (2016). Retrieved from Reserve Bank of Australia: http://www.rba.gov.au/statistics/ Retail Food Group . (2015). Annual Report 2015. RFG. Retail Food Group. (2012). Annual Report 2012. RFG. Retail Food Group. (2013). Annual Report 2013. RFG. Retail Food Group. (2014). Annual Report 2014. RFG. Retail Food Group. (2016). FY2016 Presentation. Retrieved from RFG: https://www.rfg.com.au/ EFN415 – Queensland University of Technology Page 20