1. Advance Biometry 1st Assignment For Agronomy (MSC) Program A.Y 2021/2
1
Prepared By Abera Milkessa Eticha
Assignment 1
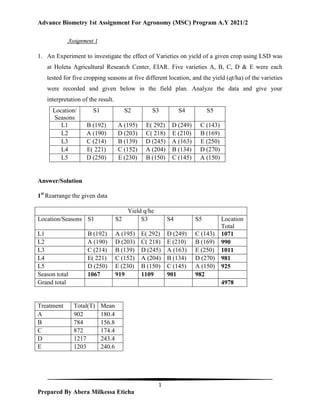
1. An Experiment to investigate the effect of Varieties on yield of a given crop using LSD was
at Holeta Agricultural Research Center, EIAR. Five varieties A, B, C, D & E were each
tested for five cropping seasons at five different location, and the yield (qt/ha) of the varieties
were recorded and given below in the field plan. Analyze the data and give your
interpretation of the result.
Location/
Seasons
S1 S2 S3 S4 S5
L1 B (192) A (195) E( 292) D (249) C (143)
L2 A (190) D (203) C( 218) E (210) B (169)
L3 C (214) B (139) D (245) A (163) E (250)
L4 E( 221) C (152) A (204) B (134) D (270)
L5 D (250) E (230) B (150) C (145) A (150)
Answer/Solution
1st
Rearrange the given data
Yield q/he
Location/Seasons S1 S2 S3 S4 S5 Location
Total
L1 B (192) A (195) E( 292) D (249) C (143) 1071
L2 A (190) D (203) C( 218) E (210) B (169) 990
L3 C (214) B (139) D (245) A (163) E (250) 1011
L4 E( 221) C (152) A (204) B (134) D (270) 981
L5 D (250) E (230) B (150) C (145) A (150) 925
Season total 1067 919 1109 901 982
Grand total 4978
Treatment Total(T) Mean
A 902 180.4
B 784 156.8
C 872 174.4
D 1217 243.4
E 1203 240.6
2. Advance Biometry 1st Assignment For Agronomy (MSC) Program A.Y 2021/2
2
Prepared By Abera Milkessa Eticha
Step 1. Compute the C.F and Various Sum of square.
= 991219.36
=1040150 - 991219.36
= 48930.64
–
– 991219.36
– 991219.36
=993449.6-991219.36
=2230.24
– C.F.
– 991219.36
– 991219.36
=1023388.6-991219.36
3. Advance Biometry 1st Assignment For Agronomy (MSC) Program A.Y 2021/2
3
Prepared By Abera Milkessa Eticha
=32168.64
– C.F.
– 991219.36
– 991219.36
=997811.2-991219.36
=6591.84
Error SS = Total SS-Location SS – Season SS- Treatment SS
= 48930.64 - 2230.2399 - 6591.84 - 32168.64
Error SS = 7939.92
4. Advance Biometry 1st Assignment For Agronomy (MSC) Program A.Y 2021/2
4
Prepared By Abera Milkessa Eticha
Summarized ANOVA structure for LSD
Source D.F SS MS F-
calculated
Table F
5% 1%
Location t-1=4 2230.2399 557.56 0.84 3.26 5.41
Season t-1=4 6591.84 1647.87 2.49 3.26 5.41
Treat t-1=4 32168.64 8042.16 12.15** 3.26 5.41
Error (t-1) (t-2)=
12
7939.92 661.66
Total t2
-1 =24 48930.64
5. Advance Biometry 1st Assignment For Agronomy (MSC) Program A.Y 2021/2
5
Prepared By Abera Milkessa Eticha
The analysis of variance indicates that significant differences among the treatment both at 5%
and1% but there is no significant differences among Location and Season.
i.e. Difference of Location and Season are no effect on our treatment
6. Advance Biometry 1st Assignment For Agronomy (MSC) Program A.Y 2021/2
6
Prepared By Abera Milkessa Eticha
2. A rice breeder would like to evaluate 16 progenies generated by international rice research
institute (IRRI) he planned to evaluate the progenies in augmented design (because the seed
for each progeny is not enough for replicated trials, there is a limited resource for the
research or observation/preliminary information is enough to narrow down the number of
progenies for further test). There are 4 checks to be used as a reference to evaluate the new
progenies. The 20 treatments (16 new progenies and +4 checks) were put in four blocks each
containing 8 treatments (4 new + 4 checks) as show in the figure.
P1
120
A
83
P2
100
B
77
P3
90
C
70
P4
85
D
65
Total
690
P5
88
B
76
P6
130
C
71
P7
105
A
84
P8
110
D
64
Total
782
P9
102
D
63
P10
140
A
86
P11
135
B
78
P12
138
C
69
Total
811
P13
84
A
82
P14
90
D
63
P15
95
C
68
P16
103
B
75
Total
660
GT= 2889
Figure Layout of Augmented design for progeny evaluation.
Analyze the data and give your interpretation of the result
Steps of Analysis of Variance
Preliminary steps
1. Calculate block total for each block.
b1= (120 + 83 +100 +77+90+70+85+ 65) = 690
b2 = (88+76+130+71+105+84+110+64) = 728
b3 = (102+63+140+86+135+78+138+69) =811
b4 = (84+82+90+63+95+68+103+75) =660
2. Calculate total of progenies/test cultures in a particular block.
P block1 = (120+100+90+85) =395, P block2 = (88+130+105+110) = 433
P block3 = (120+140+135+138) =515, P block4 = (84+90+95+103) =372
7. Advance Biometry 1st Assignment For Agronomy (MSC) Program A.Y 2021/2
7
Prepared By Abera Milkessa Eticha
3. Construct check by block two-way table and calculate check total, check mean, check effect,
sum of check totals & total of check means.
Check/block b1 b2 b3 b4 Check
total
Check
mean
Check effect (check
mean-adjusted grand
mean)
Check total
x
Check effect
A 83 84 86 82 335 83.75 -16.67 -5584.45
B 77 76 78 75 306 76.50 -23.92 -7319.52
C 70 81 69 68 278 69.50 -30.92 -8595.76
D 65 64 63 63 255 63.75 -36.67 -9350.85
Sum 1174 -30850.58
Total of check means 293.5
Blocks ni Block
total(Bj)
Total of test
culture in a
block(ti)
No. of test
culture in a
block(Ti)
Block
effect(Be)
Ti*Be Block effect
*Block total
B1 8 690 395 4 0.375 1.5 258.75
B2 8 728 433 4 0.375 1.5 273.00
B3 8 811 515 4 0.625 2.5 506.87
B4 8 660 372 4 -1.375 -5.5 -907.5
Sum 32 2889 0 0 131.12
Estimation of block effect as
]
Where ni is number of entries (test culture + checks) in each block = 4 + 4 = 8, ∑ni = N =32.
Calculate adjusted grand mean as:
[ ]
]
Grand total = ∑Bi(sum of block total) or Sum of all observations 2889.0
8. Advance Biometry 1st Assignment For Agronomy (MSC) Program A.Y 2021/2
8
Prepared By Abera Milkessa Eticha
Adjusted grand mean = [ ]
Estimate check effect (Ci):
Ci = Check mean - adjusted grand mean
C1 = 83.75-100.42 = -16.67;
C2= 76.5 - 100.42 = -23.92
C3= 69.50-100.42 = -30.92;
C4= 63.75-100.42 = -36.67
There are as many checks effects as the number of checks (4 in this case)
Adjusted progeny value per i th progeny (Pi) as:
Observed (unadjusted) progeny value - effect of block in which the ith progeny is occurring
P1 (adjusted) = P1- (block effect) = 120 - (+ 0.375) = 119.62, etc.
Progeny/test
culture no. (Pi)
Observed
Progeny
value (Po)
Block
Effect
(bi)
Adjusted
Progeny
value
(Po- bi)
Progeny effect (Adjusted
progeny value-Adjusted
grand mean
Observed
progeny value *
progeny effect
1 120 0.375 119.625 19.205 2304.6
2 100 0.375 99.625 -0.795 -79.5
3 90 0.375 89.625 -10.795 -971.6
4 85 0.375 84.625 -15.795 -1343
5 88 0.375 87.625 -12.795 -1126
6 130 0.375 129.625 29.205 3796.7
7 105 0.375 104.625 4.205 441.53
8 110 0.375 109.625 9.205 1012.6
9 102 0.625 101.375 0.955 97.41
10 140 0.625 139.375 38.955 5453.7
11 135 0.625 134.375 33.955 4583.9
12 138 0.625 137.375 36.955 5099.8
13 84 1.375 85.375 -15.045 -1264
14 90 1.375 91.375 -9.045 -814.1
15 95 1.375 96.375 -4.045 -384.3
16 103 1.375 104.375 3.955 407.37
Sum 1715 17215.11
Estimate progeny effect as: Adjusted progeny value - adjusted grand mean;
For example, progeny effect for progeny 1 = 119.62-100.42 = 19.20; etc.
Analysis of variance
9. Advance Biometry 1st Assignment For Agronomy (MSC) Program A.Y 2021/2
9
Prepared By Abera Milkessa Eticha
1.
2. Total SS =∑Y2
-C.F. Sum of the squares of all observations –C.F. =
(120)2
+(83)2
+…+(75)2
- = 15798.47
3. Crude block SS = ∑ = + + + =262425.62
4. True block SS: Crude block SS-C.F. = 262425.62- = 1603.09
5. Adjusted SS due to entries(C+P) =( adjusted grand mean*Observed grand total) +
[(∑Block effect * Corresponding block total) +(∑check effect* corresponding check
total) +(∑progeny effect * Corresponding observed progeny value) - Crude block SS)]
(100.42*2889)+ [(131.12) + (-30850.58) +17215.11-262425.62) = 14183.41
6. Unadjusted SS due to entries
b= No. of blocks (4)
= 87042.5 + 189557-260822.53 15776.97
7. Partition SS due to entries (C + P) to components
SS due to checks =
= 87042.5 – 86142.25 900.25
b = No. of blocks; c = No. of checks (4)
SS due to test cultures/progenies
+…+
= 169557-183826.56 5730.44
P = No. of progenies/test cultures = 16
SS due to checks * test cultures/progenies = Unadjusted SS due to entries (C + P) -SS due to
checks - SS due to test culture/progenies
= 15776.97 – 900.25 – 5730.44 = 9146.28
SS due to error: Total SS – True blocks SS - SS due to entries (adjusted)
10. Advance Biometry 1st Assignment For Agronomy (MSC) Program A.Y 2021/2
10
Prepared By Abera Milkessa Eticha
= 15798.47 – 1603.09 – 14183.41 = 11.97
Summarize the results of analysis in ANOVA table
Source D.F SS MS F-Cal. F- Table
5% 1%
Block (b-1) 3 1603.09 534.36
Adjusted entries(C+P-1) 19 14184.3 746.54
unadjusted entries(C+P-1) 19 15776.97 830.37
Checks(C-1) 3 900.25 300.08 225.62** 3.86 6.99
Test Culture(P-1) 15 5730.44 382.03 287.24** 3.01 4.96
Test Culture * Checks 1 9146.28 9146.28 6876.9** 5.12 10.56
Error (b-1)(C-1) 9 11.97 1.33
Total(N-1) 31 15798.47
Mean Comparison
To compare any two check means at 5% level of significance
LSD5% = t0.025 (9)*sd = 2.262*√ = 2.262*√ =1.845 days
2.262 is come from Percentage Points of the “table distribution
0.025 As nominator & d.f. error (9) as dominator
To compare two progenies/test materials occurring in the same block at 5% level of significance
t0.025 (9)*sd = 2.262*√ = LSD5% = 2.262*√ = 3.69days
To compare two test cultures (progenies) occurring at different block at 5% level of significance
LSD5% = t0.025 (9)*√ ; c = No. of checks
= 2.262*√ = 4.12days
To compare a progeny/test culture with any check at 5% level of significance
LSD5% = t0.025 (9)*√ ; b = No. of blocks; C= no. of checks
= 2.262*√ 3.26 days
11. Advance Biometry 1st Assignment For Agronomy (MSC) Program A.Y 2021/2
11
Prepared By Abera Milkessa Eticha
Interpretation
There was a significant difference among progenies, checks and progenies vs. checks. Among
the progenies, P10 had the highest yield (140 g/plot) followed by P12 and P11 are yield (138 &
135g/plot) while the least was obtained from P13. Among the checks, the highest and lowest
yield was obtained from A& D (83.75 & 63.75) g/plot respectively. When progenies and checks
were comparing, the highest yield was obtained from P10. However, progeny 4 and check A were
not statistically different. Therefore, all progenies except P4 can be promote for further test based
on the yield per plot. Therefore, progenies 4 (P4) can be considering if it has special incident.