1. Genetic Diversity and History of Iraqi Indigenous
Chicken Populations
Ahmed Al-Jumaili¹*, Sahar A. Al-Bayatti², Abdulamir A. Essa², Raman A. Lawal¹ and Olivier Hanotte¹
¹ School of Life Sciences, The University of Nottingham, University Park, Nottingham. NG7 2RD, United Kingdom
² Ministry of Agriculture, Directorate of Animal Resources, Genetic Resources Division, Iraq
*mbxao2@Nottingham.ac.uk ahmedaljumiliy@gmail.com
Introduction
Local Iraqi chickens are adapted to the harsh local
environmental conditions of the country. These conditions
include high temperature during the summer season (up to
50 c°) and low temperature in winter (lower than 0 c°)¹.
Moreover, they are resilient to the poor nutritional value of
the farming diet and disease challenges. Consequently, they
are considered as a good source of animal protein in rural
area. The aim of our work is to unravel the genetic diversity
and adaptation of local chicken populations from Iraq. We
present here our mitochondrial DNA results.
Methods
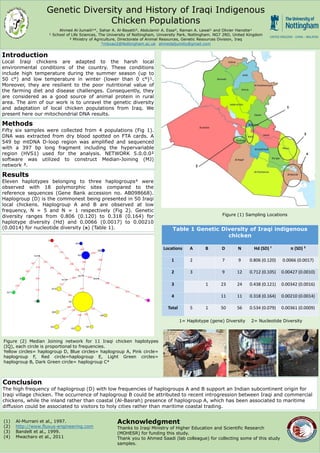
Fifty six samples were collected from 4 populations (Fig 1).
DNA was extracted from dry blood spotted on FTA cards. A
549 bp mtDNA D-loop region was amplified and sequenced
with a 397 bp long fragment including the hypervariable
region (HVS1) used for the analysis. NETWORK 5.0.0.0²
software was utilized to construct Median-Joining (MJ)
network ³.
Results
Eleven haplotypes belonging to three haplogroups⁴ were
observed with 18 polymorphic sites compared to the
reference sequences (Gene Bank accession no. AB098668).
Haplogroup (D) is the commonest being presented in 50 Iraqi
local chickens. Haplogroup A and B are observed at low
frequency, N = 5 and N = 1 respectively (Fig 2). Genetic
diversity ranges from 0.806 (0.120) to 0.318 (0.164) for
haplotype diversity (Hd) and 0.0066 (0.0017) to 0.00210
(0.0014) for nucleotide diversity (π) (Table 1). Table 1 Genetic Diversity of Iraqi indigenous
chicken
Locations A B D N Hd (SD) ¹ π (SD) ²
1 2 7 9 0.806 (0.120) 0.0066 (0.0017)
2 3 9 12 0.712 (0.105) 0.00427 (0.0010)
3 1 23 24 0.438 (0.121) 0.00342 (0.0016)
4 11 11 0.318 (0.164) 0.00210 (0.0014)
Total 5 1 50 56 0.534 (0.079) 0.00361 (0.0009)
Figure (1) Sampling Locations
Figure (2) Median Joining network for 11 Iraqi chicken haplotypes
(IQ), each circle is proportional to frequencies.
Yellow circles= haplogroup D, Blue circles= haplogroup A, Pink circle=
haplogroup F, Red circle=haplogroup E, Light Green circles=
haplogroup B, Dark Green circle= haplogroup C⁴
1= Haplotype (gene) Diversity 2= Nucleotide Diversity
Conclusion
The high frequency of haplogroup (D) with low frequencies of haplogroups A and B support an Indian subcontinent origin for
Iraqi village chicken. The occurrence of haplogroup B could be attributed to recent introgression between Iraqi and commercial
chickens, while the inland rather than coastal (Al-Basrah) presence of haplogroup A, which has been associated to maritime
diffusion could be associated to visitors to holy cities rather than maritime coastal trading.
(1) Al-Murrani et al., 1997.
(2) http://www.fluxus-engineering.com
(3) Bandelt et al., 1999.
(4) Mwacharo et al., 2011
Acknowledgment
Thanks to Iraqi Ministry of Higher Education and Scientific Research
(MOHESR) for funding this study.
Thank you to Ahmed Saadi (lab colleague) for collecting some of this study
samples.