September 1 - 0853 - Jane Frankenberger
•Download as PPTX, PDF•
0 likes•19 views

Controlled drainage significantly increased corn yields by 2.3% on average over 9 years compared to free drainage. The greatest impact was in dry years, with a 5.9% yield increase. Analysis of soil type and elevation found that controlled drainage benefits extended to higher elevations than expected and provided the most benefit to very poorly drained soils. This detailed study demonstrated methods for quantifying spatial and temporal variability in controlled drainage impacts.

Recommended
Recommended
More Related Content
Similar to September 1 - 0853 - Jane Frankenberger
Similar to September 1 - 0853 - Jane Frankenberger (20)
More from Soil and Water Conservation Society
More from Soil and Water Conservation Society (20)
Recently uploaded
Recently uploaded (20)
September 1 - 0853 - Jane Frankenberger
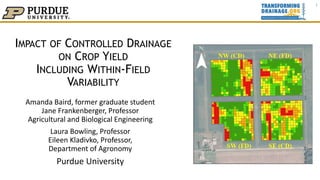
- 1. IMPACT OF CONTROLLED DRAINAGE ON CROP YIELD INCLUDING WITHIN-FIELD VARIABILITY Amanda Baird, former graduate student Jane Frankenberger, Professor Agricultural and Biological Engineering Laura Bowling, Professor Eileen Kladivko, Professor, Department of Agronomy Purdue University 1
- 2. Controlled Drainage Yield Impacts: Mixed Findings in Published Studies 2 Yield decrease: Helmers et al. 2012; No significant effect: Schott et al. 2017 No significant effect: Cooke & Verma, 2012 Corn yield increase: Delbecq et al., 2012 Yield increase: Poole et al., 2013 Yield increase: Ghane et al., 2012 Photo: Nations Online Project No significant effect: Tan et al., 1998; Drury et al., 2009 Corn Yield decrease (1 yr only): Smith & Kelllman, 2010 Yield increase: Wesstrom & Messing, 2007 Yield increase: Sunohara et al., 2014; Crabbe et al., 2012 No significant effect for corn; Yield increase for soybeans: Jaynes et al., 2012 No significant effect: Fausey, 2005
- 3. Controlled Drainage Yield Impacts: Unpublished Studies 3 Photo: Nations Online Project Yield data from 13 sites (55 site years) recently analyzed together (Youssef, Strock, Bagheria, Reinhart, Abendroth, Chighladze, Ghane, Shedekar, Fausey, Frankenberger, Helmers, Jaynes, Kladivko, Negm, Nelson, Pease, “Controlled drainage impacts on corn yield under varying precipitation patterns: A synthesis of studies across the U.S. Midwest and Southeast”, submitted) SD – Clay County MN – Redwood County MO – Knox County 1 and 2 Randolph County, Indiana
- 4. 4
- 5. 5 Abendroth, L.J., Chighladze, G., Frankenberger, J.R., Bowling, L.C., Helmers, M.J., Herzmann, D.E., Jia, X., Kjaersgaard, J., Pease, L.A., Reinhart, B.D. and Strock, J., 2022. Paired field and water measurements from drainage management practices in row-crop agriculture. Scientific Data, 9(1), pp.1-13.
- 6. More detailed analysis of within-field spatial variability (soil, elevation) and year-to-year temporal variability (dry vs wet years) could help clarify the interactions. The objective of this study was to • evaluate the effect of controlled drainage on corn and soybean yield in a 13-year experiment in eastern Indiana • determine how soil type and elevation in dry and wet years influence the effect. 6 Objectives
- 7. NW Controlled Drainage NE SW SE Controlled Drainage 7 Study Location: Davis Purdue Agricultural Center One 15.8 ha field is split into four quadrants. (Drain spacing = 14 m)
- 8. The site is described in the Transforming Drainage Database site summary and in previous papers: 1. Delbecq, B.A., Brown, J.P., Florax, R.J., Kladivko, E.J., Nistor, A.P. and Lowenberg-DeBoer, J.M., 2012. The impact of drainage water management technology on corn yields. Agronomy journal, 104(4), pp.1100-1109. https://doi.org/10.2134/agronj2012.0003 2. Saadat, S., Bowling, L., Frankenberger, J. and Brooks, K., 2017. Effects of controlled drainage on water table recession rate. Trans. ASABE, 60(3), 813. https://doi.org/10.13031/trans.11922 3. Saadat, S., Bowling, L., Frankenberger, J., & Kladivko, E., 2018a. Estimating drain flow from measured water table depth in layered soils under free and controlled drainage. J. of Hydrol., 556, 339-348. https://doi.org/10.1016/j.jhydrol.2017.11.001 4. Saadat, S., Bowling, L., Frankenberger, J. and Kladivko, E., 2018b. Nitrate and phosphorus transport through subsurface drains under free and controlled drainage. Water Res., 142, 196-207. https://doi.org/10.1016/j.watres.2018.05.040 5. Saadat, S., Frankenberger, J., Bowling, L. and Ale, S., 2020. Evaluation of surface ponding and runoff generation in a seasonally frozen drained agricultural field. Journal of Hydrology, 588, p.124985. https://doi.org/10.1016/j.jhydrol.2020.124985 8
- 9. • Data set contained 9 years of corn yield data and 4 years of soybean yield • Geo-referenced yield points were collected by an Ag Leader Integra yield monitor • Points adjusted for delay, flow, moisture, and header width • End rows were removed 9 Raw Yield Data 2009 Processed Yield Data 2009 Yield Data Collection
- 10. A grid of 10 by 10 meter cells was created (1019 total cells). The average of all the yield points within each cell was calculated, for each year. 10 Yield Analysis 1 1 16
- 11. 2010 Yield (MT ha-1 ) Controlled Free The grid allowed for a numbering system of columns (i) and rows (j) for each cell 11 Yield Analysis 1 1 16 34,1 34,16 i , j i , j
- 12. Majority soil type in each cell Elevation range in each cell Water Control Structure 12 Blount (somewhat poorly drained) Condit (poorly drained) Pewamo (very poorly drained) Analysis by Soil type and Elevation above structure
- 13. 13 Yearly Growing Season Wetness Classification 3 years 6 years 4 years
- 14. 14 Yearly Growing Season Wetness Classification Yields Dry year (2012 Wet year (2012
- 15. For the spatial and temporal analysis a linear mixed model was created. 𝑦𝑖𝑒𝑙𝑑𝑖𝑗𝑡 = 𝛽0 + 𝑋𝑖𝑗𝑡β + 𝑟𝑖𝑗 + ε𝑖𝑗𝑡 • Fixed effects 𝑋𝑖𝑗𝑡β are drainage treatment (free or controlled drainage), soil drainage class, elevation, and wetness classification • Random effects rij account for the repeated measures because the same yield cells were being analyzed year after year. • Spatial correlation is contained in the error by assuming the spatial covariance structure: 𝜎2 ex𝑝{−𝑑𝑖𝑗/𝜃} • dij is the Euclidean distance between i columns and j rows • 𝜃 is an estimated parameter from the model 15 Statistical Analysis Thanks to Tianyang Hu from the Purdue Statistical Consulting Service for assisting with the linear mixed model.
- 16. Results Whole field over all years Whole field by wetness classification Moisture in an individual year Soil type impact Elevation impact 16
- 17. 0 2 4 6 8 10 12 14 2005 2006 2007 2008 2009 2010 2012 2014 2016 Average Corn Yield (Mg ha-1) 17 4% 6% 5% 5% Year by Year Corn Results 4% or means significant difference at p=.05 2.3%
- 18. 0 1 2 3 4 5 2011 2013 2015 2017 Average Soybean yield (Mg ha-1) 18 Year by Year Soybean Results or means significant difference at p=.05
- 19. 19 * indicates significant difference at p-value=.05 Wetness Classification Impact for Corn 0 2 4 6 8 10 12 Dry Normal Wet Corn yield (Mg ha-1) Yearly Wetness Classification *5.9% significant increase a b c c ad d
- 20. 20 Wetness Classification Impact for Soybean 0 1 2 3 4 5 Dry Normal Wet Soybean yield (Mg ha-1) Yearly Wetness Classification a a b ab c c
- 21. 21 Examining Moisture Patterns of Individual Years The yield benefits of controlled drainage are known to be strongly influenced by the temporal pattern of precipitation and water storage in the soil, but this is difficult to quantify in a single metric. Example of 2009, a Dry Year with significant increase in yield from CD:
- 22. 22 Example of effect in a dry year with rainfall after outlet raised A small amount of drain flow occurred after the outlet elevation was raised in June. This successfully kept the water table higher in the NW (CD) plot (55 days above drain in CD vs 10 days in FD). Yield was 5.4% higher in CD.
- 23. 0 2 4 6 8 10 12 Dry Normal Wet Overall Average Corn yield (Mg ha-1) 23 * significant difference at p-value=.05 VP* P* SWP VP P SWP VP* P SWP* VP* P SWP Soil Type Impact for Corn VP= Very poorly drained P= Poorly SWP= Somewhat poorly
- 24. 0 1 2 3 4 5 Soybean yield (Mg ha-1) 24 Dry Normal Wet VP* P SWP VP P SWP VP* P SWP Overall Average VP* P SWP Soil Type Impact for Soybean VP= Very poorly drained P= Poorly SWP= Somewhat poorly * significant difference at p-value=.05
- 25. • Across all soil drainage classes, the effect of controlled drainage on corn yield was greatest in dry years, as expected. • The VPD soil had the greatest positive response to controlled drainage, in both dry and wet years, which was surprising. Possible explanations: • The very poorly drained soil type is more prominent in the CD quadrants. • The early wet conditions may have caused the crop roots to be stunted, exacerbating water stress later in the season that could be alleviated by the added water storage of controlled drainage. 25 Discussion – soil type effect Majority soil type in each cell Blount (somewhat poorly drained - SWP) Condit (poorly drained - PD) Pewamo (very poorly drained - VPD)
- 26. 0 2 4 6 8 10 12 Dry Normal Wet Overall Average Corn yield (Mg ha-1) 26 <30 30-60* >60* <30 30-60 >60 <30 30-60 >60 <30 30-60 >60* Elevation Impact on Corn Yield * significant difference at p-value=.05
- 27. 0 1 2 3 4 5 Soybean yield (Mg ha-1) 27 Dry Normal Wet Overall Average <30 30-60 >60 <30 30-60 >60 <30 30-60 >60 <30 30-60 >60* Elevation Impact on Soybean Yield * significant difference at p-value=.05
- 28. • Across all elevations, the increase in yield was greatest in the dry years, as expected. • The yield increase was greatest at the highest elevations (> 60 cm above the control structure), which was not expected. • A common assumption that the yield benefit of CD does not extend above 60 cm of elevation above the structure might need to be reconsidered. Possible considerations: • Extensive capillary rise in these fine-textured soils • Stress due to lack of water in dry years has more potential to reduce yield at higher locations in the field, increasing the potential for yield improvements from CD at these elevations. 28 Discussion – elevation effect
- 29. Controlled drainage significantly increased corn yield: • 2.3% for the 9-year average • In 6 out of 9 years • 5.9% in dry years No significant yield effect on soybeans Grid based analysis with the linear mixed model accounting for autocorrelation allowed for the analysis of the impact of soil drainage class and elevation on CD. This method could be used in other studies when GPS yield monitor data is available, to determine spatially and temporally varying yield impacts of controlled drainage. 29 Conclusions
Editor's Notes
- However, published yield studies have shown mixed results. Looking at these studies by location we can see that crop yield increases (CLICK) have been found in Sweden, North Carolina, and Indiana. While (CLICK) Ohio, Canada, and Iowa have found fixed results within their locations. Canada and Ohio have studies that found increases and studied that found no effect on yield. In Iowa CD reduced yield and another study found no effect. In Onslow Canada they found a 14% reduction on corn yield with CD and (CLICK) IL found no effect. Most of these studies analyzed less than four years of crop yield data. Long term studies on how CD impacts crop yields are needed to provide greater insight into how the effects vary by weather condition. Additionally, looking at elevation and soil drainage class within a CD field could give better insight into yield benefits.
- However, published yield studies have shown mixed results. Looking at these studies by location we can see that crop yield increases (CLICK) have been found in Sweden, North Carolina, and Indiana. While (CLICK) Ohio, Canada, and Iowa have found fixed results within their locations. Canada and Ohio have studies that found increases and studied that found no effect on yield. In Iowa CD reduced yield and another study found no effect. In Onslow Canada they found a 14% reduction on corn yield with CD and (CLICK) IL found no effect. Most of these studies analyzed less than four years of crop yield data. Long term studies on how CD impacts crop yields are needed to provide greater insight into how the effects vary by weather condition. Additionally, looking at elevation and soil drainage class within a CD field could give better insight into yield benefits.
- The overall goal of this study is to increase the understanding of controlled drainage. CLICK My first objective was to assess the effect of CD on yield and determine how soil drainage class or elevation may drive that effect. CLICK MY second objective was to create an online learning module about controlled drainage CLICK And my third objective was to evaluate the knowledge gained and student perceptions of the online learning module.
- My study location is located in east-central Indiana at the Davis Purdue Agricultural Center also called DPAC for short. CLICK the 16 hectare field had CLICK two free subsurface drainage quadrants and CLICK two controlled drainage quadrants. There are 13-years of site data at this field.
- Geo-referenced yield points were collected by a yield monitor located inside the combine. The yield points were adjusted for delay, flow, moisture, and header width. This photo shows all of the yield points including the end rows. CLICK the end rows were removed and the yield points now look like this photo. The data set includes 9 years of corn yield and 4 years of soybean yield. However, because I was interested in looking at soil type and elevation within each quadrant I needed to create a way to account for spatial correlation. Yield points are highly correlated with the yield points surrounding them and this can cause issues with statistical analysis if this is not accounted for.
- I created a grid shown here that contains 10 by 10 meter yield cells. This grid allowed for a numbering system of columns and rows to be able to distinguish which yield cells are by each other. For example this yield cell here is in the 34 column and the 1 row. For each year the average of all the yield points within each cell was calculated.
- I created a grid shown here that contains 10 by 10 meter yield cells. This grid allowed for a numbering system of columns and rows to be able to distinguish which yield cells are by each other. For example this yield cell here is in the 34 column and the 1 row. For each year the average of all the yield points within each cell was calculated.
- The majority soil type within each grid was used for each yield cell. Changes in elevation across the field are expected to affect yield impacts of CD with the idea being the closer to the water control structure the more access to water the crop roots may have. LiDAR based elevation was used for this analysis. For the controlled drainage quadrants the elevation above the water control structure was used and there are three categories, less than 30 cm from the structure, 30-60 cm, and greater than 60 cm. For the free draining quadrants the lowest elevation was used. For the NW quadrant the lowest elevation was also used as the starting point to account for some uncertainty with the average at the water control structure.
- Precipitation was collected with an on-site tipping bucket. Each year was classified as dry, normal, or wet based on the growing season precipitation compared to the 30 year average. If a year was more than 100 mm from the 30-year average precipitation it was considered wet. If a year was less than 100 mm from the 30 –year normal it was considered dry. There were 4 dry years, 6 normal years, 3 wet years
- Precipitation was collected with an on-site tipping bucket. Each year was classified as dry, normal, or wet based on the growing season precipitation compared to the 30 year average. If a year was more than 100 mm from the 30-year average precipitation it was considered wet. If a year was less than 100 mm from the 30 –year normal it was considered dry. There were 4 dry years, 6 normal years, 3 wet years
- For the year-by-year mean comparison of controlled and free drainage a two sample t-test was used. For the spatial and temporal analysis within the quadrants a linear mixed model was created to account for spatial correlation and random effects. This is the yield equation to be estimated with yield being the average yield per cell in column i and row k in the tth year. The fixed effects were drainage treatment (free or controlled drainage), soil drainage class, elevation, and wetness classification. The random effects rij account for the repeated measures because the same yield cell was being analyzed year after year. This is also known as compound symmetry. The spatial correlation of the yield points was contained in the error with this spatial covariance structure with d ij being the Euclidean distance between the columns and rows and the impact of the spatial covariance decreased at an exponential rate.
- Controlled drainage significantly increased yield in 6 out of the 9 years and the 9-year average. In 2014 and 2016 there was no difference between treatment and 2010 was the only year that CD decreased yield. CLICK in some years yield was 4% greater in the CD quadrants
- Controlled drainage significantly increased soybean yield in three out of 4 years. However, the 4-year average had no effect and in 2017 CD decreased yield.
- Looking at yearly wetness classification we can see that yield in general was highest in the normal years and lower in the wet and dry years. CD had the greatest impact on corn yield during the dry years by 5.9%
- Soybean yield had lower yields in the wet year as well and there was no significant differences in yield.
- Precipitation was collected with an on-site tipping bucket. Each year was classified as dry, normal, or wet based on the growing season precipitation compared to the 30 year average. If a year was more than 100 mm from the 30-year average precipitation it was considered wet. If a year was less than 100 mm from the 30 –year normal it was considered dry. There were 4 dry years, 6 normal years, 3 wet years
- For the year-by-year mean comparison of controlled and free drainage a two sample t-test was used. For the spatial and temporal analysis within the quadrants a linear mixed model was created to account for spatial correlation and random effects. This is the yield equation to be estimated with yield being the average yield per cell in column i and row k in the tth year. The fixed effects were drainage treatment, soil drainage class, elevation, and wetness classification. rij account for the repeated measures because the same yield cell was being analyzed year after year this is also known as compound symmetry. The spatial correlation of the yield points was contained in the error with this spatial covariance structure with d ij being the Euclidean distance between the columns and rows and the impact of the spatial covariance decreased at an exponential rate.
- For soil drainage class we have VP= the very poorly P= poorly drained and SWP = somewhat poorly drained. For the dry years CD yield was higher in all soil types and had a significance difference in the VP and poorly drained. In the normal years CD had higher yields in the VP and P drained. In the wet years, CD had significantly greater yield in the very poorly drained and decreased yield in the SWP drained. Overall CD had the greatest impact on the VP drained soils.
- For soybeans the pattern was similar with the greatest impact again being in the very poorly drained soils.
- To conclude CD did significantly increase corn yield and soybean yield in 3 individual years. The greatest benefits were in the dry years. The grid allowed for a statistical analysis on the impact of soil drainage class and elevation.
- For elevation in the dry years for corn all elevation ranges had higher yields than FD and yield was significantly higher in the 30-60 and greater elevations. The lowest elevation was almost significant with a p-value of .054… In normal years yield was pretty similar for the two treatments. During wet years, yields were lower and increased with an increase in elevation. For the overall average the greatest impact was in the higher elevations.
- For soybean yield the overall average in the highest elevation was significant.
- To conclude CD did significantly increase corn yield and soybean yield in 3 individual years. The greatest benefits were in the dry years. The grid allowed for a statistical analysis on the impact of soil drainage class and elevation.
- To conclude CD did significantly increase corn yield and soybean yield in 3 individual years. The greatest benefits were in the dry years. The grid allowed for a statistical analysis on the impact of soil drainage class and elevation.