Nutrient Loss Reduction Drainage Water Recycling
•Download as PPTX, PDF•
0 likes•391 views

72nd SWCS International Annual Conference July 30-August 2, 2017 Madison, WI

Recommended
Recommended
More Related Content
What's hot
What's hot (20)
Similar to Nutrient Loss Reduction Drainage Water Recycling
Similar to Nutrient Loss Reduction Drainage Water Recycling (20)
More from Soil and Water Conservation Society
More from Soil and Water Conservation Society (20)
Recently uploaded
Recently uploaded (20)
Nutrient Loss Reduction Drainage Water Recycling
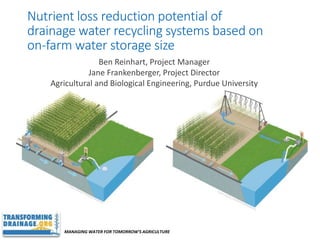
- 1. MANAGING WATER FOR TOMORROW’S AGRICULTURE Nutrient loss reduction potential of drainage water recycling systems based on on-farm water storage size Ben Reinhart, Project Manager Jane Frankenberger, Project Director Agricultural and Biological Engineering, Purdue University
- 2. MANAGING WATER FOR TOMORROW’S AGRICULTURE Water storage and management in the Midwest • Improve drainage to support production • Tile drains increase loss of nitrate (and phosphorus) Outlet (i.e. stream)
- 3. MANAGING WATER FOR TOMORROW’S AGRICULTURE Options for reducing nutrient loads • Reduction efficiencies are highly variable across practices Source: Iowa Nutrient Reduction Strategy Science Assessment Nitrogen Reduction Target = 41%
- 4. MANAGING WATER FOR TOMORROW’S AGRICULTURE Drainage water recycling
- 5. MANAGING WATER FOR TOMORROW’S AGRICULTURE • How will this vary across climate and soils? • How much storage is needed to meet crop or water quality targets? Designing drainage water recycling systems
- 6. MANAGING WATER FOR TOMORROW’S AGRICULTURE Water balance in DWR systems • Track: 1. Daily drain flow 3. Water level and volume 2. Soil water storage
- 7. MANAGING WATER FOR TOMORROW’S AGRICULTURE Soil water storage • Defining the soil water reservoir • Variables: + Eff. Precip. (Pe) + Irrigation (I) - Evaporation/ Transpiration (ET) Daily Soil Water = Pe + I – ET
- 8. MANAGING WATER FOR TOMORROW’S AGRICULTURE Soil water storage • Effective Precipitation • FAO CLIMWAT • Reference/Crop ET • Daily climate on- site (L. Bowling, Purdue) • FAO CropWat Kc (Maize)
- 9. MANAGING WATER FOR TOMORROW’S AGRICULTURE Storage level and volume Avg. Depth Area • Variables: + Drain flow (D) + Precipitation (P) - Evap.(E) - Irrigation (I) - Seepage (S) Daily Water Volume = D + P – E – I – S
- 10. MANAGING WATER FOR TOMORROW’S AGRICULTURE Water level and volume • Measured daily drain flow and precipitation • Evaporation (NWS pan avg. monthly values) • Seepage (3mm/day constant) 0 2 4 6 8 Jan Feb Mar Apr May Jun Jul Aug Sep Oct Nov Dec mm/day Evaporation 0 2 4 6 8 10 12 14 mm/day Drain flow
- 11. MANAGING WATER FOR TOMORROW’S AGRICULTURE Water balance in DWR systems • As water is added to the system: 1. Capture if capacity > flow 2. Bypass if capacity < flow
- 12. MANAGING WATER FOR TOMORROW’S AGRICULTURE Water balance in DWR systems • As water is removed from the system: 1. Irrigation applied if demand < stored volume 2. Storage Deficit if demand > stored volume
- 13. MANAGING WATER FOR TOMORROW’S AGRICULTURE Davis Purdue Agriculture Center (DPAC) Field Data (2006-2016, daily) • Drain flow • Weather • Water Quality • Nitrate-N • Total Phosphorus (2012-2016) Data from Saadat, Bowling, Frankenberger
- 14. MANAGING WATER FOR TOMORROW’S AGRICULTURE Davis Purdue Agriculture Center (DPAC) Drain flow: 368 mm/yr (avg.); 232 mm Min., 470 mm Max 0 2 4 6 8 10 12 14 16 Nitrate-Nitrogen(mg/l) 0 0.05 0.1 0.15 0.2 0.25 0.3 TotalPhosphorus(mg/l)
- 15. MANAGING WATER FOR TOMORROW’S AGRICULTURE Various Sizes of Storage 2% of field area 4% of field area 6% of field area 8% of field area 10% of field area Avg. Depth: 3 m Field Area: 80 ac. 10% 8% 6% 4% 2% Drainage water recycling in MI 5 acres 1 acre each
- 16. MANAGING WATER FOR TOMORROW’S AGRICULTURE Results: % of Annual Drain Flow Captured 0% 20% 40% 60% 80% 100% 2% 4% 6% 8% 10% Storage Area/Field Area Avg
- 17. MANAGING WATER FOR TOMORROW’S AGRICULTURE 0 10 20 30 40 Orig. Load 2% 4% 6% 8% 10% Storage Area/Field Area Avg Results: Nitrate-N Load Captured (kg/ha) N
- 18. MANAGING WATER FOR TOMORROW’S AGRICULTURE 0 0.2 0.4 0.6 0.8 1 Orig. Load 2% 4% 6% 8% 10% Storage Area/Field Area Avg Results: Total Phosphorus Load Captured (kg/ha) N P
- 19. MANAGING WATER FOR TOMORROW’S AGRICULTURE 0 30 60 90 120 150 180 210 Desired 2% 4% 6% 8% 10% Storage Area/Field Area Avg Results: Applied Irrigation (mm/yr)
- 20. MANAGING WATER FOR TOMORROW’S AGRICULTURE Results: Spatial Variability DPAC (Indiana) Drain Flow: 232-470 mm Southeast Research Farm (Iowa) Drain Flow: 56-535 mm 0% 20% 40% 60% 80% 100% 2% 4% 6% 8% 10% Storage Area/Field Area Avg 0% 20% 40% 60% 80% 100% 2% 4% 6% 8% 10% Storage Area/Field Area Avg Data courtesy Dr. Matt Helmers, Iowa State University Example - % of Annual Drain Flow Captured
- 21. MANAGING WATER FOR TOMORROW’S AGRICULTURE Conclusions How much storage do we need? • 4% storage= 31% avg. reduction • 6% storage= 49% avg. reduction • 8% storage= 66% avg. reduction DWR 4% DWR 6% DWR 8%
- 22. MANAGING WATER FOR TOMORROW’S AGRICULTURE Next Steps 1. Evaluation across variable climate and soils 2. Development of online tool for evaluating DWR systems
- 23. THIS MATERIAL IS BASED UPON WORK THAT IS SUPPORTED BY THE NATIONAL INSTITUTE OF FOOD AND AGRICULTURE, U.S. DEPARTMENT OF AGRICULTURE, UNDER AWARD NUMBER 2015-68007-23193, “MANAGING WATER FOR INCREASED RESILIENCY OF DRAINED AGRICULTURAL LANDSCAPES”, HTTP://TRANSFORMINGDRAINAGE.ORG. ANY OPINIONS, FINDINGS, CONCLUSIONS, OR RECOMMENDATIONS EXPRESSED IN THIS PUBLICATION ARE THOSE OF THE AUTHOR(S) AND DO NOT NECESSARILY REFLECT THE VIEW OF THE U.S. DEPARTMENT OF AGRICULTURE. University of Missouri MANAGING WATER FOR TOMORROW’S AGRICULTURE Managing Water for Increased Resiliency of Drained Agricultural Landscapes
Editor's Notes
- Don’t focus on the tool but rather the activity of tracking water balances and nutrient reductions
- Include a map