1. Available online at www.banglajol.info
Bangladesh J. Sci. Ind. Res. 51(1), 55-60, 2016
Automatic classification of music based on the correlation between mood,
linguistic and audio features
N. A. Rakib1, Md. M. B. Sobhan1, S. M. Z. Farhan1 and M. I. Zaber2
1
Department of Computer Science and Engineering, BRAC University, Bangladesh
2
Department of Computer Science and Engineering, University of Dhaka, Bangladesh
Abstract
The emergence of the music in recent times has been enviable. Some people consider music to be an integral part of their regular lives, while
others sometimes even consider music to be some divine inspiration setting the mood for them for the rest of the day. For such people, a
well-trimmed precise playlist of the songs that they would love to listen to, based on genre or mood of the songs, is priceless. Genre of an
individual song is very much available, as that information is mostly provided within the song, but getting to judge the mood of the song is
much more of a challenge. If it is a challenge itself for one distinct song, then one can easily imagine the hassle that a person faces when
selecting a playlist of songs from a huge library of music. This ultimately gives rise to the importance of the classification of music based
on the mood of the individual songs.
This paper establishes such a method, which ultimately works with a combination of features, such as the linguistic and audio features of a
song to classify a song according to the mood the song represents or is appropriate for. These features are then used in conjunction with sev-
eral metrics to find out their relevance or relationships and measured for validation purposes.
Keywords: tf; idf; Arousal; Valence; u-test; Correlation
Introduction
For the purpose of this project the database of songs was
chosen to be the Million Song Dataset (MSD) and the
MusiXmatch dataset. The Million Song Datasetis a collec-
tion of audio features and metadata for a million popular
tracks, from which we have used a subset of approximately
10,000 songs (Bertin et al., 2011). The dataset was then
refined by making comparisons with the MusiXmatch
dataset (Anon 2015) for the purpose of assigning lyrics to the
dataset of the music tracks. Then tf*idf metric was imple-
mented on these lyrics to find out the importance of each of
the words.
To find out the mood features associated with the lyrics we
had made an extensive usage of the Affective Norms for
English (ANEW) dictionary, which itself was a research
matter to provide a set of normative emotional ratings for a
large number of words in the English language (Bradley and
Lang,1999). A Mann-Whitney U-test was done, using the
tf*idfvalues of all the songs and those for which the lyrical
features were available at the ANEW dictionary, to validate
our process even further. Finally the correlations between the
audio, lyrical and mood featureswerecomputed to find out
the relationships between them and make conclusions about
their significance to the classification of music.
Classification process
As mentioned before, the data source for this project was
chosen to be the Million Song Dataset (MSD). The subset of
the whole dataset of audio tracks' information, that we used,
was refined after cross-matching with the dataset provided
by the MusiXmatch dataset to form a set of records showing
the song-ids of the individual tracks, words contained with-
in the lyric of the track and the number of times that each of
the words had come up for the whole track. An example,
containing only a few of all the resultingrecords, is shown
below:
Lyrics features determination
For determining the lyrical features of the songs, found ear-
lier, we had used the Term Frequency-Inverse Document
Frequency, TF-IDF, metric. Simply put, the number of times
a term occurs within a document is called the term frequen-
cy and is based on the Luhn assumption, the weight of a
word that arises in article is comparative to the term frequen-
cy (Luhn, 1957).
BANGLADESH JOURNAL
OF SCIENTIFIC AND
INDUSTRIAL RESEARCH
E-mail: bjsir07@gmail.com
*Corresponding author. e-mail: nibras.rakib@gmail.com
BCSIR
2. 56 Automatic classification of music based 51(1) 2016
According to Karen Sparck Jones, the inventor of the idea,
the Inverse Document Frequency is the specificity of a word
can be calculated as an inverse function of the number of
article in which it occurs (Spärck, 1972).
So, to clarify matters, the formulae for the tf*idf calculation
can be expressed as follows (McVicar et al., 2011)
|word iappears in the lyric j|
tfi,j= ---------------------------------------------------------------------------------------------
lyric j
log (total number of lyrics )
idfi = ---------------------------------------------------------------------------------------------
| lyrics containing the word i|
And thus, TF-IDF = tfi,j*idfi.
The TF-IDF values for all the words were input into our
existing dataset to be used to validate our choice of words,
which will be discussed at a later section, i.e. Section 2.3.
Classification by emotion
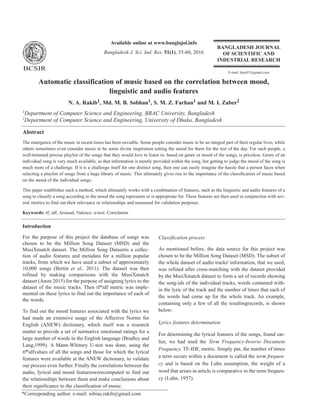
The most common method of quantifying an emotional state
is by associating it with a point in a 2-dimensional space
with valence (attractiveness/aversion) and arousal (energy)
as dimensions, as stated by Russell (Russell, 1980). An
example of such a 2-dimensional space representation is pro-
vided below:
In such a space a high valence value corresponds to positive
mood, such as 'happy' or 'elated', and high arousal values
depict energetic state, e.g. 'excited'. For a particular song its
valence and arousal values can be plotted on this 2-dimen-
sional space to make conclusive deductions about the song's
mood representations. For the sake of our project, we found
the mean valence and arousal values of the words by taking
the help of the Affective Norms for English (ANEW) dic-
tionary. The ANEW was developed to provide a set of nor-
mative emotional ratings for 1030 words on pleasure, arous-
al, dominance, collected by psycholinguistic experiments, in
the English language (Bradley and Lang,1999).
Table I. Individual track id with words from their lyrics and the no of times each word has come up in the song
Song ID Words Times
TRAAABD128F429CF47 deep 4
TRAAABD128F429CF47 beat 1
TRAAABD128F429CF47 after 2
TRAAABD128F429CF47 fade 2
TRAAABD128F429CF47 waste 3
TRAAABD128F429CF47 trust 1
TRAAABD128F429CF47 already 2
TRAAABD128F429CF47 style 2
TRAAABD128F429CF47 asleep 1
TRAAABD128F429CF47 worse 2
TRAAABD128F429CF47 goal 2
TRAAAEF128F4273421 i 5
TRAAAEF128F4273421 the 4
TRAAAEF128F4273421 you 3
TRAAAEF128F4273421 to 2
TRAAAEF128F4273421 and 1
TRAAAEF128F4273421 a 11
TRAAAEF128F4273421 not 4
TRAAAEF128F4273421 is 9
TRAAAEF128F4273421 of 3
TRAAAEF128F4273421 that 2
TRAAAEF128F4273421 do 1
TRAAAEF128F4273421 are 1
3. Rakib, Sobhan, Farhan and Zaber 57
Even though the mean arousal and valence values for all the
words were not found, nevertheless, the dataset had to be fil-
tered even further to contain only the words that were also
found in the ANEW dictionary. Taking thosevalues we com-
puted the valence and arousal levels of the individual tracks,
included within our existing dataset. This was done in the
following method (McVicar et al., 2011):
Table II. A subset of the main dataset containing the valence and arousal values computed for
each trackid
TrackId Valence Arousal
TRAAABD128F429CF47 6.327742 4.005484
TRAAAEF128F4273421 6.396154 3.923077
TRAAAFD128F92F423A 5.490606 4.119697
TRAAARJ128F9320760 5.881944 3.844444
TRAABJV128F1460C49 5.99925 4.1535
TRAABLR128F423B7E3 5.630816 4.235918
TRAABVM128F92CA9DC 6.200612 4.1300
TRAACER128F4290F96 5.636667 4.105333
TRAACFV128F935E50B 5.923939 4.299091
TRAACHN128F1489601 5.896667 3.8400
TRAADLH12903CA70EE 4.58875 4.778125
TRAADNA128F9331246 5.880526 4.072105
TRAADQX128F422B4CF 05.7800 3.783667
TRAADYB128F92D7E73 5.868889 4.01500
TRAADYI128E078FB38 5.820667 4.122889
TRAAENC128F1451DE9 5.967544 4.161754
Fig. 1. 2-dimensional space representation of emotion (Pete et al., 2013)
4. 58 Automatic classification of music based 51(1) 2016
If we consider li= (w1,w2...wn) be the ith lyric, consisting of
ni words and that in our complete collection of lyrics of the
songs we have a set of {l1, l2 ... lm} lyrics; then the valence,vi,
and arousal, ai, of the lyric i can calculated as,
where 'V' and 'A' are the mean values of valence and arous-
al, respectively, for each of the words.
A subset of the whole dataset, consisting of the individual
song-ids and their resulting valence & arousal values, is
given below in Table II.
When these values were plotted onto the 2-dimensional
valence/arousal space, described earlier, then the resulting
plot showed the emotional categories for the songs from our
dataset, as shown on Fig 2.
Validation procedures
In Section 2.1 we had found the TF-IDF values for all the
words within our previous version of the dataset. At this
point, a new set of TF-IDF values were to be found for the
current dataset, containing the words which were also found
in the ANEW dictionary. The TF-IDF values were then
summedfor both the datasets and the results were compared
with each other using the Mann-Whitney U-test.
In statistics, the Mann-Whitney U-test (also called the
Mann-Whitney-Wilcoxon (MWW), Wilcoxon rank-sum test
(WRS), or Wilcoxon-Mann-Whitney test) is a nonparametric
test of the null hypothesis that two samples come from the
same population against an alternative hypothesis, especial-
ly that a particular population tends to have larger values
than the other. The Null-hypothesis refers to a scenario that,
there is relationship between two measured phenomena.
Rejecting the Null hypothesis depicts the fact that, there
might indeed be a relationship between two phenomena.
For our test, the result came out to be,
p = 1.276144623544912e-273
h = 1.
Such values for p & h indicate the rejection of the Null
hypothesis, meaning that the two instances of the total TF-
IDF values used for the test were related, thus validating the
words that we had chosen for our project through automatic
filtering.
Results and discussion
All these previous steps were followed with a view to estab-
lishing a relationship between the lyrical, audio features of
song based on the moods, as show in Fig 5. In this regard we
used the Pearson product-moment correlation coefficient to
compute the correlation between arousal and valence, sepa-
Fig. 2. Plotted results of the valence and arousal values for each of the individual songs onto a 2-dimensional space, where
the x & y axis show valence & arousal values respectively
5. Rakib, Sobhan, Farhan and Zaber 59
rately, with a few selected audio features from the Million
Song Dataset, namely tempo, loudness, hotness, artist famil-
iarity, key confidence, and duration.
As it was beyond the resource capabilities available to us to
compute these correlations using all the records of our
dataset, we took only a few and completed our computations.
The produced results showed a moderate negative correla-
tion between valence and loudness and moderate positive
correlation between valence and tempo as shown in Fig 3
and also arousal gave a moderate positive correlation with
respect to loudness as shown in Fig 4
This actually makes sense in a way that, a listener should get
more excited (high arousal) when a louder music gets to be
played.While music with a higher tempo should be able to
please (high valence)the listener more, a lower tempo is
much more applicable for an upset listener. The other fea-
tures also showed some correlations, yet they were either
irrelevant or produced too low of a correlation value.
Although, our methodology did produce some encouraging
results, but those could have been more precise and distinct
under different circumstances. Such results with only a few
of the records encourages us to predict that, such a system
might be able to produce better results if the entire dataset
was entered into the system, and apparently that would
require more robust platforms to perform such a hectic task.
Fig. 3. Correlation between Valence (x-axis) and loudness
along with tempo (both on y-axis)
Fig. 4. Correlation between Arousal (x-axis) and loudness
(y-axis)
Fig. 5. Connectivity of various Datasets, showing a brief overview of the steps undertaken during the experiment.
6. 60 Automatic classification of music based 51(1) 2016
Conclusion
With the current craze on music sharing on the web plat-
forms, it will not be long before people will not even have to
select music tracks for a particular playlist, it shall be
achieved through automation. But for now, an automatic
classification of music depending on mood itself is a major
challenge. Our paper has only served to address this issue
and strive for a solution to this problem in an organised way.
While as mentioned earlier, performance can be improved
using better facilities but they could also be improved using
some other popular techniques such as Canonical
Correlation Analysis. As Matt, Tim and Tijl (McVicar et al.,
2011) shows, early results show great promises. Another
learning model technique that might produce better discrim-
ination between features is Support Vector Machine (Hu et
al., 2008). Due to time constraints these techniques could not
be utilised to show how their outputs might vary, but could
certainly be carried out in the future with a great hope of bet-
ter findings, and hopefully even a better system.
References
Anon (2015), The MusiXmatch Dataset, http:// labrosa.ee.
columbia.edu/millionsong/musixmatch
Bertin-Mahieux T, Daniel PW, Ellis, Whitman B and Paul
Lamere (2011), The Million Song Dataset. In
Proceedings: 12th International Society for Music
Information Retrieval Conference (ISMIR)..
Bradley MM and Lang PJ (1999), Affective norms for
English words (ANEW): Instruction manual and
affetctive ratings. Technical Report C-1, TheCenter for
Research in Psychology, University of Florida.
Hu X, Downie JS, Laurier C, Bay M and Ehmann AF
(2008), The 2007 mirex audio mood classification task:
Lessons learned. In Proceedings: ISMIR, p 462-467.
Luhn, Hans Peter (1957), A Statistical Approach to
Mechanized Encoding and Searching of Literary
Information (PDF). IBM Journal of research and
development (IBM) 1 (4): 315. doi:10.1147/rd.14.0309
McVicar M, Freeman T and De Bie T (2011), Mining the
correlation between lyrical and audio features and the
emergence of mood. In: Proc. ISMIR. pp 783-788
Pete C, Trimmer, Elizabeth S, Paul, Mike T, Mendl John M,
McNamara and Alasdair I. Houston (2013), On the
Evolution and Optimality of Mood States.
Russell JA (1980), A circumplex model of affect, Journal of
personality and social psychology. 39(6): 1161.
Spärck JK (1972), A Statistical Interpretation of Term
Specificity and Its Application in Retrieval. Journal of
Documentation 28: 11-21.doi:10.1108/eb026526
Received: 08 September 2015; Revised: 20 September 2015;
Accepted: 08 November 2015. .