
Recommended
Recommended
More Related Content
Similar to ECET345 Signals and Systems Homework #4 Name of Stud.docx
Similar to ECET345 Signals and Systems Homework #4 Name of Stud.docx (20)
More from SALU18
More from SALU18 (20)
Recently uploaded
Recently uploaded (20)
ECET345 Signals and Systems Homework #4 Name of Stud.docx
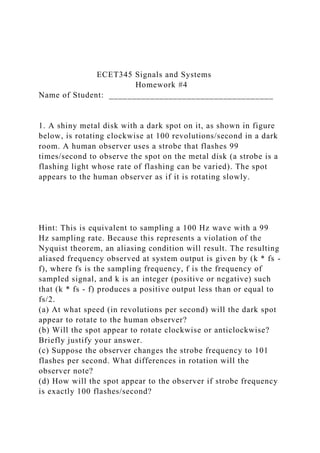
- 1. ECET345 Signals and Systems Homework #4 Name of Student: ____________________________________ 1. A shiny metal disk with a dark spot on it, as shown in figure below, is rotating clockwise at 100 revolutions/second in a dark room. A human observer uses a strobe that flashes 99 times/second to observe the spot on the metal disk (a strobe is a flashing light whose rate of flashing can be varied). The spot appears to the human observer as if it is rotating slowly. Hint: This is equivalent to sampling a 100 Hz wave with a 99 Hz sampling rate. Because this represents a violation of the Nyquist theorem, an aliasing condition will result. The resulting aliased frequency observed at system output is given by (k * fs - f), where fs is the sampling frequency, f is the frequency of sampled signal, and k is an integer (positive or negative) such that (k * fs - f) produces a positive output less than or equal to fs/2. (a) At what speed (in revolutions per second) will the dark spot appear to rotate to the human observer? (b) Will the spot appear to rotate clockwise or anticlockwise? Briefly justify your answer. (c) Suppose the observer changes the strobe frequency to 101 flashes per second. What differences in rotation will the observer note? (d) How will the spot appear to the observer if strobe frequency is exactly 100 flashes/second?
- 2. 2. (a) A system samples a sinusoid of frequency 480 Hz at a rate of 100 Hz and writes the sampled signal to its output without further modification. Determine the frequency that the sampling system will generate in its output. Hint: keep in mind that no discrete system can generate an output greater than fs/2 where fs is the sampling frequency. Also, the frequencies produced by sampling a sinusoid are given by However, the only frequency that will come out of the system will be the one that is between 0 and fs/2. So choose k, positive or negative, such that it yields a positive output frequency less than fs/2. Note that only one value of k will yield a positive frequency in the range 0 to fs/2. (b) Find the output frequency when the input frequency is 425 Hz. Assume fs is unchanged at 100 Hz. Show the value of k chosen. 3. The spectrum of an analog signal is shown below, containing . Such a signal is sampled by an ideal impulse sampler at a 100 Hz rate. List the first 10 positive frequencies that will be produced by the replication. (Hint: Follow the method outlined in the lecture for spectrum replication of sampled signals.) 4. The spectrum of an analog signal is shown below. It is sampled, with an ideal impulse sampler, at a rate of 200 Hz. (a) Draw the spectrum of the sampled signal and show the
- 3. baseband and first two positive frequency replications with their end frequency values marked. (Hint: Follow the method outlined in the lecture.) (b) State below the frequency range of the signal, in baseband, that will become corrupted and thus unrecoverable because the signal was undersampled. (Hint: The area of corruption is the area in which baseband and first positive frequency image overlaps.) 5. Determine the Z transform of the signal,, shown below using the basic definition of Z transform . All values not shown can be assumed to be zero. 6. (a) A simulation diagram is shown below. Determine the difference equation associated with the diagram. (b) A DE is shown below. Draw the simulation diagram corresponding to it. 7. An analog signal is given by f(t) = t (i.e., it increases linearly with time and is thus is a unit ramp.) It is convolved with a second signal, g(t), which is of the form g(t) = 1 (i.e., it has a constant value of 1 or is a unit step function). The two signals are shown below. Now evaluate this integral and find the value of the integral when t = 2. The signals here are simple enough to visualize: Convolution of two signals or functions is the area under the product of signal 1
- 4. with that of the signal 2 reflected (i.e., f(-t)) at any particular instant , t, as the reflected signal 2 is slid past the first signal to the right. This sliding to the right is the delaying of the reflected signal by t seconds. See the example on page 98 of the textbook. -2-10123456 -3 -2 -1 0 1 2 3 sample number or n value of sample an arbitrary sequence, all values not shown are zero ECET345 Signals and Systems Homework #5 Name of Student __________________________________________ 1. Using z-transform tables (page 776 of text or equivalent), find the z-transform of (a) (b) (c) and express it in positive powers of z. When computing the value of trigonometric functions, keep in mind that the arguments are always in radians and not in degrees.
- 5. (d) and express it in positive powers of z 2. Find the inverse z-transform, x(n), of the following functions by bringing them into a form such that you can look up the inverse z-transform from the tables. This will require some algebraic and /or trigonometric manipulation/calculation. You will also need a table of z-transforms (page 776 of text or equivalent). When computing the value of trigonometric functions, keep in mind that the arguments are always in radians and not in degrees. (a) then use the z-transform tables. Having found the inverse z- transform, determine its numerical value at n = 2. (b) Using partial fraction expansion , find the inverse z- transform of (c) Using the tables, find the inverse z-transform of (d) Using the tables, find inverse z-transform of 3. Find the first seven values (i.e., x(n) for n = 0 to 6) of the function given below. Hint: Manually calculate the three parts separately for various values of n and add or subtract them point by point for various values of n. For example, for n = 2 equals 2 * 2 * 1 (or 4); for n = 5 equals 2 * u(2) or 2 * 1 = 2; and so on. Also keep in mind that u(n - k) is a unit step function delayed by k samples, and hence it will be zero for all values of (n - k), which are negative
- 6. and 1 otherwise. Write the numerical values here as a row vector. 4. The simulation diagram of a discrete time system is shown below. Find the first six output (y(0) to y(6)) of the system when an input x(n) , as computed in problem 3, is applied to the discrete time system. (a) Determine the difference equation of the system. (b) Find the first six outputs (y(0) to y(5)) using the iteration method as explained in the lecture. Assume all initial conditions to be zero. (c) Given the transfer function shown below, convert it into a difference equation. 5. The impulse response of a discrete time system is given by h(n) = [ 1 -1 2 ]. To such a system we apply an input of the type x(n) = [ 2 1 2 3 ]. Use MATLAB to convolve the two sequences and enter the answer below.
- 7. 6. A system is described by the transfer function below. Find the location of poles and zeros of the system and write them here. Is this a stable system? Why or why not? 7. The transfer function of a discrete time system is given by The system has a sampling rate of 100 Hz. Calculate the frequency response of the system at 25 Hz input frequency as a complex number in both rectangular and polar form. 4