
Recommended
Recommended
More Related Content
What's hot
What's hot (20)
Viewers also liked
Viewers also liked (14)
Similar to MET411FinalReport
Similar to MET411FinalReport (20)
MET411FinalReport
- 1. To: Professor Xu From: Rudy Bores, David Carver, Joshua Allison Subject: MET 411 Group Project: 3D Concrete Overpass Date: 5/5/2015 EXECUTIVE SUMMARY: To complete this project MSC Patran/Nastran software was used to analyze a solid concrete overpass. To create this overpass the geometry from the overpass in exam two was used. This geometry was utilized to create a surface that was use to create the 3D solid analyzed. This solid was divided into sections using the plane break feature to create an area to apply the distributed load along the tire track width of an average car. The average weight of a motor vehicle was found to be roughly 4,000 lb and this force was applied as a distributed load along the top of the tire track planes. This load was to simulate a worst case scenario of heavy traffic continually moving across the bridge. The bottom surfaces of the overpass were constrained for no displacement to simulate the base of the structure. The overpass was defined as being constructed of portland cement and containing no additional materials or structural steel supports. The results of this analysis produced a maximum deflection of 0.12 in and a maximum stress of 3540 psi. This value for stress is almost half of the compressive strength of portland cement which is 6,000 psi. This analysis was performed utilizing three additional geometries to observe the change in the stress and deflection patterns. The geometries utilizing the rectangular and semicircular overpass produced the lowest maximum stress values due to their larger cross sectional areas compared to the test geometry. These two geometries produced a very similar stress values of roughly 2,750 psi. The last geometry utilized, flush archway, attempted to move the semicircular archway higher to reduce the cross sectional area. This analysis proved that the cross sectional area had been reduced too much and the maximum stress produced was almost 4,400 psi. This stress occurs in two areas along the top of the overpass and are centered between the two sets of tire tracks. This geometry threatens to cause tensile stresses at the bottom to the archway and should be avoided. The results of this analysis seem to suggest that by lowering the height of the flush geometry to increase the cross sectional area, the maximum stress produced can be lowered and the structural geometry can be optimized. A final analysis was performed on the test geometry using a distributed load of 80,000 lb/in to simulate the maximum legal load of a tractor-trailer without any additional permits. This load produced an analysis that shows complete failure for the overpass and producing a maximum stress of roughly 71,000 psi. This stress is well above the compressive strength of the portland cement.
- 2. PROBLEM STATEMENT: For this project it was decided that the concrete overpass structure from exam two would be analyzed as a 3D solid structure. This solid structure is assumed to be made entirely of portland cement and has no structural steel components. The maximum stress and displacements of the birge will be analyzed assuming average loading conditions. The archway geometry will be changed in an attempt to optimize the loading conditions. FINITE ELEMENT ANALYSIS: I) Geometry: The geometry of the concrete overpass is base off of the geometry given in exam two. The geometry was created in MSC Patran by creating a rectangular surface and then utilizing the subtract command to create the archway. Once the surface had been created the extrude feature was utilized to create a 3D solid 564 in thick. Once the solid had been created it was separated into 9 sections, to simulate the load application area, utilizing the plane break feature. This planes were created using the 3 Point create plane feature using the input points shown below. Alternate geometries analysed can be viewed in the additional figures section. FIGURE 1: Overpass Geometry
- 3. II) Meshing : The Overpass geometry was meshed by creating a uniform solid mesh using Tet element shape, IsoMesh mesher, Tet10 topology, and a global edge length of 24”. The resulting mesh created 21,500 elements and 32,650 nodes. III) Boundary/Load Conditions : The base of the overpass was constrained in all directions for zero displacement in translational and rotational planes. This simulates the overpass being anchored to the ground. A uniform distributed load of 4,000 lb/in was applied to the top surface of the overpass along the designated tire tracks. This load is to simulate continual traffic across the bridge. A maximum load of 80,000 lb/in was applied to the test geometry only. FIGURE 2: Overpass Meshing, Boundary, & Load Conditions IV) Material Properties: The overpass is made of portland cement and the material properties can be viewed in the table blow.
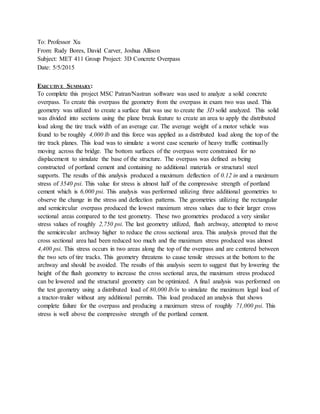
- 4. RESULTS: The results of the MSC Patran/Nastran analysis can be viewed in the tables and figures below. The analysis shows that the maximum stress magnitudes are usually located near the intersection of the circular archway and the support legs as can be seen in Figure 3. With the rectangular geometry the maximum stress is located at the right angle created by the archway. For the geometry that only used the semi-circular archway the maximum stresses were located along the tire tracks. Finally for the flush archway geometry used the maximum stress was located in between the two tire track loading planes created. The maximum deflection for the overpass was located at the center of the innermost tire track for all geometries analysed except the flush archway. The flush geometry maximum displacement is located in between the tire tracks created. The magnitudes and nodal location of the maximum stresses and displacements can be observed in table 4. For the final analysis a distributed load of 80,000 lb/in was used to simulate the maximum load expected. FIGURE 3: Overpass Stresses
- 5. FIGURE 4: Overpass Displacements CONCLUSION: The test geometry used performed well when the average load was applied. This load was applied along the surface of the tire track sections created to attempt to simulate continuously moving traffic across the bridge. When under this load the test geometry showed a maximum stress of 3,540 psi. This load occurred at the intersection of the archway cutout and is a stress caused by compressive forces. This stress would produce a factor of safety of 1.69 for the test geometry which is relatively low. For a bridge that would experience consistent repeated loads a factor of safety over 3 would be preferable. The use of the semicircle for the archway produced the best results when observing the factor of safety. This is believed to be due to the increased cross sectional area caused by the use of this geometry. This same trend can be observed in the use of the rectangular archway. The use of the rectangular geometry is not efficient because of the high stress concentration caused by the sharp intersection of the archway. When observing the flush geometry for the archway it can be seen that the stress plot pattern changes and the maximum stress is located centered between the respective tire tracks. This could result in tensile stresses in the bottom of the bridge and should be avoided. If the height of the flush archway was
- 6. decreased the surface area of the cross section could be increased. This group believes that this could be a possible alternative to the use of the test geometry or the use of only the semicircular archway geometries. ADDITIONAL FIGURES: FIGURE 5: Overpass Stress (Max Load) FIGURE 6: Overpass Displacements (Max Load)
- 7. FIGURE 7: Overpass Semi-Circle Only (38,019 Nodes, 25,455 Elements) FIGURE 7: Overpass Displacements (Semi-Circle Only) FIGURE 8: Overpass Displacements (Semi-Circle Only)
- 8. FIGURE 7: Overpass Rectangular Archway (36,667 Nodes, 24,552 Elements) FIGURE 9: Overpass Displacements (Rectangular Archway) FIGURE 10: Overpass Displacements (Rectangular Archway)
- 9. FIGURE 7: Overpass Flush Archway (31,927 Nodes, 20,892 Elements) FIGURE 11: Overpass Stress (Flush Archway) FIGURE 12: Overpass Displacements (Flush Archway)
- 10. FIGURE 13: Overpass (Alternate Geometries) FIGURE 14: Overpass (Plane Separations)