
Recommended
More Related Content
What's hot
What's hot (20)
Similar to Incidence and Distribution of Refractive Errors
Similar to Incidence and Distribution of Refractive Errors (20)
Recently uploaded
Recently uploaded (20)
Incidence and Distribution of Refractive Errors
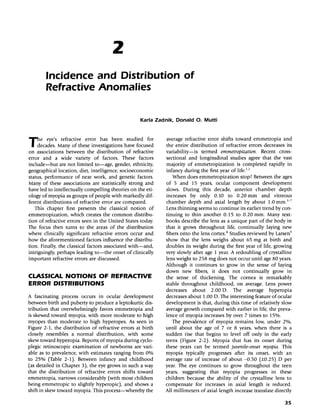
- 1. 2 Incidence and Distribution of Refractive Anomalies Karla Zadnik, Donald O. Mutti The eye's refractive error has been studied for I decades. Many of these investigations have focused on associations between the distribution of refractive error and a wide variety of factors. These factors include-but are not limited to-age, gender, ethnicity, geographical location, diet, intelligence, socioeconomic status, performance of near work, and genetic factors. Many of these associations are statistically strong and have led to intellectually compelling theories on the eti- ology of myopia as groups of people with markedly dif- ferent distributions of refractive error are compared. This chapter first presents the classical notion of emrnetropization, which creates the common distribu- tion of refractive errors seen in the United States today. The focus then turns to the areas of the distribution where clinically significant refractive errors occur and how the aforementioned factors influence the distribu- tion. Finally, the classical factors associated with-and, intriguingly, perhaps leading to-the onset of clinically important refractive errors are discussed. CLASSICAL NOTIONS OF REFRACTIVE ERROR DISTRIBUTIONS A fascinating process occurs in ocular development between birth and puberty to produce a leptokurtic dis- tribution that overwhelmingly favors emmetropia and is skewed toward myopia, with more moderate to high myopes than moderate to high hyperopes. As seen in Figure 2-1, the distribution of refractive errors at birth closely resembles a normal distribution, with some skew toward hyperopia. Reports of myopia during cyclo- plegic retinoscopic examination of newborns are vari- able as to prevalence, with estimates ranging from 0% to 25% (Table 2-1). Between infancy and childhood (as detailed in Chapter 3), the eye grows in such a way that the distribution of refractive errors shifts toward emmetropia, narrows considerably (with most children being emmetropic to slightly hyperopic), and shows a shift in skew toward myopia. This process-whereby the average refractive error shifts toward emmetropia and the entire distribution of refractive errors decreases its variability-is termed emmettopization: Recent cross- sectional and longitudinal studies agree that the vast majority of emmetropization is completed rapidly in infancy during the first year of life.':" When does emmetropization stop? Between the ages of 5 and 15 years, ocular component development slows. During this decade, anterior chamber depth increases by only 0.10 to 0.20 mm and vitreous chamber depth and axial length by about 1.0 mm.':" Lens thinning seems to continue its earlier trend by con- tinuing to thin another 0.15 to 0.20 mm. Many text- books describe the lens as a unique part of the body in that it grows throughout life, continually laying new fibers onto the lens cortex." Studies reviewed by Larsen? show that the lens weighs about 65 mg at birth and doubles its weight during the first year of life, growing very slowly after age 1 year. A redoubling of crystalline lens weight to 258 mg does not occur until age 80 years. Although it continues to grow in the sense of laying down new fibers, it does not continually grow in the sense of thickening. The cornea is remarkably stable throughout childhood, on average. Lens power decreases about 2.00 O. The average hyperopia decreases about 1.00 O. The interesting feature ofocular development is that, during this time of relatively slow average growth compared with earlier in life, the preva- lence of myopia increases by over 7 times to 15%. The prevalence of myopia remains low, under 2%, until about the age of 7 or 8 years, when there is a sudden rise that begins to level off only in the early teens (Figure 2-2). Myopia that has its onset during these years can be termed juvenile-onset myopia. This myopia typically progresses after its onset, with an average rate of increase of about -0.50 (±0.25) 0 per year. The eye continues to grow throughout the teen years, suggesting that myopia progresses in these children because the ability of the crystalline lens to compensate for increases in axial length is reduced. All millimeters of axial length increase translate directly 35
- 2. 36 BENJAMIN Borishs Clinical Refraction TABLE 2-1 Refractive Error in Infancy and Toddlerhood Author N Age Method Coldschrnidr" 356 infants 2-10 days Atropine 0.5% Santonastaso'" 34 infants 0-3 mo Atropine retinoscopy Luyckx" 104 eyes 0-1 wk Cyclopentolate 1% Cook & Glasscock" 1000 eyes After post- Atropine ointment 1% delivery 4x care Mohindra & Held27 48 infants 0-4wk Near retinoscopy Zonis & Miller!" 600 eyes 48-72 hr Mydriaticum Mayer et al.' 32 infants 1 mo Cyclopentolate 1% 42 infants 12mo Mutti et al.' 262 infants 3 mo Cyclopentolate 1% 243 infants 9 mo •Standard deviations arein parentheses. tSee Figure 2-1 for distribution. 45 40 z 35 w a: Cl 30...J I o 25 u, 0 20I- Z w 15o a: w 100.. 5 o Mean Refraction (D) +0.62 (±2.24)* +1.67 (±2.54) +2.4 (±1.2) +1.54t -0.70 (±3.20) +1.10 (±1.60) +2.20 (±1.60) +1.57 (±0.78) +2.13 (±1.31) +1.32 (±1.07) Myopia 24.2% 8.0% 0.0% 25.1% Not given 14.5% 3% Not given s s a e s s s s e s e e e e e e s s ~ ~ ~ ~ ~ ~ 9 0 ~ N M ~ ~ ~ ~ 00 ~ a 5 6 7 8 9 10 11 12 13 14 15 AGE (years) REFRACTIVE ERROR (D) Figure 2-1 Comparison of refractive error distribution among newborns" with that among children."? The distribu- tion of refractive errors narrows and its peak becomes closer to emmetropia between infancy and childhood as the process of emmetropization takes place. (Reprinted from Zadnih K. 1997. The Ocular Examina- tion, p 55. Philadelphia: WB Saunders.) into diopters of myopia. Sorsby et al." found that the average values of components of children 13 to 14 years ofage were not different from those ofyoung adult male recruits 19 to 22 years old. They concluded that the eye does not grow appreciably beyond the age of 13 to 14 years. The age of cessation of the progression of myopia is 14.6 to 15.3 years for girls and 15.0 to 16.7 years for Figure 2-2 Increases in the prevalence of myopia (at least -0.50 D by noncycloplegic retinoscopy) as a function of age. Data are from Blum et al." (Reprinted from Zadnin K. 1997. The Ocular Examination, p 58. Philadelphia: WB Saunders. ) boys, depending on the method of estimation of progression," and it is consistent with the cessation of ocular growth. This age is obviously an average because many patients' myopia progresses well into adulthood. II In addition, many patients, perhaps another 10% of the population, will become myopic for the first time after the teen years. II As noted in Chapter 1, this type of myopia is termed adult-onset myopia. These two forms of myopia bring the total prevalence of myopia in the adult population to about 25%.12 The development of
- 3. Incidence and Distribution of Refractive Anomalies Chapter Z 37 MYOPIA Age Iyr/ -0. t 2 0 or More - t .00 0 or More FACTORS THAT AFFECT REFRACTIVE ERROR DISTRIBUTIONS Reprinted with permission from Myopia: Prevalence and Progression. Copyright 1989 by the NationalAcademy of Sciences. Courtesy of the National Academy Press, Washington, D.C. TABLE 2-2 Effect of Myopia Criterion Definition on Prevalence of Myopia in School-Age Children across studies, as shown in Tables 2-1 and 2-3 through 2-6, and the wide range of reproducibility obtainable with these subjective and objective refraction measure- ment techniques. IS Age Age is the single most important determinant of the distribution of refractive error in a given group (see Chapter 3). The onset and development of myopia occur in well-established yet poorly understood pat- terns. Only a very small proportion of infants are myopic at birth, and much of this neonatal myopia is associated with prematurity. 16 Likewise, babies and tod- dlers exhibit a low prevalence of myopia. I? Even by the time they enter formal schooling at age 6 years, children are generally not myopic. During the ensuing 6 to 8 years, however, low to moderate myopia is first observed and progresses. I 8.19 For juvenile-onset myopia, onset is typically between the ages of 7 and 14 years." the rate of progression is -0.40 (± 0.25) Don average." and the age of cessation is 14 to 15 years for females and 15 to 16 years for males. 10 The prevalence of myopia in older age groups increases 18.22-23 to as high as 25% of the U.S. adult population." Table 2-1 lists major studies of the prevalence and distribution of refractive error in newborns.24 - 28 Overall, it can be seen that the distribution of infant refractive error is centered somewhere in low to moderate hyper- opia with a moderate spread (standard deviations on the order of 1.00 to 2.00 D) and that, not surprisingly, noncycloplegic measures yield distributions with more myopic average values than appear in distributions yielded by cycloplegic measures." Astigmatism in infancy and toddlerhood has been well documented, but its purpose in visual development is still unknown. Table 2-3 presents the results from several large-scale studies of infants' and preschoolers' astigmatism with a variety of measurement techniques and a large range of ages.28 - 3S Overall, astigmatism pres- ents in infancy « 1 year ofage) with anywhere from one- quarter to one-half of infants showing significant astigmatism (>1.00 DC); the story on the orientation of that astigmatism and its changes with age is less clear-cut. Several recent studies suggest that early infant astigma- tism may well be a mix ofboth with-the-rule and against- the-rule.P:" With time, the prevalence of astigmatism decreases toward that seen in school-aged children. There is a general against-the-rule shift with time making early with-the-rule astigmatism resolve more often and early against-the-rule astigmatism the more persistent orienta- tion. 1,2,16 With respect to the origin ofinfant astigmatism, one group has reported that infant astigmatism up to age 1 year is primarily corneal in origin." but another has reported that the astigmatism prevalent in infancy disap- pears by age 18 months, consistent with the time course 0.6% 1.0% 2.0% 4.5% 5.4% 6.8% 10.4% 16.7% 21.2% 24.0% <5-6 7-8 9-10 11-12 13-14 One of the difficulties in characterizing refractive error distributions across many associated factors is the effect of the criterion used to define the various refractive error distributions. In Table 2-2, the Working Group on Myopia Prevalence and Progression11 demonstrated the marked effect of a criterion change on the prevalence of myopia in a school-age, population-based sample." The prevalence of myopia changes by an order of magnitude if the operational definition of myopia is altered from "any minus refraction" to a clinically important "-1.00 D or more myopia." Other important factors are the variety of methods used to measure refractive error ametropia and its progression throughout the human lifespan are detailed in Chapter 3. Sorsby et al." attempted to categorize myopia on the basis of values of and associations between the ocular components. They examined the range of axial lengths in ernmetropes. finding that eyes anywhere from 21.0 to 26.0 mm in length could be emmetropic. Emmetropia was not the product of having the correct axial length but rather of having the right match between axial length and primarily-according to Sorsby et al.- corneal power. For ametropias up to ± 4.00 D, the cause was not an incorrect axial length, but rather a mismatch with corneal power they called correlation ametropia. Errors greater than ±4.00 D were called component ametropia, being primarily due to excessive axial length; the corneas of these patients fell within a range similar to that of emmetropes. A third classification, for myopia typically greater than -6.00 D and accompanied by degenerative fundus changes, was termed pathological myopia.
- 4. 38 BEN.lAMIN Borishs Clinical Refraction TABLE 2-3 Astigmatism in Infancy and Toddlerhood Cycloplegic Prevalence of Author N AgenVMethod Age Astigmatism Orientation Ingram & 296 eyes Atropine/retinoscopy 1yr 29.7% (>1.00 DC) Not given Ba~4 3.5 yr 7.8% (>1.00 DC) Not given Fulton et al." 145 children Cyclopentolate 1%/ 40-50wk 23.5% (;:: 21.00 DC) 71% ATR retinoscopy 1-2 yr 16% (;:: 1.00 DC) (for children 2-3 yr 14% (;:: 1.00 DC) 0-3 yr 21%WfR 8% Oblique Dobson et al." 46 infants Cyclopentolate 1%/ <6mo 17% (;:: 1.00 DC) 100%ATR 187 infants retinoscopy 1yr 19% (~ 1.00 DC) 70% ATR (midpoint) 18% ATR 2% Oblique Howland et al." 93 infants No cycloplegia/ 0-12 mo 86% ~ 1.00 DC 70% "Horizontal photorefraction and vertical" Gwiazda et al.31 521 infants No cycloplegia/ 0-12 mo 53% ~ 1.00 DC 41% ATR near retinoscopy 41%WfR 18% Oblique Howland & 117 infants No cycloplegia/ 0-12 mo 63% 55% ATR Sayles" photorefraetion 3%WfR 42% Oblique Mohindra et al." 276 infants No cycloplegia/near 0-12 mo 45% 40% ATR retinoscopy 40%WfR 20% Oblique Santonastaso" 34 infants under Atropine/ 0-12 mo 52.4% ;:: 1.00 DC 15%ATR 3 mo of age retinoscopy 85%WfR Ehrlich et al.36 254 infants Cyclopentolate 1%/ 9mo 35%;:: 1.00 DC 17% ATR retinoscopy 81% WfR 20mo 13% ~ 1.00 DC 36%ATR 58%WfR Mayer et al.' 43 infants Cyclopentolate 1%/ 4mo 49%;:: 1.00 DC 56%ATR 33 infants retinoscopy 48mo 12% ~ 1.00 DC 29%WfR across age groups Mutti et al.2 262 infants Cyclopentolate 1%/ 3mo 42%;:: 1.00 DC 6%ATR retinoscopy 89%WfR 36mo 4% ~ 1.00 DC 78% ATR 22%WfR ATR, Against the rule; WTR, with the rule.
- 5. Incidence and Distribution of Refractive Anomalies TABLE 2-4 Mean Refractive Error in Childhood Chapter 2 39 Author N Cyc/opegic Agent/Method Age Mean Refraction '01 Ingram & Barr" 296 eyes Atropine/retinoscopy lyr +0.62 (±1.11)a 3.5 yr +0.95 (±1.11) Mohindra & Held:" 39 children No cycloplegia/near 65-128 wk 0.43 (±1.32) retinoscopy 129-256 wk 0.59 (±0.85) Blum et al." 1163 children No cycloplegia/ 5-15 yr Slow decline from mean of retinoscopy +0.62 at age 5 to +0.12 at age 15 Hirsch" 9552 children No cycloplegia/ 5-14 yr Slow decline from mean of retinoscopy +0.80 at age 5 to +0.35 at age 14 Zadnik et al.7 133 children Tropicamide/ 6yr +0.73 (±0.87) 143 children autorefraction 8yr +0.37 (±0.89) 129 children 11yr +0.30 (±1.34) 'Standard deviations are in parentheses. TABLE 2-5 Prevalence of Refractive Errors in White Children Cyc/opegic Prevalence of Prevalence Author N Agent/Method Age 'yrl Hyperopia of Myopia Laatikainen & Erkkila" 162 children Cyclopentolate 1%/ 7-8 19.1% 1.9% 218 children retinoscopy 9-10 6.9% 6.4% 222 children 11-12 11.7% 7.2% 220 children 14-15 3.6% 21.8% Sperduto et al.12 NA No cycloplegia/health 12-17 Not measured 23.9% survey review Blum et al." 1163 children No cycloplegia/ 5 6% for all ages 2% retinoscopy 6 2.25% 7 2.5% 8 4% 9 5.5% 10 8% 11 10.5% 12 12.25% 13 13.25% 14 14.5% 15 15% Hirsch'? 605 children No cycloplegia/ 13-14 11.4% 15.2% retinoscopy Kempf et al." 333 children Homatropine/ 6-8 35.4% 1.2% 495 children retinoscopy 9-11 25.2% 3.4% 1001 children ~12 15.2% 4.8% Laatikainen and Erkkila defined hyperopia as ~ +2.00 D and myopia as :0;-0.50 D; Sperduto et al. defined myopia as :0;-0.00 D; Blum et ai. defined hyperopia as ~+1.50 D and myopia as :0;-0.50 D; Hirsch defined hyperopia as >+1.00 D and myopia as <-0.50 D; Kempfet al. defined hyperopia as >+1.00D and myopia as :0;-0.75 D.
- 6. 40 BEN.JAMIN Borishs Clinical Refraction TABLE 2-6 Astigmatism in Childhood Cyclopegic Author N Agent/Method Age (yrJ Astigmatism ORIENTATION Fabian" 1200 children Cyclopentolate/ 2 ;::: 1.00 DC = 1.6% WTR retinoscopy ;:::1.00 DC =0.7% ATR Hirsch" 333 eyes No cycloplegia/ 5.5 0.75-1.24 DC =2.4% WTR retinoscopy 0.75-1.24 DC =0.0% ATR ;:::1.25 DC =1.8% WTR ;:::1.25 DC =0.0% ATR 8.5 0.75-1.24 DC =2.7% WTR 0.75-1.24 DC =0.6% ATR ;::: 1.25 DC =2.7% WTR ;::: 1.25 DC =0.0% ATR 10.5 0.75-1.24 DC =2.4% WTR 0.75-1.24 DC =0.6% ATR ;::: 1.25 DC =2.7% WTR ;::: 1.25 DC =0.0% ATR 12.5 0.75-1.24 DC =3.0% WTR 0.75-1.24 DC =0.3% ATR ;::: 1.25 DC =3.0% WTR ;::: 1.25 DC =0.0% ATR Dobson et al.29 98 children Cyclopentolate 1%/ 2 11%;::: 1.00 DC 35% ATR 97 children retinoscopy 3 32%;::: 1.00 DC 55% ATR 105 children 4 37%;::: 1.00 DC 10-30% ATR 108 children 5 50%;::: 1.00 DC 50-60% WTR 87 children 6 41%;::: 1.00 DC 15-30% 93 children 7 45%;::: 1.00 DC Oblique age 4 90 children 8 18%;::: 1.00 DC and older 68 children 9 13%;::: 1.00 DC Howland & 61 children No cycloplegia/ 1.5 42%;::: 1.00 DC 50-78% ATR for Sayles" 29 children photorefraetion 2.5 20%;::: 1.00 DC all ages 60 children 3.5 10%;::: 1.00 DC <10% WTR 70 children 4.5 12%;::: 1.00 DC 10-50% oblique Gwiazda et a1.3 ! 63 children No cycloplegia/ 1-2 43%;::: 1.00 DC 55-65% ATR up 86 children near retinoscopy 2-3 30%;::: 1.00 DC to age 4.5 137 children 3-4 22%;::: 1.00 DC 20-40% ATR and 140 children 4-5 18%;::: 1.00 DC 60-80% 53 children 5-6 24%;::: 1.00 DC WTR after age 4.5 Zadnik et al." 231 children Tropicamide 1%/ 6-12 8.6% ;::: 1.00 DC 30% ATR autorefraction 50% WTR 20% oblique WTR With the rule; ATR against the rule. for corneal development.":" A recent, detailed study of ocular components and infant astigmatism found that infant astigmatism was the combination of predomi- nantly with-the-rule corneal toricity and against-the-rule lenticular toricity. The reduction in the prevalence of astigmatism over time appeared to be due to the decreases in toricity of the cornea and anterior lens surface, and the reduction in the variance in toricity ofthe cornea and both lenticular surfaces.2 Table 2-4 shows results of studies on older children, ranging in age from 1 to 15 years.7 , ! H,27, 14.1 <J IIere, the process of emmetropization and the development of juvenile-onset myopia are evident. The mean refractive error shifts from hyperopic to near emmetropic, as a result of both emmetropization and the increasing number of myopes with age. The effect of race and ethnic background on the distribution of refractive error is discussed below. Table
- 7. Incidence and Distribution of Refractive Anomalies Chapter 2 41 Reprinted with permission from Myopia: Prevalence and Progression, Copyright 1989 bythe National Academyof Sciences, Courtesy of the National AcademyPress, Washington, D.C TABLE 2-7 Prevalence of Myopia in Modern Young Adult Samples, Either Population- or Academia-Based 2-5 shows the distribution of refractive error by age of school-age children.7,ll,18,21,39Ao These results again document the decreasing prevalence of hyperopia and concomitant increasing prevalence of myopia with increasing school age. The prevalence of astigmatism in school-age children is presented in Table 2_6.29.11,32,41-43 The prevalence of clinically significant astigmatism decreases with increas- ing school age by all measurement methods. During the high school years, refractive error is thought to be stable. Little eye growth appears to occur during these years, and myopes stay myopes, hyperopes stay hyperopes, and emmetropes remain emmetropes, with little change in degree of refractive error within an individual in a given category.":" However, the phenom- enon of adult-onset myopia is well documented." The modern literature on the prevalence ofmyopia in general population samples and academia-based samples is summarized in Table 2-7,4S-47 as reported by the Working Group on Myopia Prevalence and Progression. I These samples reflect the high prevalence seen in some college- age populations; some of these myopes reflect actual adult-onset myopia, whereas others represent adult pro- gression of existing myopia from school-age onset. The Working Group on Myopia Prevalence and Pro- gression I carefully analyzed secular trends in the preva- lence of myopia in college-based samples. They could document no difference between the prevalence of myopia in the early 20s as tallied in 1920 to 193048-50 and the modern National Health and Nutrition Exami- nation Survey (NHANES) data, despite the increased percentage of the general population enrolled in college in the 1980s. The association with education or near work found in many studies of adult myopes":" and the implication that excessive near work somehow causes myopia are discussed later. The Beaver Dam Eye Study Nakamura" Sutton & Ditmars" Cmelin'" Myopia 20% of Caucasians 30% of Nisei 45% at entrance 60% at graduation 51% at entrance 67% at graduation Type of Sample Military recruits West Point cadets West Point cadets Study'S documented a decrease in the prevalence of myopia in older age groups, similar to that found in Eskimo samples years age." but whether this reflects a true secular trend, the effect of increasing near work, the effect of a Westernized diet (in the case of the Eskimos) or a change in diet (in Beaver Dam, Wisconsin), some selective mortality of aged myopes, or a multitude of other factors is difficult to determine. Gender The trends in refractive error distribution seen with gender, as opposed to age, are not as well defined and may in fact be confounded by age. A large sample of children from the United Kingdom yielded no signifi- cant differences in refractive error between boys and girls." In other studies, the trend has gone both ways, and it is therefore probably inconclusive. Hirsch" found a more myopic mean refraction in boys than in girls among 5- to 6-year-olds but more myopia among girls by age 14 years, and Alsbirk" reported a similar trend in adults. These results are also sensitive to the opera- tional definition of myopia as described in Table 2-2. Myopia is more prevalent in Danish school-age girls than in Danish boys of all ages." but both myopia and hyperopia are more prevalent in Finnish schoolchildren than in Goldschmidt's Danes." Both groups of investi- gators questioned the influence of puberty and earlier maturation typically found in girls. Further, it is possi- ble that all the above results favoring females are due to their greater participation in studies of this type.I Ethnicity Contemporary data supporting the general clinical impression that the prevalence of myopia differs with race are relatively sparse (Table 2-8). Few studies have simultaneously compared different races, and it is prob- lematic at best to compare data across races in different geographic areas, different cultures, and samples with different socioeconomic and educational bases. The best estimate comes from the NHANES data reported by Sperduto et al.,12 but no prevalence rates for races other than white and African-American are reported. Across all age groups, the prevalence of myopia in whites (26%) was twice that in African-Americans (13%) in the NHANES survey. That difference was the most marked among 18- to 24-year-olds (differing by a factor of 3 times) and least evident among 45- to 54- year-olds (a difference of only 1.5 times). The claim that there is a high prevalence of myopia among Asians is difficult to document. Oft-cited high prevalence rates among Singapore medical students'? parallel those of British biornicroscopists" and American optometry students,62 both predominantly white samples. Given the association between myopia and intelligence, higher educational level certainly inflates the prevalence of myopia in these samples."
- 8. 42 BEN.lAMIN Borishs Clinical Refraction - TABLE 2-8 Literature-Based Prevalences of Myopia by Ethnic Category Race/Ethnicity African-American Caucasian (white) Caucasian (white) Caucasian (white) Caucasian (white) Asian Hispanic Asian Hispanic African-American Asian Asian Caucasian (white) Asian Caucasian (white) Asian African-American Hispanic Source NHANES12 NHANESI2 Beaver Dam Eye Study" Fledelius" Hawaii!" Hawaii!" Hawaii't" Oakland, California, public schools'" Oakland, California, public schools!" Oakland, California, public schools!" Hong Kong schools" Taiwan schools!" OLSM OLSM CLEERE!83 CLEEREI83 CLEEREI83 CLEEREI83 Age 12-54 yr 12-54 yr 43-84 yr 16-66+yr Schoolchildren 5-18 yr Schoolchildren 5-18 yr Schoolchildren 5-18 yr Sixth-grade schoolchildren Sixth-grade schoolchildren Sixth-grade schoolchildren Schoolchildren 6-17 yr Schoolchildren 6-12 yr Schoolchildren 6-14 yr Schoolchildren 6-14 yr Schoolchildren 5-17 yr Schoolchildren 5-17 yr Schoolchildren 5-17 yr Schoolchildren 5-17 yr Prevalence of Sample 13.0% 26.3% 26.2% 30.0% 7.0% 13.0% 5.0% 13.7% 9.1% 5.1% 55.0% 17.6% 8.8% 27.3% 4.4% 18.5% 6.6% 13.2% NHANES, National Health and Nutrition Examination Survey; OLSM, Orinda Longitudinal Study of Myopia; CLEERE, Collaborative Longitudinal Evaluation of Ethnicityand Refractive Error. The larger population-based studies and assessments of school-age children listed in Table 2-8 indicate a general pattern in which the prevalence of myopia is highest in Asian, intermediate in white, and lowest in African-American schoolchildren. Table 2-9 presents similar comparisons of college-age students. Regardless of the person's racial background, when myopia does occur it is presumably due primarily to excessive axial length. There is no evidence to support the idea that myopia in some ethnic groups is caused by steep corneas or high-powered crystalline lenses. Component studies of Asian schoolchildren demonstrate that their myopia is due to excessive axial length, as it is in white children." Rigorous ocular component measure- ment in samples with a great deal of ethnic variation is rare; the Orinda Longitudinal Study of Myopia (OLSM) suffers from this limitation, too.' However, there is intriguing evidence that children from a group with a low prevalence of myopia show different ocular com- ponent profiles than do those with a higher preva- lence.":" Specifically, Melanesian children ages 6 to 19 years had a prevalence of myopia of 2.9%,65 whereas Malaysian children appeared similar to U.S. samples." with a prevalence of myopia of 4.3% at 7 to 8 years and 25.6% by 15 to 16 years." Cross-sectional differences between 6- and 17-year- old Melanesian and Malaysian children were com- pared." The Melanesian children on average had no TABLE 2-9 Literature-Based Prevalences of Myopia in College-Age Samples by Ethnic Category Prevalence Ethnicity Source Age lyrJ of Myopia Chinese (in Au Eong 17-18 48.5% Singapore) et al.!B4 Eurasian (in Au Eong 17-18 34.7% Singapore) et al.184 Indian (in Au Eong 17-18 30.4% Singapore) et al.IB4 Malay (in Au Eong 17-18 24.5% Singapore) et al.!84 Israeli Rosner & 17-19 15.8% Belkin" British Sorsby 18-22 11.0% et al.!85 Swedish Coldschrnidt" 18-22 14.5% change in lens thickness but substantial decreases in lens power (3.50 D) during the time the eye increased in length by 1 mm and the prevalence of myopia increased to 8%. In contrast, Malaysian children under- went substantial lens thinning (0.33 mm) and smaller
- 9. Incidence and Distribution of Refractive Anomalies Chapter Z 43 decreases in lens power (2.40 D) during a similar l-rnm increase in axial length that resulted in a prevalence of myopia of 28%. The lack of difference in axial growth suggests that the crystalline lens of the Malaysian children was primarily responsible for the increased myopia. It appeared that the lens was less efficient in compensating for ocular growth, decreasing fewer diopters per unit change in axial length. This lens-based model parallels that obtained from the predominantly white sample in the OLSM, suggesting that a slower growth rate for the Malaysian lens or a less responsive refractive index profile may be a risk factor for the onset of myopia. Unfortunately, the Malaysian study did not collect complete ocular component data (e.g., lens cur- vatures from phakometry) or longitudinal data. Geography Geographical differences in myopia prevalence can be seen in Table 2-10, although differences among studies with regard to sampling and confounding by other factors such as diet, education, and time spent reading are difficult to sort out from true differences based on geography. Certainly, no clear geographical differences emerge beyond those identified in the preceding section on racial differences in myopia prevalence in the United States. Diet Table 2-11 shows some of the various dietary insuffi- ciencies that have been associated with myopia. Gar- diner" conducted a nonrandomized clinical trial of the effect of animal protein supplement on the progression of myopia in children. The treated group either altered diet or took protein supplements to make 10% of the intake of calories come from animal protein. The control group followed their regular, unmonitored diet. At one year, the treated group showed less myopic progression (by -0.25 to -0.500 per year) compared with the control group. The effect of dietary protein on myopic progression displayed some dose-response effect, in that myopic progression was less in those who achieved the highest levels of intake of animal protein. Unfortunately, this trial was not randomized. The treated children were studied at the hospital clinic by their parents, whereas the control children were seen at their school clinic. Without randomization, unknown sources of bias-factors related to myopia but unrelated to the treatment-may create differences between treated and control children and give false results. For example, differences in family income, parents' educa- tional level, or whether one or both parents were myopic could create differences in myopic progression unrelated to protein intake. Interestingly, the treated children differed from controls in refractive error, but they were initially more myopic rather than less. Edwards et al." examined the nutrition and diet of 102 7-year-old Hong Kong children. Compared with children who did not become myopic, 34 children who were myopic by age 10 years had a lower intake of several items, including: protein; fat; vitamins BI, B2, and C; phosphorus; iron; and cholesterol. None of these children were malnourished. Malnourishment appears to be associated with a lower amount of hyperopia in infancy, perhaps because of some effect it might have on the crystalline Iens'" or because it slows ocular growth. The smaller eyes of premature infants are not associated with high hyperopia but rather with myopic or less hyperopic refractive errors.P'" Some investigators have proposed that proper calcium metabolism is important to maintenance of scleral rigidity and resistance to any expansive effects of intraocular pressure (lOP). Lane" found that myopes had a higher concentration of calcium in hair samples than do emmetropes or hyperopes. Lane somewhat arbitrarily took this as evidence that calcium was being depleted from the body into the hair. Calcium supple- TABLE 2-10 Literature-Based Prevalences of Myopia by Geographical location Location/Ethnicity Israel/Jewish Israel/Jewish Nigeria/Black United States/Native American Australia/Aborigines Australia/European origin Alaska/Eskimo Source Hyrnans et al.186 Shapiro et al.187 Abiose et al.188 Wick & Cranc'" Taylor!" Taylor'?" van Rens & Arkell'" Age Iyr) >40 University students 18-25 12-20 6-10 20-30 20-30 5-80+ Prevalence of Myopia 11.6% 13.0% <2.0% 13.0% 4.8% 13.5% 44.7% Hymans et al. defined myopia as >-1.00 DS; Shapiro et al. and Wick & Crane defined myopia as ?-O.25 DS in at least one eye; Abiose et al. did not define myopia criterion. Taylordefined myopia as >-0.75 DS; van Rem & Arkell did not define myopia criterion,
- 10. 44 BENJAMIN Borishs Clinical Refraction Study Dietary Problem Time TABLE 2-11 Dietary Problems Associated with Myopia Study mentation appeared to have little effect on slowing myopia progression in a case series reported by Feldman." Blood levels of total, bound, and ionic calcium were not appreciably different between myopes and hyperopes. Until the multitude ofconfounding factors that influ- ence diet and refractive error is untangled, the precise role of nutrition in the etiology of myopia will remain unclear. Demonstrating that alteration of diet can affect the onset or progression of myopia will require a formal, randomized clinical trial potentially fraught with ethical dilemma. TABLE 2-12 Secular Trends in Prevalence of Juvenile Onset Myopia Age Iyrj Study 2:-1.00 OS Myopia 6 Kempfet al.40 Blum et al." 2.0% 7 Kempf et al." 1.2% Blum et al." 3.0% 8 Hirsch!' 0.9% Blum et al." 3.5% 9 Hirsch!" 1.9% Blum et al." 5.5% 10 Kempf et al." 2.4% Blum et al." 7.5% 11 Hirsch!' 4.4% Blum et al." 10.5% 12 Blum et al." 12.0% 13.0 Kempf et al." 3.9% Blum et al." 13.0% 14 Hirsch'? 5.4% Blum et al." 14.5% changes in the ocular components related to aging, sam- pling bias, or some other effect or association. Systemic Conditions Numerous systemic disorders have an effect on the development of the eye and therefore affect its refractive state. A more complete discussion of the following con- ditions has been provided by Curtin." Albinism is the inability to produce the pigment melanin, resulting in a lack of pigmentation of the hair, skin, and eyes. The prevalence ofthe general form ofalbinism is 1 in 10,000. In both the generalized and ocular forms, albinism has been associated with myopia and high astigmatism. Down syndrome, or trisomy of chromosome 21, results in myopia in about one third of affected individuals. Its prevalence is estimated to be between 2 and 34 in 10,000. Several connective tissue and skeletal disorders, such as Marfan's syndrome, Ehlers-Danlos syndrome, and Stickler's syndrome, are also associated with myopia. Maumenee'" has characterized the refractive Personality The conventional wisdom on associations between per- sonality traits and refractive error is that myopia is asso- ciated with introversion." Further, myopes have been shown to exhibit an inhibited disposition, a disinclina- tion for motor activity and social leadership, whereas hyperopes are carefree, impulsive, hyperactive, and socially passive." These associations are statistically weak, however.":" Less animal protein Less protein, fat, vitamins, iron, and cholesterol African tribe after 2 years of famine Calcium Calcium, chromium Japanese children with exposure to organophosphorus panicles Halasa & Mcl.aren'" Cardiner'" Edwards et al." Feldman" Lane" Tamura & Mitsui191 If analyzing the foregoing factors' influences on refrac- tive error distributions is difficult, determining whether secular trends have occurred in the distribution of refractive error across the last century is nearly impossi- ble. Researchers working in different decades used different measurement methods and different criteria for defining the types of refractive error. Different age groups cannot be directly compared. Comparisons among groups of different ethnic origins and from dif- ferent parts of the world do not lead to conclusions. Nevertheless, Table 2-12 presents an attempt to sort out these relationships.II In a study designed to determine whether the preva- lence of myopia might be increasing, Fledelius" looked at a Danish hospital-based sample and found the same trend toward decreasing prevalence of myopia with increasing age into the elderly range that was found in the Beaver Dam Eye Study in Wisconsin" and the oft-cited study of Alaskan Eskimos." It is still unknown whether these trends reflect true increases in the preva- lence of myopia in recent decades (argued against by the juvenile-onset data across decades in Table 2-12),
- 11. Incidence and Distribution of Refractive Anomalies Chapter 2 45 error and the facial, somatic, sensory, and ocular charac- teristics of other, rarer connective tissue disorders. Most result in myopia, but two (Jansen's syndrome and spondyloepiphyseal dysplasia) may result in hyperopia. Laurence-Moon/Bardet-Biedl syndromes are character- ized by a retinal pigment degeneration and general somatic abnormalities such as polydactyly and mental retardation. Refractiveerrors are rarely emmetropic, with nearly equal numbers of myopes and hyperopes." Homocystinuria, an error of metabolism, is character- ized by excretion of homocystine in the urine and excesses of homocystine and methionine in the blood." The effect on the body is the production of fair hair and skin and mental retardation. The major ocular findings are lens dislocation and myopia in a high proportion of affected individuals (90% for each), and light irides (70%), hypotony (33%), retinal elevation (25%), and cataract (20%). Numerous severe developmental disor- ders were also listed by Curtin" as associated with myopia as the common refractive error: Pierre Robin syndrome, syringomyelia, Turner's syndrome, Noonan's syndrome, and De Lange's syndrome. More recent reports have noted that myopia may be an associated finding in hantavirus infection. A multi- hospital study followed 62 serologically proven cases during 1992 and 1993, and acute myopia was found in 24% of patients." Systemic lupus erythematosus has also been related to myopia in two case reports, pre- sumably because of changes in lenticular curvature and anterior displacement associated with ocular edema.":" Dental caries is a common systemic condition with low morbidity that has been associated with myopia in past literature but has not been found to be a significant risk factor for myopia in subsequent studies. Hirsch and Levin" found an association between myopia and dental caries, as well as between the amount of myopia and the number of decayed teeth in 155 college-age stu- dents. No such relationship was found in a sample of 196 high school students by Keller" or in a sample of 102 Hong Kong children at age 9 years by Edwards and Chan." Fledelius" noted an increase in the prevalence of myopia among patients with diabetes in a cross- sectional study of 1416 patients referred for general eye examinations. Among diabetic patients, 10.2% had refractive errors between -1.00 and -1.75 D, compared with 6.2% of nondiabetics. Myopia of -2.00 D or less was found in 12.3% of persons with diabetes and 9.9% of persons without diabetes. Ocular Diseases It is clear from both animal and human data that clear visual input is necessary for normal emmetropization to occur. Rabin et al.89 reported on 80 subjects with binoc- ular and monocular disruptions of normal vision from sources such as cataract, retrolental fibroplasia, and ptosis. The distribution of refractive errors of these groups was shifted toward more myopia or less hyper- opia compared with patients who experienced normal development. Numerous conditions that interfere with normal vision have been reported to affect refractive error through the induction of a deprivation-like myopia. These include corneal opacification." eyelid closure," vitreous hemorrhage." and congenital cataract." Astigmatic and myopic spherical equivalent refractive errors have been reported in connection with hemangioma." Astigmatism is also reported to increase after the surgical correction of congenital ptosis." In addition, Nathan et al." analyzed the refractive error distribution of 433 pediatric patients with low vision. In contrast to the foregoing diagnoses, which interfere with normal vision through media opacity, this pediatric population suffered from retinal and neuro- logical disease. All diseases disrupted emmetropization in that the variation in refractive error was quite high. The majority of diseases were associated with myopia, including aniridia, cerebral palsy, coloboma, glaucoma, nystagmus, optic atrophy, optic nerve hypoplasia, retinitis pigmentosa, retinopathies, retinopathy of prematurity, and toxoplasmosis. Myopigenic conditions appeared to involve predominantly peripheral visual impairment. Only three diagnoses were associated with hyperopia (albinism, maculopathies, and rod mono- chromacy). These primarily involved foveal develop- ment. The magnitude and variability of the refractive errors were more severe with earlier age of onset of the impairment. A host of hereditary abnormalities with an effect on visual acuity, ocular development, and therefore refractive error were catalogued by Curtin." Conditions associated with hyperopia include achromatopsia, nys- tagmus, and microphthalmia. Conditions associated with myopia include achromatopsia, nystagmus, microcornea, keratoconus, Fabry's disease (corneal and lenticular accumulation of glycosphingolipid), microphakia, ectopia lentis, coloboma, choroiderernia, gyrate atrophy, fundus flavimaculatus, retinitis pigmen- tosa, progressive bifocal chorioretinal atrophy, extensive myelination of nerve fibers, and rarer familial diseases such as Wagner's disease (membranous vitreous, arterial sheathing, choroidal sclerosis, and cataract), familial exudative vitreoretinopathy, and familial external ophthalmoplegia." Glaucoma may be connected to myopic refractive error in two ways. First, as part of the near-work theory of the etiology of myopia, prolonged reading may increase intraocular pressure (lOP), driving the expan- sion of the eye by mechanical force.":" Second, glau- coma and myopic refractive errors may be associated conditions. Genetic links have been proposed on the basis of the shared higher prevalence of positive steroid
- 12. 46 BEN.lAMIN Bortstrs Clinical Refraction response among myopes and glaucoma patients.'?" Ele- vated lOP has been associated with refractive error in nonglaucomatous eyes in several studies, 100-103 with dif- ferences on the order of 1 to 2 mmHg. Other studies have indicated no such association, however.l04-106 The risk of ocular hypertension appears to be higher in myopes than in ernrnetropes.?" as is the risk of open- angle glaucoma and conversion to glaucoma from ocular hypertensive status.'?" Conversely, Daubs and Crick'?" found that, although myopia was a risk factor for glaucomatous field loss, there was no association between ocular tension and refractive error status. The small size of their sample of ocular hypertensives may have limited their statistical power, however. The two largest studies are by David et al. and Bengtsson.Pv'" David et al. studied 2403 subjects over the age of 40 who accepted an invitation to participate in a glaucoma screening and found a slightly higher lOP on average in myopes. Bengtsson's sample was more population based, consisting of 88.8% of the total pop- ulation of 1917 people over the age of 8 years living in a particular village. Although this was arguably the better sample with respect to age range and generaliz- ability, no association between lOP and refractive error was reported by Bengtsson. Besides keratoconus, other corneal conditions may affect refractive error because of the alterations in corneal curvature they create. Phlyctenular keratitis has been reported to cause myopic changes." Pellucid mar- ginal degeneration thins the inferior cornea and flattens the vertical corneal meridian, resulting in high amounts of against-the-rule astigmatism.109 Alterations of the refractive properties of the crystalline lens may also affect refractive error. Posterior polar and nuclear cataract tend to produce myopic changes.!" and age- related changes in the gradient index profile of the crys- talline lens tend to result in hyperopic shifts. III A change in the elevation of the photoreceptor plane as a result of retinal pathology may also have an effect on refractive error and visual acuity. The classic example is central serous chorioretinopathy, in which the sensory retina is moved anteriorly by the accumulation of fluid underneath it, with a concomitant increase in hyperopia or decrease in myopia.!" High myopia, also termed pathological myopia, may have an adverse effect on the retina, because the extremely large eye size stretches and places tension on the retina. A thorough funduscopic evaluation of the central and peripheral retina is required when examining the highly myopic patient. A study of 513 eyes that were at least 24 mm in axial length showed that lattice degeneration, pavingstone degeneration, white with or without pressure, and retinal holes and tears were all significantly associated with a longer axial length.II 3 Examination of 308 post- mortem eyes with high myopia collected over a 67-year period showed the following prevalences for retinal findings associated with myopia: myopic configuration of the optic nerve head, 37.7%; posterior staphyloma, 35.4%; degenerative changes of the vitreous, 35.1%; cobblestone degeneration, 14.3%; myopic degeneration of the retina, 11.4%; retinal detachment, 11.4%; retinal pits, holes, or tears, 8.1%; subretinal neovascularization, 5.2%; lattice degeneration, 4.9%; Fuchs spot, 3.2%; and lacquer cracks, 0.6%.114 FACTORS ASSOCIATED WITH REFRACTIVE ERROR Heredity Genetic factors also playa significant role in the inci- dence of myopia. Coldschmidt" provided an extensive review of this literature. A recent study demonstrated similarities between siblings that were not observed between parent and offspring, due to the interaction of dominant genes, the visual environment, or a combi- nation of the two.!" Less has been written about the heritability of component characteristics of myopia, though Alsbirk" found an apparently lower heritability for refractive error than for axial length, anterior chamber depth, or corneal curvature. Previous studies on the familial patterns of ocular component and refractive error development differ on how large a role genetics plays in myopia and whether the role of heredity differs for classical juvenile-onset myopia and high myopia.':' Large-scale pedigree studies attempting to identify the specific mode of inheritance have been few and far between and vary widely in the proposed mode of inheritance. 116,117 Studies of the heritability of refractive error and the ocular components consist of two types: those based on correlations between parents and children and those based on monozygotic and dizygotic twin comparisons. Generally, in studies of parents and offspring, higher heritabilities have been found for axial length and corneal power than for the other ocular components or for refractive error.58.11S-120 In studies of twins, the heritabilities for corneal power, axial length, and refractive error have all been high and approximately equar,nS,121,122 and the differences in refractive error and the ocular components have been smaller for monozy- gotic than for dizygotic twins.123-125 Monozygotic twins resemble each other more closely than dizygotic twins. Sorsby et al.124 measured refrac- tion, corneal curvature, anterior chamber depth, lens power and thickness, and axial length in 78 monozy- gotic twin pairs, 40 pairs of dizygotic same-sex twins, and 48 unrelated pairs. The unrelated pairs were included for comparison because they shared neither genes nor the effects of a common familial environ- ment. Zygosity was determined on the similarity of
- 13. Incidence and Distribution of Refractive Anomalies Chapter Z 47 physical appearance, fingerprints, tasting of phenylth- iourea (if one twin could taste it and the other could not, the twins were considered dizygotic), and blood type. Monozygotic twins were within ± 1.25 D of each other 90% ofthe time. Only 55% of dizygotic twins and 52% of unrelated pairs were within ± 1.25 D. Monozy- gotic twins were within ± 1.650 of each other 95% of the time. Only 62% ofdizygotic twins and 60% ofunre- lated pairs were within ± 1.65 D. The analysis for refrac- tion and the other ocular components is summarized in Table 2-13. Teikari et al.126 reported on similarities between refractions in 6314 pairs of twins from the Finnish Twin Cohort Study. Correlations in liability for refractive error between monozygotic twins were 0.81 compared to 0.30 to 0.40 for dizygotic twins. From these data, Teikari et al. obtained an estimate of heritability, or the proportion of variability in refractive error that can be accounted for by variability in genetics. Heritabilities were 0.82 for males and 1.02 for females. A recent estimate of heritability from 506 female twin pairs in the United Kingdom also found high heritabilities for refractive error across the spectrum of myopia to hyper- opia, 0.84 to 0.86 due to additive genetic effects.!" The preliminary results from the first 3 years of the OLSM show that the addition of near work to a parental history of myopia model for predicting refractive error marginally improved the model's predictive ability. Interestingly, the addition of near work did not improve the model's predictive ability for the ocular compo- nents. On the other hand, models that begin with near work that attempt to predict refractive error and the optical ocular components are almost all improved by the addition of parental refractive error history infor- mation. These results lend credence to a nature model with a modest nurture component.':" With this genetic etiology in mind, several studies have linked at least the pathological form of myopia to several loci. Bornholm eye disease, an X-linked form of myopia characterized by myopia of more than -6.00 0, deuteranopia, and moderate optic nerve hypoplasia, was reported to be linked to the distal part of the X chromosome at Xq28. 129 Knobloch syndrome, which includes severe myopia and encephalocele, has been mapped to 21q22. 130 Other recent molecular genetic studies of families with two or more individuals with -5.500 or more of myopia have found significant linkage with regions on chromosomes 18pll.31,131 12q21-23 Young et al.,132 17q21-22,133 and 7q36.134 These varied loci suggest substantial heterogeneity in the transmission of pathological myopia. These loci have not been associated with lower amounts of more common myopia.P'''!" Lower amounts of myopia have been linked recently to regions on chromosome 22q12 in Ashkenazi Jewish families':" and llp13 in the region of the PAX6 gene in twin pairs in the United Kingdom. 138 Near Work Human Near-work Theories and Evidence A body of work on the nurture theory of myopia devel- opment indicts excessive reading during childhood as the cause ofabnormal eye growth.11,139 Examples include an increased prevalence of myopia among the first school-educated Eskimos": a decreased prevalence of myopia during World War II in Iapan": the association between myopia, intelligence, and near work'"?': and the observation of adult-onset myopia in college popu- lations." Experimental and epidemiological lines ofevi- dence have indicated that schooling, study, reading, and other near work are associated with excessive axial elon- gation and myopia,SI,S4,S6,63,140-143 but evidence that near work directly causes myopia is difficult to obtain from purely observational studies. The characteristic of accommodation that has most consistently been associated with refractive error is tonic TABLE 2-13 Range of Values for Refraction and the Ocular Components over Which 95% of Monozygotic Twin Pairs Agree and the Percentage of Dizygotic and Unrelated Pairs Who Fell within That Interval WITHIN MONOZYGOTIC 95% INTERVAL Ocular Component Refraction (OS) Corneal power (OS) Anterior chamber depth (mm) Lens power (OS) Axial length (mm) Monozygotic 95% Interval ±1.65 ±1.25 ±0.45 ±1.80 ±0.85 Dizygotic Twins 62% 72% 92% 75% 58% Unrelated Pairs 60% 56% 92% 73% 65% Data arefrom Sorsby A, Sheridan M, LearyGA. 1962. Refraction and Its Components in Twins (Medical Research Council Special Report Series No. 303). London: Her Majesty's Stationery Office.
- 14. 48 BENJAMIN Borishs Clinical Refraction accommodation (TA), or the accommodative state in the absence of an accommodative stimulus. Table 2-14 summarizes findings on TA and other accommodative functions in various refractive error groups. First, both the level of TN44 ,14 5 and the degree of accommodative hysteresis after accommodative demand!" seem clearly characteristic of refractive error type. Myopes show the lowest levels ofTA and the great- est hysteresis, whereas hyperopes have higher levels of TA and the least hysteresis. The level of TA also appears to be related to refractive error type in schoolchildren.147 Second, it has been shown that near work, performed for both the short term I4 R , 14') and the long term.!" can alter TA. Such studies of adults have led to a growing belief among some researchers that TA is either a causative agent or a predictive risk factor for myopia. Longitudinal evaluation of this hypothesis has shown that TA is not a predictive risk factor for myopia. Although TA was lower in myopic children in either of two test conditions, lower values ofTA were not predic- tive of later onset of myopia in an evaluation of over 700 children. 151 Animal Model Evidence and Limitations The effects of environmental manipulation on chicken, tree shrew, and primate ocular development-creating deprivation myopia-provide some of the strongest evi- dence cited for a significant role for the environment in human myopia. 152 It should be noted, however, that the animal models of myopia are designed only to assess environmental effects; no animal model has been used in which any genetic effect could be found even if it existed. Given the vast array of information on experi- mental myopia available from the animal models, espe- cially the chicken, and given that parallels are being drawn to human myopia, 153-155 it is time to ask whether induced myopia in animals is analogous to human myopia in an etiological sense. TABLE 2-14 Accommodation in Various Refractive Error Groups REFRACTIVE ERROR GROUP Accommodative Late-Onset Early-Onset Function Study Myopia Myopia Emmetropia Hyperopia Amplitude McBrien & Highest Medium to Medium to Lowest (""8.50 D) Millodot"" (""11.00 D) high low (""10.00 D) (""9.25 D) Tonic Maddock et al.144; Lowest Medium Medium Highest (1.60 D) accommodation McBrien & (0.50 D) (0.80 D) (0.80 D) Millodot!" Time for tonic McBrien & Fast (1-2 min) Fast Fast Slow (6-7 min) accommodation Mtllodot" to stabilize Accommodative Owens & High (shift in None None Low hysteresis WoIf-KellyI94; myopic (counteradaptive McBrien & direction) shift) Millodot!" Accommodative McBrien & High High Medium Low lag" Mlllodot"" Accommodative McBrien & Low Low Medium High response Mlllodot"" gradient Parasympathetic McBrien & Low Normal Normal High tone Millodot!" Sympathetic Gilmartin & Low Normal Normal High tone Hogan!" Effect of Bullimore & Higher Not examined Lower Not examined cognitive Cilmartin'": demand Bullimore & Gilmartin196 '0.50 D difference from highest to lowest at 5 D nearstimulus.
- 15. Incidence and Distribution of Refractive Anomalies Chapter 2 49 Besides the inability ofanimal models to identify and investigate genetic influences on myopia development, there are three main obstacles to the uniform applica- tion of animal models to the human condition. First, there is no deprivation of form vision in the environ- ment of the school-age child as severe as that required to induce myopia in animals. Second, the sensitive period for deprivation myopia in animals appears to be too early to account for human juvenile-onset myopia. Third, studies of the chicken using spectacle lenses to create dioptric blur involve a choroidal thickness mod- ulation that has no known human analog. Inducing experimental myopia by creating visual deprivation in chickens and tree shrews (through the use of translucent plastic) and primates (through lid suture) depends on a profound disruption of form vision and attendant reduction in contrast, yet there is no analogous experience in the normal visual world of the developing myope during childhood. The only can- didate for this analogous visual deprivation in humans has been the developing myope's lag of accommoda- tion, which provides a small and intermittent error of focus that would have to degrade the retinal image sufficiently to drive abnormal human eye growth.!" Although myopes have been shown to exhibit a higher amount of accommodative lag, both as adults!" and in childhood.I" it is unclear whether the accommodative lag is the cause or the result of their refractive error and whether this lag is in fact of sufficient magnitude to par- allel deprivation in animals. Application of the deprivation/blur model from animal studies to juvenile-onset myopia is questionable, because the age of onset of myopia in humans is much later developmentally than that induced in the experi- mental animals. The annual incidence of myopia in children is low and relatively constant until the age of 8 years, when it rises sharply and continues to rise until it stabilizes at age 14 years." Once juvenile-onset myopia occurs, it tends to progress until the age of 15 to 17 years.10 Therefore, humans' sensitivity to depriva- tion would have to occur between the ages of 8 and 16 years. The evidence from animal models identifies a sensitive period in both the chicken!" and the monkey!" for producing myopia by deprivation. This period in primates corresponds to human ages from birth to 7 years,161 well before the period during which juvenile-onset myopia develops and progresses. Although it is more difficult to equate chicken or tree shrew and human developmental stages, it is clear that the chicken's sensitivity to deprivation is greatest at hatching"? and that the tree shrew's sensitivity begins 15 days after eye opening and decreases thereafter.F''!" Neither is greatest at "school age." The animal myopia models' sensitive periods are more similar to the sensitive period for deprivation myopia that occurs in children between birth and 6 years from sources of true visual deprivation, such as hemangioma." cataract,164 corneal opacity," and vitre- ous hemorrhage." For animal models of deprivation myopia to be directly relevant to juvenile-onset myopia development, measurable myopia in older animals resulting from small, constant levels of contrast reduc- tion must be demonstrated. Such experiments have not yet been conducted. Experiments in the chicken in which spectacle lenses have been used to stimulate an accommodative response could shed light on the role, if any, of near work in human myopia. Contrary to claims made in the literature that such experiments support an environ- mental etiology for human myopia, spectacle lenses stimulating positive accommodation have not produced myopia in a dose-dependent fashion in the chicken.!" A more accurate tuning response to both plus- and minus-inducing lenses has been demonstrated in other laboratories, 166-168 but, surprisingly, the choroid appears to be responsible for it.168 Nonetheless, humans do not negatively accommodate, and choroidal thickness is not a significant factor in human refractive error. Magnetic resonance imaging on a small sample of hyperopes, emmetropes, and myopes, differing in refractive error by an average of 10.00 0, showed that choroidal thickness differed among the three groups by an average of 0.4 mm (1.00 OS equivalent). Differences were not noted in the peripheral choroid.!"? Intelligence Numerous studies have documented assocrations between intelligence, school achievement, and myopia. Myopes tend to have higher scores on tests of intelli- gence and cognitive ability54,170-174 and better grades'v!" than do other refractive error groups. Hyperopes, on the other hand, tend to show poorer reading skill and other perceptual anomalies more frequently. 140,147,173 Despite the finding of an association between myopia and near work for well over a century, the rela- tionship between these factors and intelligence has not been adequately investigated. Only one investigator has attempted to analyze all three factors in the same children, obtaining uncertain results. Ashton175 used self-reported grades in school and results from cognitive tests used in the Hawaii Family Study of Cognition as measures of aptitude and achievement. Numbers of books and magazines read, hours spent doing home- work and watching television, and years of education served as measures of near work. Myopia remained associated with near work after correction for aptitude and achievement and was associated with aptitude and achievement after correction for near work. The progression of myopia with age, however, was not related to near work after correction for aptitude and achievement, whereas myopic progression remained
- 16. 50 BENJAMIN Borisns Clinical Refraction associated with aptitude and achievement even after correction for near work. Two recent studies have also attempted to unravel the interrelationships between near work, aptitude, and parental history of myopia. Each found an association between near work and the aptitude variables tested, Iowa Tests of Basic Skills!" or Raven Standard Progressive Matrices (IQ).177 Each study also found an association between parental history of myopia and children's myopia. When all three variables were placed in models testing the relative strength of their associations with myopia, the study conducted in the United States found that all three variables were independently related to myopia with parental history of myopia had the strongest association.f" The study conducted in Singapore found that near work and parental history became insignificant when controlled for IQ, making IQ the most important factor.!" Either the Iowa Tests assess something different than the Raven Matrices, or there may be ethnic variation in what is most important in myopia. Interestingly, each study found that near work was less important when another variable was controlled for, such as IQ or parental history of myopia. Socioeconomic Status The association between refractive error and socioeco- nomic status has been documented in two reports from large population-based studies: cycle III of the Health Examination Survey (1966 to 1970) and the National Health and Nutrition Examination Survey (NHANES) from 1971 to 1972. In each study, myopes tended to be overrepresented among the higher socioeconomic strata and underrepresented among lower income levels. Angle and Wissmann!" categorized 15,536 subjects ages 12 to 17 years old by refractive status and 10 levels of family income. (Note that the absolute value of family income loses some meaning with time due to inflation.) Myopia was least frequent in the lowest income group (16.8% of those with incomes below $500) and increased steadily with increasing income to 35.1% of those with incomes over $15,000. Sperduto et al." analyzed data from 5282 subjects ages 12 to 54 years. Once again, myopia was least frequent among the families with the lowest incomes (10.0% to 26.6% of those with incomes below $5000) and most common in the highest income families (27.6% to 30.3% of those with incomes above $10,000). Reports of the prevalence of myopia are often a product of how stringent the criterion for myopia is. This is further complicated in large studies by the impracticality of performing a refraction on all subjects and the inability to use a cycloplegic agent. Myopic refractive error was quantified in these studies as the spherical equivalent determined from several sources: neutralization of spectacles, trial lens power that improved distance acuity, and retinoscopy. Hyperopia was not quantified. One possible source of the association between family income and myopia is the association between intelligence, education, and myopia. The probability of earning a higher wage certainly increases with intellec- tual ability and success in school. This ability and achievement are also related to myopia (see Intelli- gence). It is unclear whether this association represents environmental or genetic influences. On the genetic side, myopia may be related to intelligence because of some link between genes for both traits. On the environmental side, those who are more intellectually inclined and who succeed in school are probably also doing more near work than those who do not have as successful an academic experience. If the specific and independent contributions of each factor toward the prevalence of myopia are to be untangled, both factors must be assessed within the same study. To date, no researchers have conclusively performed such an analy- sis, and the question remains open. SUMMARY After reading this chapter, it might seem that the threats to emmetropia are so numerous and that so many factors are needed to produce it (e.g., normal visual experience and the harmonious and disease-free development of all ocular optical components) that emmetropia should be a rarity. What is remarkable is not that emmetropia happens at all, but that it is actually the rule, occurring so commonly that the distribution of refractive error is highly peaked near emmetropia and far from normal. Clinically, however, the emmetrope is an infrequent visitor for refractive vision care before presbyopia occurs. Ametropia is encountered as a rule in clinical practice. Information in this chapter should further the clinician's under- standing of the frequency with which a patient's refractive error occurs in the population and what demographic variables may possibly influence it. Assess- ment of refractive error may help in the diagnosis and management of the associated systemic and ocular pathologies described in this chapter. It may also guide the examination of the eye, as in the case of examina- tion of the fundus of the highly myopic patient. Dis- cussing the factors associated with refractive error will provide valuable information to patients. Unfortu- nately, although many of the factors described in this chapter suggest actual etiologies, definitive data are not available that might provide patients with information on the relative contributions of each factor. Such infor- mation awaits further study.
- 17. Incidence and Distribution of Refractive Anomalies Chapter Z 51 References 1. Mayer DL, Hansen RM, Moore BD, et al. 2001. Cycloplegic refractions in healthy children aged 1 through 48 months. Arch OphthalmoI1l9:1625-1628. 2. Mutti DO, Mitchell GL, Iones LA, et al. 2004. Refractive astigmatism and the toricity of ocular components in human infants. Optom Vis Sci 81:753-761. 3. Larsen IS. 1971. The sagittal growth of the eye. 1. Ultrasound measurement of the depth of the anterior chamber from birth to puberty. Acta Ophthalmol 49:239-262. 4. Larsen IS. 1971. The sagittal growth of the eye. III. Ultrasonic measurement of the posterior segment (axial length of the vitreous) from birth to puberty. Acta Ophthalmol 49:441-453. 5. Larsen IS. 1971. The sagittal growth of the eye. IV. Ultrasonic measurement of the axial length of the eye from birth to puberty. Acta Ophthalmol 49:873-886. 6. Sorsby A, Benjamin B, Sheridan M. 1961. Refraction and Its Components during the Growth of the Eye from the Age of Three (Medical Research Council Special Report Series No. 301). London: Her Majesty's Stationery Office. 7. Zadnik K, Mutti DO, Friedman NE, Adams AI. 1993. Initial cross-sectional results from the Orinda Longitudinal Study of Myopia. Optom Vis Sci 70:750-758. 8. Duke-Elder S, Wybar KC. 1963. System of Ophthalmology: Vo12. The Anatomy of the Visual System. St. Louis, MO: CV Mosby. 9. Larsen IS. 1971. The sagittal growth of the eye. II. Ultrasonic measurement of the axial diameter of the lens and the anterior segment from birth to puberty. Acta Ophthalmol 49:427-440. 10. Goss DA, Winkler RL. 1983. Progression of myopia in youth: Age of cessation. Am J Optom Physiol Opt 60:651-658. 11. Working Group on Myopia Prevalence and Progression. 1989. Myopia: Prevalence and Progression. Washington, DC: National Academy Press. 12. Sperduto RD, Siegel D, Roberts J, Rowland M. 1983. Prevalence of myopia in the United States. Arch Ophthalmol 101 :405-407. 13. Sorsby A, Benjamin B, Davey IB, et al. 1957. Emmetropia and Its Aberrations (Medical Research Council Special Report Series No. 293). London: Her Majesty's Stationery Office. 14. Hirsch MI. 1952. The changes in refraction between the ages of 5 and 14, theoretical and practical considerations. Am J Optom Arch Am Acad Optom 29:445-459. 15. Zadnik K, Mutti DO, Adams AI. 1992. The repeatability of measurement of the ocular components. Invest Ophthalmol Vis Sci 33:2325-2333. 16. Banks MS. 1980. Infant refraction and accommodation. 1m Ophthalmol Clin 20:205-232. 17. Atkinson J, Braddick O. 1987. Infant precursors of later visual disorders: Correlation or causality? In Yonas AE (Ed), Mmnesota Symposium on Child Psychology, pp 35-65. Minneapolis: University of Minnesota Press. 18. Hirsch M/. 1961. A longitudinal study of refractive state of children during the first six years of school. Am J Optom Arch Am Acad Optom 38:564-571. 19. Ilirsch MI. 1964. Predictability of refraction at age 14 on the basis of testing at age 6-interim report from the Ojai Longitudinal Study of Refraction. Am J Optom Arch Am Acad Optom 41:567-573. 20. Goss DA, Cox YD. 1985. Trends in the change of clinical refractive error in myopes. J Am Optom Assoc 56:608-613. 21. Laatikainen L, Erkkila H. 1980. Refractive errors and other ocular findings in school children. Acta Ophthalmol 58: 129-136. 22. Young FA, Beattie RJ, Newby FJ, Swindal MT. 1954. The Pullman Study-a visual survey of Pullman school children. Part I. Am JOptom Arch Am Acad Optom 31:111-121. 23. Young FA, Beattie RJ, Newby FJ, Swindal MT. 1954. The Pullman Study-a visual survey of Pullman school children. Part II. Am J Optom Arch Am Acad Optom 31:192-203. 24. Cook RC, Glasscock RE. 1951. Refractive and ocular findings in the newborn. Am J Ophthalmol 34:1407-1413. 25. Goldschmidt E. 1968. On the etiology of myopia. An epidemiological study. Acta Ophthalmol (Suppl) 98:1-172. 26. Luyckx I. 1966. Mesure des composantes optiques de l'oeil du nouveau-ne par echographie ultrasonique. IMeasurement of the optic components of the eye of the newborn by ultrasonic echography.] Arch Ophthalmol (Paris) 26:159-170. 27. Mohindra I, Held R. 1981. Refraction in humans from birth to five years. Doc Ophthalmol Proc Series 28: 19-27. 28. Santonastaso A. 1930. La rifrazione oculare nei primi anni di vita. [Ocular refraction in the first year of life.I Ann Ottalmol Clin Oculist 58:852-884. 29. Dobson V, Fulton AB, Sebris L. 1984. Cycloplegic refractions of infants and young children: The axis of astigmatism. Invest Ophthalmol Vis Sci 25:83-87. 30. Fulton AB, Dobson V, Salem D, et al. 1980. Cycloplegic refractions in infants and young children. Am J Ophthalmol 90:239-247. 31. Gwiazda J, Scheiman M, Mohindra I, Held R. 1984. Astigmatism in children: Changes in axis and amount from birth to six years. Invest Ophthalmol Vis Sci 25:88-92. 32. Howland HC, Sayles N. 1984. Photorefractive measurements of astigmatism in infants and young children. Invest Ophthalmol Vis Sci 25:93-102. 33. Howland HC, Atkinson J, Braddick 0, French I. 1978. Infant astigmatism measured by photorefraction. Science 202:331-333. 34. Ingram RM, Barr A. 1979. Changes in refraction between the ages of 1 and 3Y2 years. Br J Ophthalmol 63;339-342. 35. Mohindra I, Held R, Gwiazda J, Brill S. 1978. Infant astigmatism. Science 202:329-331. 36. Ehrlich DL, Braddick OJ, Atkinson J, et al. 1997. Infant emmetropization: Longitudinal changes in refraction components from nine to twenty months of age. Optom Vis Sci 74:822-843. 37. Howland HC, Sayles N. 1985. Photokeratometric and photorefractive measurements of astigmatism in infants and young children. Vis Res 25:73-81. 38. Atkinson J, Braddick 0, french I. 1980. Infant astigmatism: Its disappearance with age. Vis Res 20:891-893. 39. Blum HL, Peters HB, Bettman IW. 1959. Vision Screening for Elementary Schools: The Orinda Study. Berkeley, CA: University of California Press. 40. Kempf GA, Collins SD, Jarman BL. 1928. Refractive Errors in Eyes of Children as Determined by Retinoscopic Examination with Cycloplegia (Public Health Bulletin 182). Washington, DC: Public Health Service. 41. Fabian G. 1966. Augenartzliche Reihenuntersuchung von 1200 kindern im 2. Lebensjahr, [Ophthalmological examination of 1200 children up to age 2.1 Acta Ophthalmol 44:473-479. 42. Hirsch MI. 1963. Changes in astigmatism during the first eight years in school-an interim report from the Ojai Longitudinal Study. Am J Optom Arch Am Acad Optom 40:127-132. 43. Zadnik K, Mutti DO, Adams AI. 1992. Astigmatism in children: What's the rule? Ophthalmic and Visual Optics Technical Digest, 3:68-71.
- 18. 52 BENJAMIN Bortsns Clinical Refraction 44. Roberts L Rowland M. 1978. Reji'aClion Suuus and Motility Defects of Persons 4-74, United States, 1971-1972 (Vital and Ilealth Statistics Publication No. (PI IS) 78-1654). Washington, DC: U.S. Department of Health, Education and Welfare. 45. Gmelin RT. 1976. Myopia at West Point: Past and present. Milit Med 141:542-543. 46. Nakamura Y. 1954. Postwar ophthalmology in Japan. Am I Ophthalmol 38:413-418. 47. Sutton MR, Ditmars DL. 1970. Vision problems at West Point. I Am Optom Assoc41:263-265. 48. Brown EVL, Kronfeld I'. 1929. The refraction curve in the II.S with special reference to the first two decades. Proceedings of th« 13th International Congress of Ophthalmology, 13:87-98. 49. Jackson E. 1932. Norms of refraction. lAMA 98:761-767. 50. Tassrnan IS. 1932. frequency of the various kinds of refractive errors. Am I Ophthalmol 15:1044-1053. 51. Angle L Wissmann DA. 1978. Age, reading, and myopia. Am I Optom Physiol Opt 55:302-308. 52. Au long KG, '1~1Y 'I'll, Lim MK. 1993. Education and myopia in 110,236 young Singaporean males. Singapore Med I 34;489-492. 53. Richler A, Bear IC, 1980. Refraction, nearwork and education. A population study in Newfoundland. Acta Ophthalmol 58:468-478. 54. Rosner M, Belkin M. 1987. Intelligence, education, and myopia in males. Arch Ophl/wlmol 105:1508-1511. 55. Wang Q, Klein BEK, Klein R, Moss SEc 1994. Refractive status in the Beaver Darn Eye Study. Invest Ophshaimo! Vis Sci 35:4344-4347. 56. Young FA, Leary GA, Baldwin WR, et al. 1969. The transmission of refractive errors within Eskimo families. Am / Optom Arch Am Acad Optom 46:676-685. 57. Peckham (;S, Gardiner PA, Goldstein 11. 1977. Acquired myopia in 11-year-old children. HI' Med / 1:542-544. 58. Alsbirk PH. 1979. Refraction in adult West Greenland Eskimos. A population study of spherical refractive errors, including oculornetric and familial correlations. Acta Op/lthalmoI57:84-95. 59. Krause II, Krause K, Rantakillio P. 1982. Sex difference in refractive errors. Acta Ophthalrnol 60:917-924. 60. Chow YC, Dhillon B, Chew P'C Chew SI. 1990. Refractive errors in Singapore medical students. Singapore Med I 31:472-4 73. 61. Adams DW, McBrien NA. 1992. Prevalence of myopia and myopic progression in a population of clinical microscopists. Optom Vis Sci 69:467-473. 62. Septon RD. 1984. Myopia among optometry students. Ami Optom Pllysiol Opt 61:745-751. 63. Tay MTH, Au long KG, Ng CY, Lim MK. 1992. Myopia and educational attainment in 421,116 young Singaporean males. Ann Acad Med 21:785-791. 64. Lam CSY, Goh WSH. 1991. The incidence of refractive errors among school children in Iiong Kong and its relationship with the optical components. Clin Exp Optom 74:97-103. 65. Garner LI; Kinnear RF, McKellar M, et al. 1988. Refraction and its components in Melanesian schoolchildren in Vanuatu. Am I Optom I'/Iysiol Opt 65: 182-189. 66. Garner lE Meng CK, Grosvenor TI', Mohindin N. 1990. Ocular dimensions and refractive power in Malay and Melanesian children. Opht/wl Phvsio! Opt 10:234-238. 67. Gardiner PA. 1958. Dietary treatment of myopia in children. Lancet 1:1152-1155. 68. Edwards Mil, Leung SSr: Lee WIK 1996. Do variations in normal nutrition playa role in the development of myopia? Inve.1t Ophthalmol Vis Sci 37:S1004. 69. Halasa All, McLaren DS. 1964. The refractive state of malnourished children. Arch Gphthalmot 71:827-831. 70. Dobson V, Fulton AB, Manning K, et al. 1981. Cycloplegic refractions of premature infants. Am I Opht/wlmo/ 91:490-495. 71. Grignolo A, Rivara A. 1968. Observations biornetriques sur l'oeil des enfants nes a terrne et des prernatures au cours de la premiere annee, [Biometric observations on the eyes of infants born at full term and of premature infants during their first year.I Alln Oculist 201:817-826. 72. Lane Be. 1981. Calcium, chromium, protein, sugar and accommodation in myopia. Doc Ophthalmol Proc Series 28:141-148. 73. Feldman lB. 1950. Myopia, vitamin A and calcium. AI11 I Ophthalmol 33:777-784. 74. Fledelius He. 1983. Is myopia getting more frequent? A cross- sectional study of 1416 Danes aged 16 years-. ACla Ophthalmol 61:545-559. 75. Baldwin WR. 1981. A review of statistical studies of relations between myopia and ethnic, behavioral, and physiological characteristics. Am I Optom Physiol Opt 58:516-527. 76. Schapero M, Hirsch MI. 1952. The relationship of refractive error and Guilford-Martin Temperament Test scores. Am I Optol11 Arch Am Acud Optom 29:32-16. 77. Bullimore MA, Conway R, Nakash A. 1989. Myopia in optometry students: Family history, age of onset and personality. Ophtha! Physiol 0PI 9:284-288. 78. Scott R, Scott DRS, Schoernan 01. 1990. Are myopes really different? Clin [xp Optom 73:151-154. 79. Curtin BI. 1985. The Myopias. Basic Science and Ciinical Management. Philadelphia: Ilarper &. Row. 80. Maumenee 1/. 1979. Vitreoretinal degeneration as a sign of generalized connective tissue diseases. Am I Ophl/wlmol 88:432-449. 81. lrancois I. 1961. Heredity in Ophthalmology. St. Louis, MO: CV Mosby. 82. Spaeth GL, Barber GW. 1966. Homocystinuria-its ocular manifestations. I Pediutt Op/llhalmol 3:42-48. 83. Colson P, Damoiseaux P, Brisbois L et al. 1995.IEpidemic of hantavirus disease in Entre-Sarnbre-et-Meuse: Year 1992-1993J. ACla Clinica Belgia 50:197-206. 84. Salvanet-Bouccara A, Mandelbaum-Stupp e. 1987. [Acute myopia revealing acute disseminated lupus erythematosusJ. Bulletin des Societies D'Ophthall11ologie de France 87:1245- 1247. 85. Shu U, Takeuchi F, Tanimoto K, et al. 1992. Transient myopia with severe chemosis associated with exacerbation of disease activity in systemic lupus erythematosus. I Rheumatol 19:297-301. 86. Hirsch ML Levin JM. 1973. Myopia and dental caries. Am I Optom Arch Am Acad Optom 50:484-488. 87. Keller JT. 1978. Evaluation of the relation between myopia and dental caries. Am I Optom Phvsio! Opt 55:661-669. 88. Edwards Mil, Chan Ie. 1995. Is there a difference in dental caries between myopic and nonrnyopic children? Optom Vis Sci 72:573-576. 89. Rabin L Van Sluyters RC, Malach R. 1981. Emmetropization: A vision-dependent phenomenon? Invest Ophthalmol Vis Sci 20:561-564. 90. Gee SS, Tabbara Kf. 1988. Increase in ocular axial length in patients with corneal opacification. Ophthalmology 95:1276-1278.
- 19. Incidence and Distribution of Refractive Anomalies Chapter Z 53 91. Hoyt CS, Stone RD, Fromer C, Billson FS. 1981. Monocular axial myopia associated with neonatal eyelid closure in human infants. Am 1 Ophthalmol 91:197-200. 92. Miller-Meeks ML Bennett SR, Keech RV, Blodi CF. 1990. Myopia induced by vitreous hemorrhage. Am 1 Ophtha/mol 109:199-203. 93. Rasooly R, BenEzra B. 1988. Congenital and traumatic cataract. The effect on ocular axial length. Arch Ophthalmol 106:1066-1068. 94. Robb RM. 1977. Refractive errors associated with hemangiomas of the eyelids and orbit in infancy. Am 1 aphtha/mol 83:52-58. 95. Merriman WW, Ellis FD, llelveston EM. 1980. Congenital blepharoptosis. anisometropia, and amblyopia. Am 1 Ophthalmo/89:401-407. 96. Nathan J, Kiely PM, Crewther SG, Crewther DP. 1985. Disease- associated visual image degradation and spherical refractive errors in children. Am 1 Optom Physiol Opt 62:680-688. 97. Salleras A, De Zarate ICO. 1950. Recessive sex-linked inheritance of external ophthalmoplegia and myopia coincident with other dysplasias. Br 1 Ophthalmol 34:662-667. 98. Greene PR. 1980. Mechanical considerations in myopia: Relative effects of accommodation, convergence, intraocular pressure, and the extraocular muscles. Am 1 Optom Physiol Opt 57:902-914. 99. KellyTSB. 1981. The arrest and prophylaxis of expansion glaucoma (myopia). Doc Ophthalmol Proc Series 28:249- 253. 100. Perkins ES, Phelps CD. 1982. Open angle glaucoma, ocular hypertension, low-tension glaucoma, and refraction. Arch OphthalmolI00:1464-1467. 101. Abdalla MI, Hamdi M. 1970. Applanation ocular tension in myopia and emmetropia. Br 1 Ophthalmol 54:122-125. 102. David R, Zangwill LM,Tessler Z, Yassur Y. 1985. The correlation between intraocular pressure and refractive status. Arch OphthalmolI03:1812-1815. 103. Tomlinson A, Phillips CI. 1970. Applanation tension and the axial length of the eyeball. Br 1 Ophthalmol 54:548-553. 104. Bengtsson B. 1972. Some factors affecting the distribution of intraocular pressures in a population. Acta Ophthalmol 54:122-125. 105. Bonomi L, Mecca E, Massa F. 1982. Intraocular pressure in myopic anisometropia. In! Ophthalmol 5:145-148. 106. Kragha lKOK. 1987. Normal intraocular pressures. Glaucoma 9:89-93. 107. Seddon 1M,Schwanz B, Flowerdew G. 1983. Case-control study of ocular hypertension. Arch Ophthalmol 101:891- 894. 108. Daubs IG, Crick RP. 1981. Effect of refractive error on the risk of ocular hypertension and open angle glaucoma. Trans Ophthalmol Soc UK 101:121-126. 109. Smolin G, Thoft RA. 1987. The Cornea. Scientific Foundations and Clinical Practice. Boston: Little, Brown. llO. Duke-Elder S, Abrams D. 1970. System of Ophthalmology: Vol 5. Ophthalmic Optics and Refraction. St. Louis, MO: CV Mosby. 111. Hemenger RP, Garner LF, Ooi CS. 1995. Change with age of the refractive index gradient of the human ocular lens. Invest Ophthalmol Vis Sci 36:703-707. 112. Duke-Elder S, Dobree )II. 1967. System of Ophthalmology: Vol /0. Diseases of the Retina. St. Louis, MO: CV Mosby. 113. Pierro L, Camesaca FI, Mischi M, Brancato R. 1992. Peripheral retinal changes and axial myopia. Retina 12:12-17. 114. Grossniklaus III'., Green WR. 1992. Pathologic findings in pathologic myopia. Retina 12:127-133. ll5. Bullimore MA, Gilmartin B. 1987. Tonic accommodation, cognitive demand, and ciliary muscle innervation. Am 1 Optom Physiol Opt 64:45-50. ll6. Basu SK, Iundal A. 1983. Genetic aspects of myopia among the Shia Muslim Dawoodi Bahnas of Udaipur, Rajsthan. Hum Hered 33:163-169. 117. Wold KC. 1949. Hereditary myopia. Arch Ophthalmol 42:225-237. 118. Nakajima A. Kimura T, Kitamura K. 1968. Studies on the heritability of some metric traits of the eye and the body. ipn 1 Hum Genet 13:20-39. 119. Sorsby A, Leary GA, Fraser GR. 1966. Family studies on ocular refraction and its components. 1 Med Genetics 3:269-273. 120. Young FA, Leary GA. 1972. The inheritance of ocular components. Am 1 Optom Arch Am Acad Optom 49:546-555. 121. Goss DA, Hampton ML Wickham MG. 1988. Selected review on genetic factors in myopia. lAm Optom Assoc 59:875-884. 122. Kimura T. 1965. Developmental change of the optical components in twins. Acta Soc Ophthalmol 69:963-969. 123. Minkovitz IB, Essary LR, Walker RS, et al. 1993. Comparative corneal topography and refractive parameters in monozygotic and dizygotic twins. Invest Ophthalmol Vis Sci (Suppl) 34:1218. 124. Sorsby A, Sheridan M, Leary GA. 1962. Refraction and Its Components in Twins (Medical Research Council Special Report Series No. 303). London: Her Majesty's Stationery Office. 125. Teikari 1M, O'Donnell L Kaprio L Koskenvuo M. 1991. Impact of heredity in myopia. Hum Hered 41:151-156. 126. Teikari 1M, Kaprio L Koskenvuo MK, Vannas A. 1988. Heritability estimate for refractive errors-population-based sample of adult twins. Genet Epidemiol 5:171-181. 127. Hammond CL Snieder H, Gilbert CE, Spector TO. 2001. Genes and environment in refractive error: The twin eye study. Invest Ophthalmol Vis Sci 42:1232-1236. 128. Zadnik K, Satariano WA, Mutti DO, et al. 1994. The effect of parental history of myopia on children's eye size. lAMA 271:1323-1327. 129. Schwanz M, Haim M, Skarsholm D. 1990. X-linked myopia: Bornholm eye disease. Linkage to DNA markers on the distal part of Xq. Clin Genet 38:281-286. 130. Sertie AL, Quimby M, Moreira ES, et al. 1996. A gene which causes severe ocular alternations and occipital encephalocele (Knobloch syndrome) is mapped to 21q22.3. Hum Mol Genet 5:843-847. 131. Young TL, Ronan SM, Drahozal IA, et al. 1998. Evidence that a locus for familial high myopia maps to chromosome 18p. Am 1 Hum Genet 63:109-119. 132. Young TL, Ronan SM, Alvear AB, et al. 1998. A second locus for familial high myopia maps to chromosome 12q. Am 1 Hum Genet 63:1419-1424. 133. Paluru P, Ronan SM, Heon E, et al. 2003. New locus for autosomal dominant high myopia maps to the long arm of chromosome 17. Invest Ophthalmol Vis Sci 44:1830-1836. 134. Naiglin L, Gazagne C, Dallongeville F, et al. 2002. A genome wide scan for familial high myopia suggests a novel locus on chromosome 7q36. 1 Med Genet 39:118-124. 135. Mutti DO, Semina E, Marazita M, et al. 2002. Genetic loci for pathological myopia are not associated with juvenile myopia. Am 1 Med Genet 112:355-360. 136. Ibay G, Doan R, Reider L, et al. 2004. Candidate high myopia loci on chromosomes 18p and 12q do not playa major role in susceptibility to common myopia. BMC Med Genet 5:20. 137. Stambolian 0, Ibay G, Reider L, et al. 2004. Genomewide linkage scan for myopia susceptibility loci among Ashkenazi
- 20. 54 BEN.JAMIN' Borish's Clinical Refraction jewish families shows evidence of linkage on chromosome 22qI2. Am / Hum Gen 75:448-459. 138. Hammond CL Andrew T. Mak vr. Spector TO. 2004. A susceptibility locus for myopia in the normal population is linked to the PAX6 gene region on chromosome 11:A genomewide scan of dizygotic twins. Am / Hum Gen 75:294-304. 139. McBrien NA, Barnes DA. 1989. A review and evaluation of theories of refractive error development. aphtha/ Physiol apt 4:201-213. 140. Angle L Wissmann DA. 1980. The epidemiology of myopia. Am / Epidemiol III :220-228. 141. Cohn H. 1886. The Hygiene of the Eyein Schools. London: Simpkin, Marshall. 142. Ware I. 1813. Observations relative to the near and distant sight of different persons. Phil 'nans RoySoc London 103: 31-50. 143. Zylbermann R, Landau 0, Berson D. 1993. The influence of study habits on myopia in Jewish teenagers. / Pediacr aphthalmol Strabis 30:319-322. 144. Maddock RL Millodot M, Leat S, Johnson CA. 1981. Accommodation responses and refractive error. Invest aphtha/mol Vis Sci 20:387-391. 145. McBrien NA, Millodot M. 1987. The relationship between tonic accommodation and refractive error. Invest Ophthalmoi Vis Sci 28:997-1004. 146. McBrien NA, Millodot M. 1988. Differences in adaptation of tonic accommodation with refractive state. Imlest Ophthalmol Vis Sci 29:460-469. 147. Rosner L Rosner M. 1989. Relation between tonic accommodation and visual perceptual skills development in 6- to 12-year-old children. apcom Vis Sci 66:526-529. 148. Ebenholtz S. 1983. Accommodative hysteresis: A precursor for induced myopia? Invest Ophthalmo! Vis Sci 24:513-515. 149. Schor CM, Johnson CA, Post RB. 1984. Adaptation of tonic accommodation. aphtlwl Physio/ apt 4:133-137. 150. Owens DA, Harris D. 1986. Oculomotor adaptation and the development of myopia. Invest aphthalmol Vis Sci (Suppl) 27:80. 151. Zadnik K Multi DO, Kim liS, et al. 1999. Tonic accommodation, age, and refractive error in children. Invest aphthalmol Vis Sci 40: 1050-1060. 152. Wallman I. 1994. Nature and nurture of myopia. Nature 371:201-202. 153. Schaeffel 1', Howland He. 1991. Properties of the feedback loop controlling eye growth and refractive state in the chicken. Vis Neurosci 31:717-734. 154. Sivak IG. 1988. Undercorrection and myopia development. Am I apcom Physiol apt 65:766. 155. Troilo 0, Wallman I. 1991. The regulation of eye growth and refractive state: An experimental study of emmetropization. Vis Res 31:1237-1250. 156. Goss DA. 1991. Clinical accommodation and heterophoria findings preceding juvenile onset of myopia. apcom Vis Sci 68:110-116. 157. McBrien NA, Millodot M. 1986. The effect of refractive error on the accommodative response gradient. Ophthal Physiol apt 6:145-149. 158. Gwiazda L Thorn 1', Bauer L Held R. 1993. Myopic children show insufficient accommodative response to blur. Invest Oputnalmo! Vis Sci 34:690-694. 159. Wallman L Adams II. 1987. Development aspects of experimental myopia in chicks: Susceptibility, recovery and relation to emmetropization. Vis Res 27:1139-1163. 160. Smith EL, Harwerth RS, Crawford MLJ. von Noorden GK. 1987. Observations on the effects ofform deprivation on the refractive status of the monkey. Invest Ophthalmo! Vis Sci 28: 1236-1245. 161. Young FA. 1964. The distribution of refractive errors in monkeys. Invest Ophthalmol Vis Sci 3;230-238. 162. McBrien NA, Norton IT. 1992. The development of experimental myopia and ocular component dimensions in monocularly lid-sutured tree shrews (Tupaia belangeri). Vis Res 32:843-852. 163. Norton 'IT. 1990. Experimental myopia in tree shrews. In Myopia and the Control of EyeGrowth pp 178-199. Chichester. England: Wiley. 164. von Noorden GK Lewis RA. 1987. Ocular axial length in unilateral congenital cataracts and blepharoptosis. Invest Ophthalmol Vis Sci 28:750-752. 165. Schaeffel 1', Glasser A, Howland He. 1988. Accommodation, refractive error, and eye growth in chickens. Vis Res 28:639-657. 166. Irving EL, Sivak, IG, Callender MG. 1992. Refractive plasticity of the developing chick eye. Ophtha! Physiol apt 12:448-456. 167. Wildsoet CF, Wallman I. 1993. Effects of optic nerve section and tetrodotoxin on emmetropization in the chick. aptom Vis Sci 70(Suppl):24. 168. Wallman L Wildsoet C. Xu A, et al. 1995. Moving the retina: Choroidal modulation of refractive state. Vis Res35:37-50. 169. Cheng H, Singh OS, Kwong KK et al. 19'.J2.Shape of the myopic eye as seen with high-resolution magnetic resonance imaging. apcom Vis Sci 69:698-701. 170. Cohn SL Cohn CMG, Iensen AR. 1988. Myopia and intelligence: A pleiotropic relationship? Hum Genet 80:53-58. 170a. Grosvenor T. 1970. Refractive state, intelligence test scores, and academic ability. Am / apcom Arclz Am Acad aptom 64:482-498. 171. Hirsch MI. 1959. The relationship between refractive state of the eye and intelligence test scores. Am / Optom Arch Am Acad Optom 36: 12-21. 172. Williams SM, Sanderson GF, Share DL, Silva PA. 1988. Refractive error, IQ and reading ability: A longitudinal study from age seven to 11. Dev Med Child Neural 30:735-742. 173. Young FA. 1963. Reading, measures of intelligence and refractive errors. Am / aptom Arch Am Acad aptom 40:257-264. 174. Young FA, Leary GA, Baldwin WR, et al. 1970. Refractive errors, reading performance, and school achievement among Eskimo children. Am / apcom Arch Am Acad Optom 47:384-390. 175. Ashton Ge. 1985. Nearwork, school achievement and myopia. / Biosocial Sci 17:223-233. 176. Multi DO, Mitchell GL, Moeschberger ML, et al. 2002. Parental myopia, near work, school achievement, and children's refractive error. Invest aphthalmol Vis Sci 43:3633-3640. 177. Saw SM, Tan SB, Fung 0, et al. 2004. IQ and the association with myopia in children. Invest Optuhalmol Vis Sci 45:2943-2948. 178. Orinda Longitudinal Study of Myopia. 1993. Unpublished data. 179. Zonis S, Miller B. 1974. Refractions in the Israeli newborn. / Pediacr aphthalmol Strabis 11:77-81. 180. Crawford HE, Hammond GE. 1949. Racial analysis of ocular defects in the schools of Hawaii. Hawaii Med / 9:90-93. 181. Sarver IN, Fusaro RE. 1994. A pilot study of the prevalence of visual conditions among minority school children in Oakland. Optom Vis Sci 71(suppl):1l6-117.
- 21. Incidence and Distribution of Refractive Anomalies Chapter 2 55 182. Lin LLK, Chen CL Hung PT, Ko LS. 1988. Nation-wide survey of myopia among schoolchildren in Taiwan. Acta Opthalmol Suppl 185:29-33. 183. Kleinstein RN, Jones LA, Hullett S, et al., The CLEERE Study Group. 2003. Refractive error and ethnicity in children. Arch OphthalmoI121:1141-1147. 184. Au Eong KG, Tay TH, Lim MK. 1993. Race, culture and myopia in 110,236 young Singaporean males. Singapore Med J 34:29-32. 185. Sorsby A, Sheridan M, Leary GA. 1960. Vision, visual acuity and ocular refraction of young men. Br Med J 1:1394-1398. 186. Hymans SW, Pokotilo E, Shkurko G. 1977. Prevalence of refractive errors in adults over 40: A survey of 8102 eyes. Br J Ophthalmol 61:428-432. 187. Shapiro A, Stollman EB, Merin S. 1982. Do sex, ethnic origin or environment affect myopia? Acta Ophthalmol 60:803-808. 188. Abiose A, Bhar IS, Allanson MA. 1980. The ocular health status of postprimary school children in Kaduna, Nigeria: Report of a survey. J Pediatr Ophthalmol Strabis 17:337-340. 189. Wick B, Crane S. 1976. A vision profile of American Indian children. Am J Optom Physiol Opt 53:34-40. 190. Taylor HR. 1980. Racial variations in vision. Am J Epidemiol 115:139-142. 191. van Rens GHMB, Arkell SM. 1991. Refractive errors and axial length among Alaskan Eskimos. Acta Ophthalmol 69:27-32. 192. Tamura 0, Mitsui Y. 1975. Organophosphorous pesticides as a cause of myopia in school children: An epidemiological study. lpn J Ophthalmol 19:250-253. 193. McBrien NA, Millodot M. 1986. Amplitude of accommodation and refractive error. Invest Ophthalmol Vis Sci 27:1187-1190. 194. Owens DA, Wolf-Kelly K. 1987. Near work, visual fatigue, and variations of oculomotor tonus. Invest Ophthalmol Vis Sci 28:743-749. 195. Gilmartin B, Hogan RE. 1985. The role of the sympathetic nervous system in ocular accommodation and ametropia. Ophthal Physiol Opt 5:91-93. 196. Bullimore MA, Gilmartin B. 1987. Aspects of tonic accommodation in emmetropia and late-onset myopia. Am J Optom Physiol Opt 64:499-503.