More Related Content
Similar to 1-D Kinematics AP Lab Graphing.docx
Similar to 1-D Kinematics AP Lab Graphing.docx (20)
More from Dr Robert Craig PhD
More from Dr Robert Craig PhD (20)
1-D Kinematics AP Lab Graphing.docx
- 1. Copyright© 2018 Physics-Burns
100
95
90
85
80
75
70
65
60
55
50
45
40
35
30
25
20
15
10
5
Name(s):_________________________________________
Lab: Kinematics Graphing (75 points)
Purpose:
In thislab,youand your partner(s) willgraphthe motionof people movingfromone positiontoanother.Teamworkwill
be required,asone memberperformsthe actionwhilethe othermembersrecordthe data.
Step 1: Your teacheror selectedrunnerwill be goingbackandforthalonga 100-meter track that will have acone setup
every20 meters.It isyourjob to recordhowlong thispersontakestoget to every cone,byvideorecordingthe motion
usingyourphone. (5 pts)
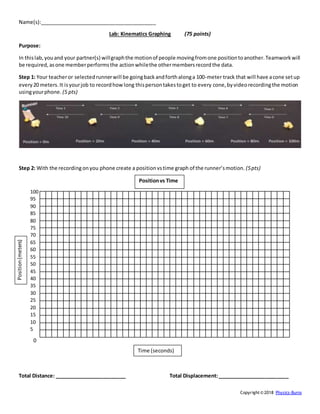
Step 2: With the recordingonyou phone create a positionvstime graph of the runner’smotion. (5pts)
Total Distance: _________________________ Total Displacement:_________________________
Positionvs Time
Position
(meters)
Time (seconds)
0
- 2. Copyright© 2018 Physics-Burns
Step 3: What piecesof informationcanyougatherfromthisgraph? (Findat least three).Whatisone thingthatthe
graph impliesthatisnot100% accurate? (10 pts)
1. 1.
2.
3.
Step 4: What was the average velocity andaverage speed foreachsegment of the track?(5 pts)
Step 5: You and your partner(s) willrecordeachotherperformingvariousactivitiesonthe track.Use yourphone to
record howlongittakesto get througheverysegmentof the track.(If possible,use the phone of the personperforming
the activity).Every20 meters,youwill be performingadifferentkindof motion. (5pts)
- 3. Copyright© 2018 Physics-Burns
Name (1):_________________
Position (meters) Action Total Time (seconds)
0m - 20m Walk
20m - 40m Jog
40m - 60m Skip
60m - 80m Hop on one foot
80m - 100m Run backwards
100m - 0m Sprint
(All the way back)
Name (2):_________________
Position (meters) Action Total Time (seconds)
0m - 20m Walk
20m - 40m Jog
40m - 60m Skip
60m - 80m Hop on one foot
80m - 100m Run backwards
100m - 0m Sprint
(All the way back)
Name (3):_________________
Position (meters) Action Total Time (seconds)
0m - 20m Walk
20m - 40m Jog
40m - 60m Skip
60m - 80m Hop on one foot
80m - 100m Run backwards
100m - 0m Sprint
(All the way back)
Step 8: Use the graph at the back of thisworksheettoplotthe pointsandconnectthe dots on a positionvstime graph.
(Each personshouldplotthe pointsforthe datafor whichhe/she isresponsible). (10pts)
- 4. Copyright© 2018 Physics-Burns
Questions
1. Comparingthe graphsto one another,whatare at least 3 thingsthatyou notice?(5pts)
2. Lookingat the graph, duringwhichactivitydideachpersonrunthe slowest?How canyou tell? (5pts)
3. Lookingat the graph, duringwhichactivitydideachperson runthe fastest?How can you tell? (5pts)
4. Withthe data youcollected,canyoumeasure instantaneousoraverage velocity?Explain.Canyouthinkof a
wayto measure the othertype? (5 pts)
5. Look at the firstgraph and pretenditisthe graph showingsomeone’srunupa mountain.Whatare some of the
thingsthat youcan conclude aboutthe terrainof the mountain,consideringthe givenpositionsandtimes? (5
pts)
6. Using the data fromthe firstgraph,create a velocityvstime graph. (10pts)
What issomethingthatisnot 100% accurate aboutthisgraph?
Time (seconds)
Velocityvs Time
Velocity
(meters/second)
0