The purpose of the Lanthanum carbonate centrifuge trial was to determine if Lanthanum carbonate could be successfully centrifuged to meet specifications and achieve feed rates for Phase I goals. There were two trials performed using different cloth sizes. Trial 1 used a 20 micron cloth and Trial 2 used a 30 micron cloth. Both trials produced lanthanum carbonate solids within specifications but the loading phase took up most of the cycle time due to filtrate build up on the cake. The 30 micron cloth improved feed rates but still had long loading times. Overall the trials demonstrated lanthanum carbonate can be centrifuged to meet Phase I rate goals.
Analysis of Volatile Organic Compounds (VOCs) in Air Using US EPA Method TO-17
Lanthanum Carbonate Centrifuge Trial Report 2
1. LANTHANUM CARBONATE CENTRIFUGE TRIAL
OCTOBER 2014
Purpose
The purpose of the Lanthanum carbonate centrifuge trial was to determine the following criteria:
Can we successfullycentrifuge Lanthanum carbonate
Can the centrifugedmaterial meet specifications
Can we achieve feedrates conducive to reaching Phase I goals for Lanthanum Oxide. Phase I Rates are 4,416 MT/year
or 14.2 MT/dayof La Oxide. This equatesto a centrifuge rate of 6.18 Kg/minof La Carbonate for one centrifuge and
wouldrequire 4 centrifuges of the same capacitycurrentlybeing used (assuming 300 Kg per discharge witha cycle
time of 48.5 minper centrifuge).
Description
LanthanumCarbonate slurrywas produced fromthe LanthanumPrecips intoLanthanumSurge Tank, TK131. This slurrywas
then transferred to the Centrifuge FeedTank, F65-TK130, using one of the ODS pumps at the bottomof TK131. The Lanthanum
Carbonate slurryinF65-TK130 was then circulatedinthe feedheader for the centrifugesandfedonlyto Centrifuge 160, F65-
CENH160. The planfor the trialincluded usingCentrifuge 160, F65-CENH160, so that onlyone centrifuge wouldbe
contaminatedwith Lanthanum. The discharge spool piece on CENH160 was removedanda modifiedspool piece was installed
to allowthe filtrate andwash water to be sent to the tote for collection. The tote was thenpumped back to F60-TK131 as
neededto keepthe centrifuge running. This filtrate and washwater collectedinF60-TK131 was pumped to the lanthanum
thickeners.
There were twoseparate Lanthanum centrifuge trialsperformed. The first trialwas performedusing a 20 micronclothandthe
second trial was performedusinga 30 micron cloth. Between the twotrials, DidyOxalate cleanup materialwas re-slurried and
transferredintothe centrifuge feed tank andthenrun through Centrifuge 160.
Samples were takenof each cake discharge andsent to the lab for PSD, Na, Cl andtREO analyses. Samples were alsotaken of
the water wash for Na analysis.
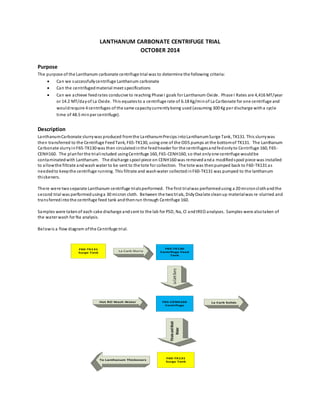
Belowis a flow diagram ofthe Centrifuge trial.
F60-TK131
Surge Tank
F65-TK130
Centrifuge Feed
Tank
F60-TK131
Surge Tank
F65-CENH160
Centrifuge
La Carb Slurry
LaCarbSlurry
La Carb Solids
FitrateandWash
Water
To Lanthanum Thickeners
Hot RO Wash Water
2. A typical centrifuge cycle consists offour phases. These phases are the LoadingPhase, the Washing Phase, the Spinning Phase
and the Discharge Phase. All four phases contribute to the overall cycle time of one batchof material throughthe centrifuge.
LoadingPhase – This phase has the potential to contribute the most time to the overallcycle time. The centrifugesinuse are
currentlyloadedbycake thickness. The cake is loaded into the centrifuge untilthe cake sensor sensesthat the cake
has built to a layer matching the desiredthickness settingset bythe operator. The cake sensor will initiate a drain
step andallow the centrifuge to re-loadmore cake after the drainingstep. This draining and re-loadingmayoccur
numerous timesuntilthe basket is full and the centrifuge moves to the Washing Phase.
Washing Phase – This phase will always contribute the same amount oftime to eachcycle that has beenpreset bythe operator.
The water washis done with hot RO water. A spraybar inside the centrifuge is equippedwith7 spraynozzles that are
adjustedto cover the entire cake in the basket as it spins past the spraybar. Thiscreates a plug flow of wash water
through the cake to the discharge ofthe centrifuge.
Spinning Phase – This phase will always contribute the same amount of time to eachcycle that hasbeen preset bythe operator.
The spinning phase is usuallyperformed at a higher speed and removes the free water that is left inthe cake from the
Washing Phase. The time for the spinningis determinedto achieve a moisture level onthe dischargedcake.
Discharge Phase – This Phase dischargesthe cake from the centrifuge andcontributes the least amount of time to the overall
cycle. This phase moves the cutting knife intothe cake andremoves it from the basket. The cake falls fromthe knife
blade intoaninternal hopper that feeds andauger that moves the material out of the centrifuge ontoa conveyor that
moves the material into a sling.
For Trial 1, the Loading Phase accountedfor 75% of the overall time per centrifuge cycle. For Trial 2, the LoadingPhase
accountedfor 71 % of the overall time per centrifuge cycle. EachCycle and its parameters canbe seeninthe tablesinthe
Appendix. White boxes outlinedin redindicate a change to the parameter for that particular cycle.
CENTRIFUGETRIALS
TRIAL 1
Trial 1 of the Lanthanum Carbonate Centrifuge trials involvedfilteringapproximately8,400 gallons of La Carbonate slurry
through centrifuge 160. This runrequirednine centrifuge cycleswhichyielded2,245 Kg of La Carbonate solids that hadan
average moisture content of 25 % free moisture. The 20 micron clothwas verygood at capturingthe solids. The filtrate was
visuallyveryclear (novisible suspendedsolids). However, this clothlimitedthe feed rate to less than30 gpm andwas hardfor
the filtrate andwashwater to pass through during the loadingandwashingphases. Thistight clothwas causing the filtrate to
puddle ontop ofthe cake andthis liquidwould buildupand would activate the cake sensor sending the centrifuge into
numerous drains per cycle. The result of this was long loadingtimes.
The first cycle was fed at 42 gpm anddischargeda visuallycloudyfiltrate. Cycle 2 was fedat 30 gpm with visuallyclear filtrate.
Cycles 3 through9 were fedat 28 gpm with visuallyclear filtrate. The average loadingphase time was 72 minutes with an
average totalcycle time of 96 minutes. The average cake discharge weight for the 9 cycles was 241 Kg. This ledto anaverage
centrifuge rate of2.50 Kg/minof La Carbonate for Trial 1 which is 40.6% of Phase I rates onanOxide basis for one centrifuge.
The best centrifuge cycle during thistrialachieved a centrifuge rate of 2.95 Kg/minof La Carbonate which is 47.7% of Phase I
rates onan Oxide basis for one centrifuge. See the graphbelow.
3. The Samplestaken for the cake discharges inTrial1 were analyzedfor %LOI, %H2O, %Cl(w/w), %Na2O(w/w) andtREO. This
data can be seenthe Table 1 at the endof this section.
The %Na/tREO data was well below the specificationof 0.25% for the first 8 cycles withthe ninthcycle beingjust slightlyhigher
than specification. The increase inthe Na content throughthe last 3 cycles is unexplainable because cycles 6 through9 were
run with the same parameters. See the graphbelow.
0.00
1.00
2.00
3.00
4.00
5.00
6.00
7.00
CYCLE 1 CYCLE 2 CYCLE 3 CYCLE 4 CYCLE 5 CYCLE 6 CYCLE 7 CYCLE 8 CYCLE 9
KG/MIN TRIAL 1 CENTRIFUGE RATE FOR ONE CENTRIFUGE
PHASE I RATE
ACTUAL RATE
0.0000
0.0500
0.1000
0.1500
0.2000
0.2500
0.3000
CYCLE 1 CYCLE 2 CYCLE 3 CYCLE 4 CYCLE 5 CYCLE 6 CYCLE 7 CYCLE 8 CYCLE 9
%Na2O
% Na2O/Treo TRIAL 1
Na2O
SPEC
4. When the conductivityreadingand the analytical results for the %Na content of the filtrate for cycle 9 are plotted withthe
analyticaldata for the cake, the indicationis that the %Na content of the cake for cycle 9 wouldhave beenbelow the
specification. This couldbe an anomalywith the analytical result for the cake from cycle 9. Another theoryfor this highNa
reading for cycle 9 couldbe due to a non-soluble Na crystalline structure that mayhave beenformedinthe Precipprocess. See
the graphbelow.
The %Cl/tREO waswell below the Grace specification of 0.6% for all9 centrifuge cycles. With exceptionto cycle 6 andcycle 9,
the remaining7 cycles for Trial 1 met the specification of 0.20% maximum indicated for BASF. See the graphbelow
0
50
100
150
200
250
0.0000
0.0500
0.1000
0.1500
0.2000
0.2500
0.3000
CYCLE
1
CYCLE
2
CYCLE
3
CYCLE
4
CYCLE
5
CYCLE
6
CYCLE
7
CYCLE
8
CYCLE
9
%Na2O
% Na2O/Treo for Cake and Filtrate
Na2O CAKE
SPEC
CONDUCTIVITY Filtrate
Na Reading Filtrate
0.0000
0.1000
0.2000
0.3000
0.4000
0.5000
0.6000
0.7000
CYCLE 1CYCLE 2CYCLE 3CYCLE 4CYCLE 5CYCLE 6CYCLE 7CYCLE 8CYCLE 9
%CHLORIDE
% CHLORIDE/tREO
CHLORIDE
Grace spec
BASF spec (max)
5. TRIAL 2
Trial 2 of the Lanthanum Carbonate Centrifuge trials involvedfilteringapproximately8,700 gallons of La Carbonate slurry
through centrifuge 160. This runrequired sevencentrifuge cycleswhichyielded 1,762 Kg of La Carbonate solids that hadan
average moisture content of 29 % free moisture. The 30 micron cloth was as effective as the 20 microncloth at capturing the
solids as thisfiltrate was alsoveryclear with novisible suspendedsolids. The 30 micron cloth was not as limitingon the feed
rate as the 20 microncloth. Feedrates withthe 30 micronclothwere 75 % better thanthe feed rates withthe 20 microncloth.
Even with better feed rates, this cloth was stillcausing the filtrate to puddle ontop of the cake and this liquidwouldbuildup
and would activate the cake sensor sendingthe centrifuge intonumerous drains per cycle. The loading times for this trial were
19.4% shorter thanthe trial withthe 20 microncloth.
The first cycle was fed at 42 gpm and allother cycles were fed at 49 gpm. The filtrate remained visuallyclear with 49 gpm being
the maximum feedrate achievable. The average loadingphase time was 58 minuteswith anaverage totalcycle time of82
minutes. The average cake discharge weight for the 7 cycles was 252 Kg. This led to anaverage centrifuge rate of 3.08 Kg/min
of La Carbonate for Trial 2 which is 49.7 % of Phase I rates onan Oxide basis for one centrifuge. The best centrifuge cycle
during this trial achieveda centrifuge rate of 3.79 Kg/minof La Carbonate which is 61.3 % of Phase I rateson an Oxide basisfor
one centrifuge. Attempts to change the parameters to achieve better centrifuge rates were unsuccessful and ledto the decline
in the centrifuge rates per cycle. See the graphbelow.
The Samplestaken for the cake discharges inTrial2 were analyzedfor %LOI, %H2O, %Cl(w/w), %Na2O(w/w) andtREO. This
data can be seenthe Table 2 at the endof this section.
The %Na/tREO data for Trial2 was well belowthe specification of0.25% for all the cycleswiththe exception ofthe second
centrifuge cycle. The increase in the Na content for the secondcycle was due to the Centrifuge feed valve leakingthroughand
allowing slurryto enter the centrifuge duringthe washandspinningsteps. A handvalve was closedat the endof the loading
0.00
1.00
2.00
3.00
4.00
5.00
6.00
7.00
CYCLE 1 CYCLE 2 CYCLE 3 CYCLE 4 CYCLE 5 CYCLE 6 CYCLE 7
KG/MIN
TRIAL 2 CENTRIFUGE RATE FOR ONE CENTRIFUGE
PHASE I RATE
ACTUAL RATE
6. phase for all subsequent cycles to prevent slurryfrom entering the centrifuge during the WashandSpinning phases. See the
graph below.
The %Cl/tREO waswell below the Grace specification of 0.60 % for all centrifuge cyclesexcept cycle 2. The BASFspecification of
0.20 % maximum was achievedbythe remaining cycles. See the graphbelow
0.000
0.100
0.200
0.300
0.400
0.500
0.600
0.700
0.800
0.900
CYCLE 1 CYCLE 2 CYCLE 3 CYCLE 4 CYCLE 5 CYCLE 6 CYCLE 7
%Na2O
% Na2O/Treo TRIAL 2
Na2O
SPEC
Feedvalve
leakingthrough
0.000
0.200
0.400
0.600
0.800
1.000
1.200
CYCLE 1 CYCLE 2 CYCLE 3 CYCLE 4 CYCLE 5 CYCLE 6 CYCLE 7
%CHLORIDE
% CHLORIDE/tREO
CHLORIDE
Grace spec
BASF spec (max)
Feedvalve
leakingthrough
8. TRIAL COMPARISON
The table belowshows the comparison ofthe data betweenthe two centrifuge trials.
The centrifuge rate of both Trials compared to Phase I rates is shown below.
Both of the centrifuge trialsproduced Lanthanum Carbonate cake that wasbelow the percent sodiumspecificationof
0.25%Na/tREO.
Cycle 2 on Trial 2 was above the specificationdue to the centrifuge feed valve leaking slurryinto the centrifuge duringthe Wash
and Spinning Phases.
Cycle 9 on Trial 1 was slightlyabove the specificationfor %Na withno knownexplanation. The conductivityreadings that were
taken onthe washfiltrate alongwith the analysis from the lab would indicate that the %Na oncycle 9 wouldhave been
expectedto be below the specification. See the graphbelow.
CLOTH
SIZE
(MICRON)
SLURRY
FEED
% TSS
FEED
RATES
(GPM)
TOTAL
FILTRATE
FED (GAL)
TOTAL
CAKE
DROPPED
(KG)
AVG
CYCLE
TIME
(MIN)
AVG WEIGHT
DROPPED
PER CYCLE
(KG)
AVG
MOISTURE
CONTENT (%)
AVG
%Cl/tREO
AVG
%Na2O/tREO
AVG
CENT
RATE
(KG/MIN)
PERCENT
OF PHASE
I RATE
(%)
TRIAL 1 20 10.6 28 8400 2245.5 96 241 25.2 0.127 0.089 2.50 40.6
TRIAL 2 30 16.8 49 8700 1762 82 252 29.4 0.271 0.157 3.08 49.7
0.00
1.00
2.00
3.00
4.00
5.00
6.00
7.00
CYCLE 1 CYCLE 2 CYCLE 3 CYCLE 4 CYCLE 5 CYCLE 6 CYCLE 7 CYCLE 8 CYCLE 9
KG/MIN
TRIAL 1 & 2 CENTRIFUGE RATE FOR ONE CENTRIFUGE
PHASE I RATE TRIAL 1 20 micron TRIAL 2 30 micron
9. Both of the centrifuge trialsproducedLanthanum Carbonate cake that wasbelow the Grace specificationof 0.6 % Cl/tREO.
Cycle 2 for Trial 2 was above this specificationof 0.6% Cl due to the centrifuge feed valve leakingslurryinto the centrifuge while
performing the WashandSpinning Phases.
For the total of16 cycles, 13 out of 16 cycles (or 81.25 %) were below the BASF maximumspecificationof 0.20 % Cl/tREO. See
the graphbelow.
0
0.1
0.2
0.3
0.4
0.5
0.6
0.7
0.8
0.9
CYCLE 1 CYCLE 2 CYCLE 3 CYCLE 4 CYCLE 5 CYCLE 6 CYCLE 7 CYCLE 8 CYCLE 9
%Na2O TRIAL 1 & 2 % Na2O/tREO
SPEC % Na2O/tREO TRIAL 1 % Na2O/tREO TRIAL 2
Feedvalve
leakingthrough
0
0.2
0.4
0.6
0.8
1
1.2
CYCLE 1 CYCLE 2 CYCLE 3 CYCLE 4 CYCLE 5 CYCLE 6 CYCLE 7 CYCLE 8 CYCLE 9
%CHLORIDE
TRIAL 1 & 2 % CHLORIDE/tREO
Grace spec BASF spec (max) % CHLORIDE TRIAL 1 % CHLORIDE TRIAL 2
Feed valve
10. SUMMARYAND CONCLUSIONS
SUMMARY
With the assumptionof 300 Kg of LanthanumCarbonate cake being discharged at each centrifuge cycle and the use of the
current size of centrifuge, a cycle time of approximately 48 minutes wouldbe required per centrifuge andfour centrifuges
wouldbe requiredto meet Phase I rates for La Oxide. Thisperformance wouldequate to a centrifuge rate of 6.18 kg/minof La
Carbonate per centrifuge.
In both centrifuge trials, the centrifuge rates for Trial1 andTrial2 were 40.6 % and49.7 % of Phase I rates for four centrifuges,
respectively. This improvedperformance towardPhase I rates for Trial 2 is due to the decrease in the loadingtimes which is
attributed to the larger 30 micron cloththat was used for Trial2. However, the Lanthanum Carbonate cake produced during
these two trialshad acceptable free moisture content andthe qualitywas well withinspecifications for Na andCl. The spinning
time during the SpinningPhase was decreased after the first andsecondcycle of Trial 1 to increase the moisture inthe cake
that was being dischargedfrom the centrifuge. The first two cake discharges fromTrial1 were verydustywhen enteringthe
slingfrom the conveyor.
All of the LanthanumCarbonate that was centrifuged during these two trials was fedto the new La Calciner and convertedto La
Oxide with nonegative impacts during conveying or calcining of the material.
The following conclusions canbe drawn fromthe two Lanthanum Carbonate Centrifuge Trials.
LanthanumCarbonate canbe successfullycentrifugeddirectlyfrom the Lanthanum Carbonate Precips without
thickening ofthe slurry.
The Na andCl content of the centrifuged cake can be washedawayinthe centrifuge wash phase to meet
specifications.
The centrifugedcake was averaging moisture contents of 25 to 30% andwas fed into the Lanthanum calciner with no
negative issues.
The abilityto wash the Na andCl out of the cake witha minimal amount of RO water wouldgreatlyreduce the
hydraulic load currentlyused at the Lanthanumthickeners anddrum filter. Thiswouldalso eliminate the use of many
pieces ofagedequipment andthe costs associatedwithmaintaining the equipment.
Further testing witha larger size cloth (~40 micron) in the centrifuge is recommended to see ifbetter centrifuge rates
can be achievedto reachthe Phase I goals. Based onthe increased centrifuge rate experienced betweenthe 20
micron and30 microncloths, a significant increase inthe centrifuge rate wouldbe expectedwiththe increased cloth
size from 30 micronto 40 micron. Thiswouldrequire about 5-7 days ofno productionfor the NDPR circuit to run
another trial usingone of the NDPR centrifuges.
The current centrifuge capacitieswouldbe expectedto achieve discharge weights of La Carbonate cake onaverage of
300 Kg. However, the requiredcycle time of about 48 minutesneededto meet the Phase I rates maynot be feasible.
For LanthanumCarbonate, Centrifuges witha larger capacitymayneedto be exploredto keep the number of
centrifuges required andthe cycle timesper centrifuge to a minimum.
Subsequent to these two LanthanumCarbonate Trials, a visit bythe manufacturer of the centrifuges (ComiCondor)
was made to MountainPass. Much waslearnedfrom the representative from ComiCondor on how to feedthe
centrifuges and reduce the loading times and maximize the amount ofmaterial loaded. These teachings have been
appliedto the centrifuge operations for NDPR withmuchsuccessinachieving loadingrates andcycle times congruent
with Phase I ratesfor NDPR.