1. 1
Youth Audit(MissionHazaar):
Key Findings:
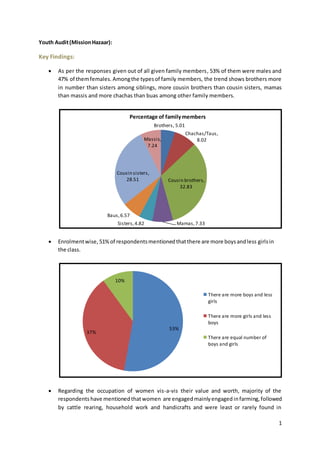
As per the responses given out of all given family members, 53% of them were males and
47% of themfemales. Amongthe typesof family members, the trend shows brothers more
in number than sisters among siblings, more cousin brothers than cousin sisters, mamas
than massis and more chachas than buas among other family members.
Enrolmentwise, 51%of respondentsmentionedthatthere are more boysandless girlsin
the class.
Regarding the occupation of women vis-a-vis their value and worth, majority of the
respondents have mentionedthatwomen are engagedmainlyengaged infarming,followed
by cattle rearing, household work and handicrafts and were least or rarely found in
Brothers, 5.01
Chachas/Taus,
8.02
Cousin brothers,
32.83
Mamas,7.33
Sisters,4.82
Baus,6.57
Cousin sisters,
28.51
Massis,
7.24
Percentage of familymembers
53%
37%
10%
There are more boys and less
girls
There are more girls and less
boys
There are equal number of
boys and girls
2. 2
occupationslike doctor/engineer,police woman,politician,panchayatmember,teacher and
sales woman.
The respondents mentioned that they see more men than women at Sadak, Kiryana shop,
Playing field, Panchayat meetings, Farm fields. Workplace wise, the respondents have
mentioned they see more men than women at Banks, police station and at panchayat.
4%
2% 1% 1%
1%
0%
14%
14%
17%
46%
Percentage of femalesengagedindifferentoccupations
Teacher/Principal
Doctor/Engineer
Police woman
Poitician
Panchayat member
Bus driver
Farming
Handicraft work
Cattle rearing
Household work
5324
6591
7706
8754
4979
654
1282
318 109
1272
0
1000
2000
3000
4000
5000
6000
7000
8000
9000
10000
Sadak Kiryana Shop Playing field Panchayat
meetings
Farm fields
More men More women
3. 3
66% of respondents mentioned they don’t women outside after it gets dark.
Summary of Findings:
The 10000 youth respondents from schools and colleges in the age group of (12-25) were
askedto mentionhow many brothers, sisters, cousin brothers, cousin sisters, paternal and
maternal uncles and aunts they have, and in aggregate terms out of all siblings and other
family members 53% of them are males and 47% of females.
While examininggenderdifferencesinfamilysize,boysmentionedtheyhave more brothers
than sisters while girls mentioned they have more sisters than brothers. This implies that
family size tend to be more for families having more girls than boys, as families are more
likely to stop having children when they have sons1
. A trend in sex ratio over generations
showsa decline infemaleratiocomparedtomales, like acase where from(Fmale:Male) 7:5,
3:7, 1:2 and 0:1, In another case the female male ratio mentioned was as 6:2 to 6:112
. This
signifies in aspiration to have sons more daughters were born.
Enrolmentwise,both male andfemalerespondents(53% of them) mentionedthatthere are
more boys and less girls in the class, while as just 10% of them saying there are equal
numberof boysand girls inthe class. The keyquestionisnotaboutdenyingeducationrights
of women and not sending them to school but do girls exist in equal number compared to
boys. Contrary, one of the reasons for higher female respondents is because girls are
enrolled more in government education institutions than private or professional ones as
parents prefer to invest more on boys than girls and think though girls can attain levels of
education yet should be less educated compared to their perspective husbands3
. They
furtherreiterate the factof underminingthe value andworthof women by saying it is more
important to send boys for higher education compared to girls and wives should be less
educated than their husbands4
.
1 J-PAL Baseline survey. GBSS Result Monitoring Report.
2 Gender profiling with older women (Genograms), GBSS Baseline Report, Praxis, 2013.
3 Gender Attitudes, J-PAL Baseline survey. GBSS Result Monitoring Report.
4 Some of socially perceived norms and beliefs include;considering boy as a social security by parents, source
of income and girls as liability and sons as sole heirs.
5575
7706
8699
879
179 130
0
1000
2000
3000
4000
5000
6000
7000
8000
9000
10000
Bank Police station Panchayat
More men More women
4. 4
Regarding the occupation of women vis-a-vis their value and worth, majority of the
responses have been about women engaged in farming, followed by cattle rearing,
handicrafts and household work. And very rarely other occupations like doctor/engineer,
police woman, politician, panchayat member, teacher and sales woman were mentioned.
Thiscoincideswiththe genderattitudes vis-a-vis their value and worth when said, that it is
importantto sendboysforhighereducationcompared to girls and should be less educated
compared to their prospective husbands5
. Both the youth audit data and J-PAL survey
highlights that girls are more engaged in household work and taking care of cattle while
boysare more engagedinoutside work,organisedandhigher wage work. It is important to
mention that communities more often mention that gender bias and discrimination was
prevalentinpastandwithchangingtime, people’smindsethave been influenced. Not only
this, communities more often say that both boys and girls get equal opportunities to work
and theirmobilityisnotatall restrictedorhindered,if so,thenwhywomenare mostly seen
occupied in unorganised sector. If so, then why two third of respondents mentioned they
don’t see women outside when it gets dark, why are less girls and more boys seen in class
rooms, why could there be only few women as panchayat members, doctors, drivers and
police women and why students mentioned are there more men than women on roads, in
playing fields, cinema halls and in farm fields. This also affirms the preference of parents
towards having sons than daughters as having girls gives them sense of insecurity given
safety issuesrelatedtowomen’smobilityand considering sons sense of security by having
sons to support their parents in their old age and sons seen as sole heirs.
5 IBID.