1. Manual for the Household Survey
to Measure Access and Use of Medicines
Table of Contents
1 Introduction.................................................................................................................. 3
2 Sampling....................................................................................................................... 3
2.1 Selecting survey locations........................................................................................................3
2.2 Selecting households ................................................................................................................4
2.3 Selecting an appropriate respondent......................................................................................5
3 Guidelines for completing household survey forms ...................................................... 5
3.1 General guidelines....................................................................................................................5
3.2 Guidelines for completing each question ...............................................................................5
4 Description of indicators of access to medicines, rational use of medicines, and
sampled population ............................................................................................................ 14
4.1 Indicators of Access to Medicines – Geographic Access.....................................................14
4.2 Indicators of Access to Medicines – Availability.................................................................14
4.3 Indicators of Access to Medicines – Affordability ..............................................................14
4.4 Indicators of Access to Medicines – Mixed Indicators .......................................................15
4.5 Indicators of Rational Use of Medicines ..............................................................................15
4.6 Indicators of Perception of Quality of Medicines and Delivery of Services .....................16
4.7 Characteristics of Sampled Households...............................................................................16
4.8 Characteristics of Respondents ............................................................................................16
4.9 Characteristics of Youngest Members with Acute Illness..................................................16
4.10 Characteristics of Oldest Members with Chronic Illness...................................................16
5 Calculation of indicators............................................................................................. 17
5.1 Access to Medicines................................................................................................................17
5.1.1 Geographic Access............................................................................................................17
5.1.2 Availability........................................................................................................................19
5.1.3 Affordability......................................................................................................................20
5.1.4 Mixed Indicators................................................................................................................24
5.2 Use of Medicines.....................................................................................................................26
5.2.1 Indicators of Rational Use of Medicines...........................................................................26
5.3 Perception of Quality.............................................................................................................30
5.3.1 Indicators of Perception of Quality of Medicines and Delivery of Services.....................30
6 Survey logistics and training....................................................................................... 31
2. 2
6.1 Selection of data collectors....................................................................................................31
6.2 Training data collectors.........................................................................................................32
6.3 Field testing ............................................................................................................................33
6.4 Preparation prior to data collectors training and survey visits.........................................33
7 Household Consent Form (Annex 1).......................................................................... 34
8 Household Survey Forms (Annex 2)........................................................................... 35
9 Worksheet of Household Expenditures Ranges (Annex 3) ......................................... 36
3. 1 Introduction
Indicators to measure access to medicines are most often obtained at health care facilities and
retail medicines outlets. Little information is available from end users of medicines. While
indicators measured at health care facility/provider level are useful, the household survey is an
important tool to obtain accurate information on how people obtain and use medicines.
WHO has developed a household survey that measures people’s access to and use of medicines
when faced with either acute or chronic illness. The questionnaire covers health-seeking
behavior, as well as source, availability, cost, affordability, and appropriate use of medicines. It
gathers information on household practices, as well as beliefs and other factors that influence the
decision to seek professional advice or to take medicines. Through this information, the
questionnaire provides important data on access to medicines in the community.
It is recommended to complete the household survey at a regular 2-3 year interval. Reports
should describe the reference population included in the sample. Details on household sampling
are discussed in Section 2.
For practical and logistical reasons, the household survey is implemented in conjunction with the
Level II indicator survey (see the WHO Operational Package for Monitoring and Assessing
Country Pharmaceutical Situations).
2 Sampling
The household survey is intended to be carried our in conjunction with a Level II health facilities
indicators survey. Reference health care facilities for the Level II survey are selected by
geographic area, and by level and capacity of health care facilities. The household survey
sample will consist of a certain number of households per reference health care facility. These
households will be selected purposively, according to their distance from the facility.
To simplify the logistics of the survey, households will not be selected randomly from a census
list, tax list, or other formal listing. Instead, data collectors will select clusters of households at a
given distance and in a given direction from the reference health facilities according to guidelines
described below. It is important to select households, which are reasonably representative of the
geographic areas studied in order to obtain survey estimates that are close to true population
values.
2.1 Selecting survey locations
The districts and reference public health care facilities that are included in the Level II survey
should have been randomly selected within defined geographic areas. The appropriate
methodology is described on pages 23-26 of the WHO Operational Packages for Monitoring and
Assessing Country Pharmaceutical Situations: Manual for Core Indicators on Country
Pharmaceutical Situations. The recommended sample of reference health facilities consists of 30
randomly selected public health care facilities distributed across 5 regions/districts.
4. 4
Thirty households will be interviewed around each reference health care facility, a total of 900
households. Assuming a design effect of 2.0 due to clustering (which would double the width of
the confidence interval and halve sample efficiency), this size sample will estimate most
percentage indicators in the entire survey sample with a 95% confidence interval of +/-
approximately 6%.
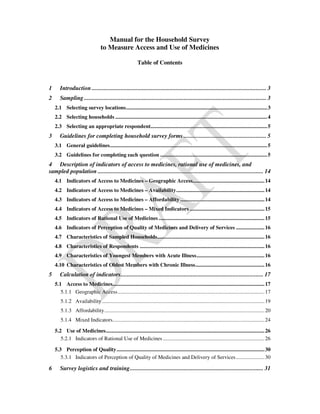
The quota sample of 30 households per facility should be divided into 6 clusters: ten households
(2 clusters of 5) should be selected within a 5 km radius from the facility, 10 households (2
clusters) between 5 and 10 km from the facility, and 10 households (2 clusters) more than 10 km
from the facility. Selection of the location of each cluster can be purposive, since it would be
impractical to randomly pick the location of individual clusters, especially in areas with low
population density. Beginning with the health facility as a central reference point, the clusters
should be divided such that they are in different directions, as illustrated in the figure below.
2.2 Selecting households
Within each cluster, select a random starting household at the required distance from the health
facility. Identify whether it is possible to interview an appropriate household informant (see
section 2.3). Not every household will be able to participate in the survey; in such cases, the next
household should be chosen as a replacement. After completing an interview (or scheduling one
for a later time), skip 2 or 3 households before selecting another household in the cluster. This
will minimize including too many households from the same extended family. If the sample is
selected in this way, the confidence intervals around estimates in the three subgroups of
households at each defined distance from the reference facilities (< 5 km, 5-10 km, >10 km)
should be approximately +/-10%.
Interviewers should be trained to use judgment in selecting the households and respondents for
the sample. General rules of thumb include:
• Households should not be next to each another;
• Households should not be excluded if respondents are not immediately present but an
appointment can be scheduled to interview them later in the same day;
Region
Households
<5km
5-10 km
>10 km
Facilities
5. 5
• Households should have an economic status that is generally representative of the area
in terms of dwelling condition, size, organization of the household premises, and
water supply.
2.3 Selecting an appropriate respondent
After introducing the survey in a given household, the interviewer should seek to identify the
best household informant or an appropriate substitute who meets at least three of the following
criteria:
• Main health care decision maker
• Most knowledgeable about health of household members
• Most knowledgeable about health expenditures of the household
• Most knowledgeable about health utilization by household members
• Designated care giver for sick household members
3 Guidelines for completing household survey forms
3.1 General guidelines
• The interviewer should explain the reason for the survey in simple, clear terms. Participation
in the survey is voluntary, and the respondent can refuse to be interviewed.
• Consent should be documented according to locally applicable standards for protection of
human subjects. In some cases, local community leaders will provide general consent.
When individual consent is required, each respondent will be asked to sign an Informed
Consent Form before starting the interview. A model form is provided in Annex 1. The
interviewer must check that the respondent has understood the form before signing it. If the
respondent is illiterate or unable to read the consent form (e.g. due to visual impairment), the
form should be read by the interviewer and explained to the respondent.
• Interviews with respondents will be face-to-face, in local language(s), using paper and pencil
questionnaires. Interviewers will read questions (and possible responses, if indicated) and
mark the respondent’s answers on the questionnaire. Responses may be verified by repeating
the answers or by asking the respondent to explain.
• The survey coordinator should check the completed household questionnaires.
3.2 Guidelines for completing each question
Before starting with the questionnaire, the interviewer should identify the household informant
(or appropriate substitute) , and then go through the Household Informant Consent Form (Annex
1) with the respondent. If the respondent agrees to participate and signs the Consent Form, the
interviewer should complete the top part of Household Survey Form. If the household informant
(or appropriate substitute) is not available or if the respondent does not want to answer questions,
the interview will stop and no questions will be asked.
6. 6
Some questions with numeric answers throughout the survey have spaces to record multiple
digits. For these questions, if a single digit answer is to be recorded, enter a 0 in the left space so
that all spaces are filled. For example, if the number of people living in a household is 3, enter
the response as: |0| |3|.
Q1. How many persons live in this household on a usual day?
Household members share resources together. A member of the household can be someone who
usually stays in the household, sleeps and shares meals there, who has that address as primary
place of residence, or who spends more than 6 months a year living there. Someone currently in a
hospital or other institution due to a health condition for a short-term stay would also be counted.
However, depending on the typical structure of households, each country can decide on the most
appropriate definition. Enter the number of household members in the open boxes. For example
if 6 persons live in the household, enter: |0| |6|.
Q2. How many children living in this household are a) under 5 years old, b) 5 years old and
older?
Enter the number of children who live in the household and belong to each age category in the
open boxes. The upper age limit for children 5 years old and older is country specific.
Q3. How much time does it take to reach the following health care facilities or providers?
Public facilities are those run with public funds from the government. NGO hospitals are run
with non-government funds (faith-based or other non-governmental organizations). A private
pharmacy is a facility that sells medicines, and where a pharmacist is available for advice. A drug
seller is any shop that sells medicines (e.g. market, store) but has no attending pharmacist. Read
one category at a time, and check the box that corresponds best to the respondent’s answer. If
there is no facility of a given type located in the area, tick the > 1 hour box. If there are more
than one facility of the same type, check distance to the closest one.
Q4. Has anyone in the household been ill in the past two weeks with an acute illness? An acute
illness is a condition that appears suddenly: the person did not have it immediately before
becoming ill.
If the respondent is not sure what an acute illness is, the interviewer may expand upon the
definition: “an acute illness is an illness with a sudden onset,” “a person with an acute illness
presents with complaints or signs that did not exist before,” or “an example of acute illness is
sudden fever in a healthy child.” It is important to keep the 2-week time limits, so that the
respondent remembers enough about the illness. If no one had an acute illness over the past two
weeks, tick “No” and skip to the next section of the survey starting at Question 18.
Q5. How many persons had an acute illness over the past two weeks?
There may have been several persons with an acute illness over the past two weeks (e.g., flu,
contagious disease). Enter the number of persons with an acute illness over the past two weeks in
the open boxes. If more that one person had an acute illness over the past two weeks, explain to
the respondent that the following questions are to be answered in relation to the youngest ill
person.
Q6. What is the age of the youngest person who was ill?
Enter the age of the youngest sick person and be sure to tick the unit in which you record age.
For example if the sick person was born 8 years ago enter |0| |8| before Years. If the youngest
sick person was born 8 months ago, enter |0| |8| before Months.
7. 7
Q7. What is the sex of the youngest person who was ill?
Document the sex of youngest person who was ill, not the sex of respondent.
Q8. What type of problems did this person have during the illness?
This question allows the respondent to describe the symptoms of the sickness episode.
Symptoms are loosely grouped by category or organ system. Do not read the responses. Let the
respondent describe the symptoms, and tick the category/organ system group (or groups) that is
closest to the respondent’s description. If the respondent cannot specify or recall the symptoms,
mark Do not know. If a respondent describes symptoms that you cannot classify, tick “Yes” for
Other and write the symptom next to Other.
Q9. How serious do you think the illness was?
The household informant is meant to assess the gravity/ severity of the acute illness. The opinion
of respondent is recorded, not that of interviewer or sick person.
Q10. At any point, did this person (or anybody else on his/her behalf) seek care for this illness
outside the home?
This question determines whether anyone in the household tried to access health care services
outside of those available at home for this illness. If the answer is “No,” skip to Question 12.
Q11. From which of the following sources of care did this person receive care at any time during
the illness?
See the description of the different facility types above in Question 3. Several facilities may
have been visited over the past two weeks because of this acute illness. Read one facility at a
time and tick the respondent’s answer for each facility.
Q12. Did he/she take any medicine during the acute illness, including medicines taken during
hospitalization?
Count medicines from any source, including those taken at home or those received during
hospitalization. If the answer is “No”, skip to Question 17 on why no medicine was taken.
Q13. Which medicines were taken during this illness?
This question may take time to answer if several medicines were taken during the illness. The
interviewer should emphasize that the purpose of this question is to collect detailed information
about all medicines taken for the acute illness only. The list of medicines should include those
recommended or prescribed by any source of care, including those taken at home without advice.
Record all medicines taken for the acute illness in Column A of the table, one on each row.
Include medicines used by self-medication and those advised by family members or neighbors
For each medicine mentioned by the respondent, there are seven questions to answer in that
medicine’s row. Avoid “cannot recall” responses; jog the respondent’s memory by asking
additional questions (e.g., tablet or syrup? what color? how many times taken?). Remember that
these questions are intended to aid memory and not bias responses.
Once the respondent names each medicine, ask the details about that medicine. Finish each row
from column A to D before going to the next row. Use codes provided in columns B to D to
document answers to questions. If several codes apply, write them in the corresponding cell. If
the code is 99, write 99 followed by the actual answer.
8. 8
In column A, record the name of the medicine. If the respondent cannot recall the name, ask to
see any of the medicine that remains. If the name is still unknown, ask the respondent to describe
the medicines by category (e.g., antibiotic, antimalarial, etc.) or by symptoms treated (e.g., for
fever, cough, etc).
In column B, record how the medicine was administered: oral (code 1: pills, tablets…), injection
(code 2), or other route of administration (code 99, and specify).
In column C, record who prescribed or recommended the medicine using the codes provided.
In column D, record where the medicine was obtained, using codes provided.
An example of how a completed row will look like is provided below. In this case, the
respondent already told you that her daughter had an ear infection last week. Now you ask which
medicines she took. The respondent says that the hospital doctor recommended giving the child
ABCD syrup morning and evening for 10 days. Medicine was obtained at the public hospital.
A B C D
Medicine 1 ABCD 1 4 3
Q14. How much did you pay for the medicines used to treat this acute illness?
Record how much was spent out-of-pocket (in local currency) for all medicines used to treat this
illness, subtracting any amount reimbursed/paid by insurance. Do not count the cost of medicines
already owned or not purchased for this illness. Write “0” if nothing was paid out-of-pocket.
Q15. Was this cost covered by health insurance?
‘Coverage’ includes planned reimbursements by the health insurance. Tick one of the three
options.
Q16. Did the sick person take all medicines that were recommended or prescribed?
Record whether all of the medicines recommended or prescribed were actually taken by the
patient. If the answer is “Yes”, skip to Question 18.
Q17. I am going to give you possible reasons why the sick person did not take medicines. Can
you tell me whether these were reasons why?
This question investigates why the sick person did not take the medicines as prescribed or
recommended during the acute illness. Read one statement at a time, and tick whether the
respondent agrees or disagrees with statement. The respondent may agree with several
statements.
Q18. Has anyone in the household ever been told by a doctor or other health care provider
that they have a chronic illness? A chronic illness is an illness that will not go awa or takes a
long time to go away, even when treated.
This question starts a new series focusing on chronic illnesses. If the respondent has completed
the section in acute illness, you should explain the shift in focus to the respondent by saying,
“We are done with discussing this acute illness. We are now going to talk about a different type
of illness…” If the respondent is not sure what a chronic illness is, your may expand upon the
definition: “a chronic illness is an illness that lasts a long time or is permanent,” “it is an illness
that may get slowly worse over time,” or “examples of chronic illnesses are high blood pressure,
diabetes, or HIV/AIDS.” Tick “No” if nobody in this household has ever been told by a doctor
or other health care provider that they have a chronic illness, and skip to the next section of the
questionnaire starting at Question 27.
9. 9
Q19. How many persons in the household have a chronic illness?
There may be several persons with a chronic illness in this household (e.g., one person with
diabetes, another with epilepsy, etc.). Enter the number of persons with a chronic illness in the
open boxes. If more that one person has a chronic illness, explain to the respondent that you are
interested only in the oldest person with a chronic illness and that the following questions are to
be answered in relation to that person.
Q20. What is the age of the oldest person with a chronic illness?
Record the age of the sick person in years. If age is below 10 years old, record a 0 in the first two
spaces and the age in the right space, e.g., |0| |0| |4|. If age is between 10 and 99, record a 0 in the
first space and the age in the remaining two spaces, e.g., |0| |3| |9|. If the person’s age is
unknown, write: |9| |9| |9|.
Q21. What is the sex of the oldest person with a chronic illness?
Document the sex of the oldest person with a chronic illness, not that of the respondent.
Q22. Which illness does he/she have?
This question allows the respondent to describe the chronic illness. Read one chronic disease at a
time and tick “Yes,” “No,” or “Doesn’t know” for each of them. If the respondent mentions a
disease that is not on the list, tick “Yes” for Other and briefly describe the disease.
Q23. Has this person been told by a doctor or other health care provider that he/she should be
taking medicines to treat this illness?
Some people with chronic illness might never have been told to take medicines. If the answer is
“No,” skip to Question 27 and start the next section.
Q24. Which medicines has he/she been told to take for this chronic disease and for any other
condition?
This question may take time to answer if the person takes several medications. The interviewer
should emphasize that the purpose of this question is to collect detailed information about
medicines taken a chronic illness. The list of medicines should include those recommended or
prescribed by any source of care, including those taken at home without advice.
Record all medicines taken for the chronic illness in Column A of the table, one medicine per
row. For each medicine mentioned by the respondent, there are five questions to answer in that
medicine’s row. Avoid "cannot recall” responses; jog the respondent’s memory by asking
additional questions (e.g., tablet or capsule? what color? how many times taken? etc). Remember
that these questions are intended to aid memory and not bias responses.
Once the respondent names each medicine, ask the details about the medicine. Finish each row
from column A to E before going to the next row. Use codes provided in columns B to E to
document answers to questions. If several codes apply, write them in the corresponding cell. If
the code is 99, write 99 followed by the actual answer.
In column A, record the name of the medicine. If the respondent cannot recall the name, ask to
see any of the medicine that remains. If the name is still unknown, ask the respondent to describe
the medicines by category (e.g., diuretic, corticoid, etc.) or by illness treated (e.g., for diabetes,
blood pressure, etc.).
10. 10
In column B, record condition treated by the medicine, using codes provided in Question 22. For
example, if chronic illness is a cancer, write “k”. If condition is unknown, write “X”.
In column C, record the number of days of supply usually purchased/obtained at a time.
In column D, record how much was spent out-of-pocket for the last month, in local currency,
subtracting any amount reimbursed/paid by insurance. Write “0” if nothing was paid out-of-
pocket for the medicines.
In column E tick “Yes” if the cost of the medicine for the past month was covered or was/will be
reimbursed by health insurance in total or in part, otherwise tick “No”.
An example of how a completed row will look like is provided below. In this case, the
respondent already told you that she suffers from epilepsy. She reports that a traditional healer
recommended taking an infusion of WXYZ once a week. She has been taking this infusion for
the past six months, and never forgets a dose. The infusion is obtained from the drug seller. She
buys 2 months worth of supply at a time, which costs a total of 4000 in local currency, and
insurance does not reimburse any of the cost.
A B C D E
Medicine 1 WXYZ g. 60 2000 No
The last row of Q24 is to be completed only if the cost of each medicine is not known. If that
is the case, write down the total usual cost for a month of medicines.
Q25. Some people cannot take all medicines as directed. Does he/she usually take all medicines
as recommended?
A critical component of treatment of chronic illnesses is the ability to take medicines for
prolonged periods of time without significant interruption. The question aims at usual practice,
not unusual, brief interruptions. If the answer is “Yes”, skip to the next section starting at
Question 27.
Q26. I am going to give you possible reasons why the sick person may not always take medicines
as recommended. Can you tell me whether these were reasons why he/she does not take
medicines?
This question investigates why the sick person did not usually take medicines for the chronic
illness as recommended. Read one statement at a time, and tick whether the respondent agrees or
disagrees with this statement. The respondent may agree with more than one statement.
Q27. Do you have any medicines available at home today?
Prompt the respondent to remember all medicines that might be present in the house, including
those purchased without a prescription. If the answer is no, tick “No” and skip to the next
section at Question 29.
Q28. Can I please see all of them?
This question may take time to answer if many medicines are present in the house. All the
medicines shown by the respondent should be recorded, one medicine on each row of the table.
If more than 11 medicines are present, ask the respondent to identify the ones that are most
frequently used and record information for them.
For each medicine recorded in column A, there are six questions to answer in that medicine’s
row. Go through medicines one at a time and complete columns A to E before going to the next
11. 11
medicine. Use codes provided in columns B to E to document answers. If several codes apply,
write them in the corresponding cell. If the code is 99, write 99 followed by the actual answer.
In column A, record the name of one medicine. Often, the name of medicine is written on the
label. If not, ask the respondent for the name. If the respondent cannot recall the name, ask the
respondent to describe the medicines by category (e.g., antibiotic, antimalarial, etc.) or by
symptoms treated (e.g., for fever, cough, etc).
In column B, record where the medicine was obtained, using codes provided.
In column C, record why the respondent keeps this medicine at home.
In column D, record information about the acceptability of the medicine’s label. Record that the
label is acceptable (Yes) only if you can identify the medicine name, dose, and expiration date.
Otherwise tick No.
In column E, record information about the acceptability of the medicine’s primary package.
Record that the primary package is acceptable (Yes) only if it is an envelope or a closable
container containing only one type of medicine. Otherwise tick No.
An example of how a completed row will look like is provided below. The respondent reports
that the medicine was bought at a private pharmacy a long time ago, does not remember the
name but recalls it had been recommended by a neighbor for body ache. Indeed the respondent
tells you that the medicine works very well, and has been used by several members of the
household since then. You see no label on this bottle and find that all the pills inside are
identical. You are able to close the bottle tightly.
A B C D E
Medicine 1 For body ache 7 2,3 No Yes
Q 29. – Q30. – Q 31. I am going to read you a series of opinions about access to care and
medicines (Q27), affordability of medicines (Q28), quality of care and medicines (Q29). There
are no correct answers. For each opinion, please tell me whether you agree or disagree.
Each of the three questions has an identical format, recording the respondent’s opinion on
different aspects of access to medicines. Read the first statement and then ask the respondent,
“Would you say that you agree or disagree with this statement?” Do not read the option “do not
know”. Tick it only if the respondent does not want to answer, or is unable to choose between
“agree” and “disagree”. Read each succeeding statement at a time and allow the respondent to
say what he/she thinks about the statement. Statements have been organized by topic.
Questions 32 to 35 investigate permanent income indicators.
Q32. Can you please tell me how many rooms there are in your home?
Record all rooms in the house, including all bathrooms, garage, anything that is a separate room.
Q33. – Q 34. – Q35. Does any one in your house have ….?
In Questions 33 & 35, permanent asset items have been left blank. These will be country specific,
and will be provided by your country coordinator before you start administering the survey in
your country. These items will be chosen to discriminate people of different social status. Signs
of private wealth vary from country to country. Depending on the country, examples of items
12. 12
may be a house, a piece of land, farm animals such as cows or poultry, “more than one bicycle”,
Items that need electricity are: refrigerator, tv, computer…
The goal is to find out whether or not the household (or a member of the household) possesses
assets that reflect social status. In questions requiring a yes/no answer, such as whether or not the
household possesses an item, it does not matter how many of that item the household may have.
Likewise, the condition of the item (for example if the item is a television, whether it is working
or not, no differentiation between color and black/white, record any TV) or its value is not of
interest.
Difficulties may arise if a household possesses a certain item that they say is borrowed, does not
belong to them, or is shared with other people outside the household. In such cases, explain to the
respondent that the key is whether or not the household has access to the asset in question on a
regular basis. For example, one member of a household may drive a taxi for work, which he or
she does not own. Since the household can use this taxi for transportation and other personal
needs, the correct response as to whether or not the household possesses a car would be “Yes”.
You should provide such explanation to the respondent only if asked. Otherwise, simply mark
the response and move on to the next question. It is not necessary for the respondent to show you
a particular object in order to confirm that they possess it.
Questions 36 to 39 investigate household expenditures. They have been adapted from the World
Health Survey (Household Questionnaire 0800: Expenditures).
The interviewer should not force consistency between the totals reported in one question and the
sum of answers in the others. All amounts are to be recorded in local currency. If the value was
paid in-kind, then the local currency value of the in-kind payment should be included.
Q36. In the last week, how much did your household spend on food including…:
The interviewer should substitute the country’s most common meal for “[rice]”. Food
expenditures include all food prepared and consumed by the household, along with food
purchased and consumed outside the household (e.g. snacks, bag lunches). However, they should
exclude meals at sit-down restaurants, and expenditures on alcohol or tobacco.
Q37. In the last 4 weeks, how much did your house in total:
In total:
Explain the respondent that total spending should include the value of all goods and services
consumed or used by the household, including food. Enumerate the components to respondent:
food, housing, health expenses, education bills, electricity, water, telephone, heating, gas, gifts….
This would include things produced by the household for its own consumption (e.g. eggs from
backyard chickens). It would exclude things purchased for use in a home business.
Then, use the worksheet of household expenditures ranges that has been provided by your
coordinator. On this worksheet, find out the row corresponding to the number of members living
in the household you are surveying. Read the five ranges on this row, and tick the one the
respondent believes is closer to total expenses of household.
Q38. Can you provide the total amount spent over the past four weeks?
This is a yes/no question. The respondent may not want or cannot answer this question. If that is
the case, tick “No”.
13. 13
Q39. In the last 4 weeks, how much did your household spend on….
For expenditures that may have been incurred on an annual, bi-annual, or periodic basis, etc..,
such health insurance premiums, but have not actually occurred in the past month, average
monthly costs should be apportioned to the appropriate category, if possible.
On medicines:
Ask how much is spent on medicines for the entire household during an average month.
Alternatively, the amount spent during any week of the current month may be used, as long as it
is multiplied by four to obtain the amount spent in four weeks. Include all medicines discussed
earlier or bought for acute or chronic treatment. This question should cover the cost of all
medicines taken by any member of the household for prevention, such as vitamins, or treatment
of acute or chronic illness.
Q40. What is your age?
Collecting an age range is sufficient. If the respondent gives his/her age, choose the appropriate age
category.
Question 41 investigates respondent’s education. It has been taken directly from the World
Health Survey (Individual Questionnaire 1009).
Q41. What is the highest level of school education you passed?
This refers to the highest level of education successfully completed. If a person attended 3
months of the first year of secondary school but did not complete the year, the option “Primary
school completed” will be recorded. If a person only attended a few years of primary school or
never went to school, the option “No formal schooling” will be recorded. The level of education
can either be completed at school or at home. This may be the case of someone who, due to
illness or other circumstances, does not attend school but has private tutoring or some other form
of schooling that requires taking exams in order to complete primary or secondary education.
Q42. Does anyone in your household earn money?
This question and the next question are meant to gain indirect information about the household
main income.
Q43. If yes, what is the job of the main earner in the household?
Read categories. Check one box for each category. The category “artisan” includes people who
live from art and crafts. The category “farmer” includes only the person who runs the farm. Other
people who work in a farm are under the category “agricultural labor”.
Before ending the interview, repeat to the respondent that all his/her answers will remain
confidential and will be used only for the purpose of understanding better how people use
medicines.
14. 4 Description of indicators of access to medicines, rational use of
medicines, and sampled population
4.1 Indicators of Access to Medicines – Geographic Access Sub-groups Questions
GA1
% respondents who have to travel > 1hr to reach the closest
healthcare facility
Any facility
By facility
3
GA2
% respondents who travelled > 1 hr to reach the healthcare
facility used for acute illness
3, 4, 11
GA3
% respondents who say that prescribed medicines were not taken
“because the place where medicines can be obtained was too far
away”
By illness
type
4, 12, 16,
17f, 18,
25, 26f
GA4
% respondents who agree that the location of their public
healthcare facility is convenient.
29a
GA5
% respondents who agree that opening hours of their public
healthcare facility are convenient
29b
4.2 Indicators of Access to Medicines – Availability Sub-groups Questions
AV1
% respondents who say that prescribed medicines were not taken
“because medicines were not available at the healthcare facility”
By illness
type
By facility
4, 12, 16,
17g, 17h,
18, 22,
25, 26g,
26h
AV2
% respondents who agree that medicines are available at their
public health care facility
29c
AV3
% respondents who agree that medicines are available at their
pharmacy
29d
4.3 Indicators of Access to Medicines – Affordability Sub-groups Questions
AF1
% HH whose monthly medicine expenditures represent at least >
20% of total expenditures
37, 39b
AF2
Average household medicine expenditures as % of total
expenditures
38, 39b,
AF3
Average household medicine expenditures as % of non-food
expenditures
38, 39a,
39b
AF4
Average household medicine expenditures as % of total health
expenditures
39a, 39b,
39c, 39d
AF5
Average annualized health expenditures per person By
healthcare
product type
1, 39a,
39b, 39c,
39d
AF6
Average HH medicine expenditures for a reported illness as a %
of total expenditures
By illness
type
4, 14, 18,
24D, 38
AF7
% HH with at least partial insurance coverage for at least one
medicine
By illness
type,
by coverage
4, 15, 18,
22, 24E
AF8
% respondents who say that prescribed medicines were not taken
“because HH cannot afford medicines”
By illness
type
4, 12, 16,
17j,18,
22, 25,
26j
15. 15
AF9
% respondents who can get free medicines at public health care
facility
30a
AF10
% respondents who agree medicines are more expensive at
private pharmacies
30b
AF11
% respondents who say they can get credit from the private
pharmacy
30c
AF12
% respondents who can usually afford to buy medicines they
need
30d
AF13
% respondents who agree that better insurance coverage would
increase their use of medicines.
30e
AF14
% respondents who have had to borrow money or sell things to
pay for medicines
30f
4.4 Indicators of Access to Medicines – Mixed Indicators Sub-groups Questions
M1 Average number of medicines at home 28A
M2 % HH with no medicines at home 27
M3 % HH who have children and have no medicines at home 2, 27
M4 % HH who have children <5 yo and have no medicines at home 2, 27
M5
% HH reporting a serious acute illness who sought care outside
but did not take any medicine
By gender 4, 7, 9,
10, 12
M6
% HH who do not have at home the medicines prescribed to a
chronically ill HH member
Overall, by
illness,
gender
18, 21,
24A,
28A
M7
% HH who usually obtain less than 30 days of medicines for a
member with chronic illness
24C
4.5 Indicators of Rational Use of Medicines Sub-groups Questions
RU1 % HH medicines taken for acute illness by category of providers
who recommended or prescribed them
4, 13C,
18
RU2 % HH medicines by source By illness 4, 13D,
18, 28C
RU3 % acute illnesses for which the class of medicines taken does not
reasonably match recalled symptoms
4, 8, 13A
RU4 % of acute illnesses treated with injections 4, 13B
RU5 % HH medicines with adequate label 28E
RU6 % HH medicines with adequate primary packaging 28F
RU7 % respondents who said prescribed medicines were not taken for
a reason related to acceptability (a, b, c, e, i in Q17 & Q26)
By illness 4, 12, 16,
17, 18,
22, 25,
26
RU8 % respondents who said prescribed medicines were not taken
because of previous side effects
By illness 4, 12, 16,
17d,
18, 22,
25 26d
RU9 % HH classes of medicines kept for future use 28D
RU10 % HH reporting a serious acute illness who did not seek care
outside and did not take medicines
By gender 4, 7, 9,
10, 12
RU11 % HH reporting a serious acute illness who sought care outside
but did not take all prescribed medicines
By gender 4, 9, 10,
16
16. 16
RU12 % HH with a chronically ill person who was never told to take
medicines
Overall, by
illness,
gender
18, 21,
22, 23
RU13 % HH with a chronically ill person who does not take
recommended medicines regularly
Overall, by
illness, by
gender
18, 21,
24, 25
4.6 Indicators of Perception of Quality of Medicines and Delivery of Services Questions
Q1 % respondents who agree that quality of services at their public healthcare
facility is good
31a
Q2 % respondents who agree that quality of services delivered by their private
provider is good
31b
Q3 % respondents who agree that brand name medicines are better than generics 31c
Q4 % respondents who agree that imported medicines are of better quality than
locally manufactured medicines
31d
4.7 Characteristics of Sampled Households Questions
SHH1 Average number of members per HH 1
SHH2 Average number of rooms per HH 32
SHH3 % HH with a certain asset 33, 35
SHH4 % HH with electricity, running water, and own toilet 34
SHH4 % HH reporting at least one acute illness 4
SHH5 % HH reporting at least one chronic illness 18
SHH6 % HH reporting at least one acute and one chronic illness 4, 18
SHH7 % HH reporting no illnesses 4, 18
SHH8 % HH with no one earning money 42
SHH9 % HH located at a certain distance from the reference health care facility 0
SHH10 Average number of acute illnesses per HH 5
SHH11 Average number of chronic illnesses per HH 19
4.8 Characteristics of Respondents Questions
R1 % female respondents 0
R2 % respondents in a certain category of age 40
R3 % respondents who reached a certain level of education 41
4.9 Characteristics of Youngest Members with Acute Illness Questions
YA1 Average age 6
YA2 % females 7
YA3 % acute illnesses, by category of symptoms 8
YA4 % of perceived severe acute illnesses 9
4.10 Characteristics of Oldest Members with Chronic Illness Questions
OC1 Average age 20
OC2 % females 21
OC3 % chronic illnesses by disease 22
17. 5 Calculation of indicators
Indicators at the household level measure key aspects of access to and use of medicines.
Geographic accessibility, availability, as well as affordability all contribute to access to
medicines. Use of medicines depends among other things on acceptability of medicines, quality
of care, and the perceived benefits of medicines.
Some indicators measure only one dimension (geographic access, affordability,…). Other
indicators measure a mix of factors. For example, indicators that evaluate where households go
for consultation, where they purchase medicines, or how much of the recommended medicines
are obtained and used, measure several determinants of access and use.
Indicators constructed from this household survey may be calculated at several levels: average of
all the households around one reference facility, average of all households in one district, or
national average of all households. Alternatively, the focus may be on all households located
within 5 km, 5-10 km, or > 10 km of the reference facilities.
Because of the richness and complexity of the data collected by this survey, it is recommended to
carefully define which groups of interest are the most relevant to a given situation before diving
into calculations. Once the groups of interest have been defined, the indicators can be measured
for those groups. Each indicator defined in this manual can be calculated for the following
groups of interest:
All households in the country
All households in a district
All households associated with a given reference facility
All households located within a specific distance of reference facilities in the country
All households located within a specific distance of reference facilities in a district
5.1 Access to Medicines
5.1.1 Geographic Access
5.1.1.1 Percent of households who have to travel more than 1 hour to reach the closest
public health care facility (public hospital, public health care center/ dispensary,
any)
Rationale To measure the distance to public health care facilities. Living far away from
a public health care facility may impact access to medicines.
Source of data HH survey – Q3a, Q3.c
Prerequisite Select the group of interest.
Computation Number of households in the group of interest answering “ 1 hr” to Q3.a
(public hospital), Q3.c (public health center or dispensary), or Q3.a and Q3.c
(any) ÷ number of households in the group of interest x 100
Expressed as Percent households in a group of interest located at 1 hr from the closest
public health care facility (public hospital, public health care center or
dispensary, any).
18. 18
5.1.1.2 Percent of households who have to travel more than 1 hour to reach the closest
medicine retailer (private pharmacy, drug seller)
Rationale To measure the distance to medicine retailers from households. Living far
away from a medicine retailer may impact access to medicines.
Source of data HH survey – Q3.f, Q3.g
Prerequisite Select the group of interest.
Computation Number of households in the group of interest answering 1 hr” to Q3.f
(private pharmacy), or Q3.g (drug seller) ÷ number of households in the
group of interest x 100
Expressed as Percent households in a group of interest that are located 1 hr from a
medicine retailer (private pharmacy, drug seller)
5.1.1.3 Percent of households who traveled more than 1 hour to obtain the medicine
used for acute illness
Rationale To measure distance from the actual source of medicines. Having to travel
more than 1 hour to obtain medicines may impact access to medicines.
Source of data HH survey – Q3, Q4, Q13.D
Prerequisite Select the adjusted group of interest.
In the group of interest, keep in the computation only households answering
“Yes” to Q4. Then, in this group, keep only households answering at least
one row of Q13.D to obtain the “adjusted acute group”
Computation Number of households in the adjusted group answering 1 hr to Q.3 for the
facility listed on Q13.F ÷ number of households in the adjusted group x 100
Expressed as Percent households in a group of interest who traveled more than 1 hour to
reach the point of distribution of medicines prescribed for an acute illness
5.1.1.4 Percent of respondents who say that distance from source of medicines is a
reason for not taking a medicine as prescribed for a reported illness (acute,
chronic, by illness)
Rationale To measure geographic access as a perceived barrier to access to needed
medicines.
Source of data HH survey – Q4, Q12, Q16, Q17.f, Q18, Q22, Q25, Q26.f
Prerequisite Select the adjusted group of interest.
Acute: In the selected group of interest, keep in the computation only
households answering “No” to Q12 or Q16 to obtain the “adjusted acute
group”.
Chronic: In the selected group of interest, keep in the computation only
households answering “No” to Q25 to obtain the “adjusted chronic group”.
By illness: In the selected group of interest, keep in the computation only
households that answered “No” to Q25 where a particular chronic illness is
reported (Q22) to obtain the “adjusted by illness group”.
Computation Number of households in the adjusted group who agree with (Q17.f, Q26.f) ÷
number of households in the adjusted group (acute, chronic, by illness) x 100
Expressed as Percent households in a group of interest who agree that distance from source
of medicines was a reason for not taking medicines as prescribed for a
reported illness (acute, chronic, by illness).
19. 19
5.1.1.5 Percent of respondents who agree that location of public health care facilities is
convenient
Rationale Perception about convenience of health care facilities may influence
utilization and access to medicines
Source of data HH survey – Q29.a
Prerequisite Select the group of interest.
Computation Number of households who agree and strongly agree with Q29.a ÷ number of
households in the group of interest x 100
Expressed as Percent of respondents in a group of interest who agree that location of public
health care facilities is convenient.
5.1.1.6 Percent of respondents who agree that opening hours of public health care
facilities are convenient
Rationale Perception about convenience of opening hours may influence utilization and
access to medicines
Source of data HH survey – Q29.b
Prerequisite Select the group of interest.
Computation Number of respondents who disagree or strongly disagree with Q29.b ÷
number of households in the group of interest x 100
Expressed as Percent of respondents in a group of interest who agree that opening hours of
public health care facilities are convenient.
5.1.2 Availability
5.1.2.1 Percent of respondents who say that lack of availability of medicines at point of
distribution (public health care facility, private pharmacy or drug seller) is a
reason for not taking medicines as prescribed for a reported illness (acute,
chronic, by illness)
Rationale To measure perception about availability of medicines.
Source of data HH survey – Q4, Q12, Q16, Q17.g, Q17.h, Q18, Q22, Q25, Q26.f, Q26.h,
Prerequisite Select the adjusted group of interest.
Acute: In the selected group of interest, keep in the computation only
households answering “No” to Q12 or Q16 to obtain the “adjusted acute
group”.
Chronic: In the selected group of interest, keep in the computation only
households answering “No” to Q25 to obtain the “adjusted chronic group”.
By illness: In the selected group of interest, keep in the computation only
households that answered “No” to Q25 where a particular chronic illness is
reported (Q22) to obtain the “adjusted by illness group”.
Computation Number of households in the adjusted group (acute, chronic, by illness) who
agree with Q17.g or Q26.g. (public facilities), Q17.h or Q26.h (medicine
retailers) ÷ number of households in the adjusted group x 100
Expressed as Percent households in a group of interest respondents who agree that lack of
availability of medicines at point of distribution (public health care facility,
private pharmacy or drug seller) is a reason for not taking medicines as
prescribed for a reported illness (acute, chronic, by illness)
20. 20
5.1.2.2 Percent of respondents who agree that medicines are available at point of
distribution (public health care facility)
Rationale Perceived availability of medicines in health care facilities may be a barrier to
utilization and access
Source of data HH survey – Q29.c
Prerequisite Select the group of interest.
Computation Number of respondents who agree or strongly agree with Q29.c (public
health care facilities) ÷ number of households in the group of interest x 100
Expressed as Percent of respondents in a group of interest who agree that medicines are
available at point of distribution (public health care facility)
5.1.2.3 Percent of respondents who agree that medicines are available at point of
distribution private pharmacy)
Rationale Perceived availability of medicines in health care facilities may be a barrier to
utilization and access
Source of data HH survey – Q29.d
Prerequisite Select the group of interest.
Computation Number of respondents who agree or strongly agree with Q29.d (private
pharmacy), ÷ number of households in the group of interest x 100
Expressed as Percent of respondents in a group of interest who agree that medicines are
available at point of distribution (private pharmacy).
5.1.3 Affordability
5.1.3.1 % Households whose monthly medicine expenditures represent at least 20%
of total expenditures
Rationale To determine the overall financial burden of medicines on households
Source of data HH survey – Q37, Q39.b
Prerequisite Select the group of interest.
Computation Number of households who spend for medicines an amount (Q39.b) higher
than 20% of superior limit of range checked in Q37 ÷ number of households
in the group of interest x 100
Expressed as Percent of total household expenditures spent on medicines in a group of
interest.
5.1.3.2 Average household medicine expenditures as percent of total expenditures
Rationale To determine the overall financial burden of medicines on households
Source of data HH survey – Q38, Q39.b
Prerequisite Select the group of interest.
Computation Sum (Q39.b ÷ Q38) for each household in the group of interest ÷ number of
households in the group of interest x 100
Expressed as Percent of total household expenditures spent on medicines in a group of
interest.
5.1.3.3 Average household medicine expenditures as percent of non-food expenditures
Rationale To determine the financial burden of medicines as a proportion of non-food
(discretionary) expenditures in households
Source of data HH survey – Q36, Q38, Q39.b
21. 21
Prerequisite Select the group of interest.
Computation Subtract Q36 from Q38 to obtain non-food expenditures. Sum (Q39.b ÷ non-
food expenditures) for each household in the group of interest ÷ number of
households in the group of interest x 100
Expressed as Percent of non-food household expenditures spent on medicines in a group of
interest.
5.1.3.4 Average household medicine expenditures as percent of total health
expenditures
Rationale To determine the financial burden of medicines as a proportion of health
expenditures in households
Source of data HH survey – Q39.a, Q39.b, Q39.c, Q39.d
Prerequisite Select the group of interest.
Computation Sum (Q39.a, Q39.b, Q39.c, Q39.d) for each household in the group of interest
÷ number of households in the group of interest x 100
Expressed as Percent of total household health expenditures spent on medicines in a group
of interest.
5.1.3.5 Average annualized health expenditures per person
Rationale To determine the annual level of health expenditures per person
Source of data HH survey – Q1, Q39.a, Q39.b, Q39.c, Q39.d
Prerequisite Select the group of interest.
Computation [(Sum(Q39.a, Q39.b, Q39.c, Q39.d) x 13) ÷ Q1] for each household in the
group of interest] ÷ number of households in the group of interest
Expressed as Average annualized health expenditures per person in a group of interest.
5.1.3.6 Average annualized medicine expenditures per person
Rationale To determine the annual level of medicine expenditures per person
Source of data HH survey – Q1, Q39.b
Prerequisite Select the group of interest.
Computation [Sum ((Q39.b x 13) ÷ Q1) for each household in the group of interest] ÷
number of households in the group of interest
Expressed as Average annualized medicine expenditures per person in a group of interest.
5.1.3.7 Average household medicine expenditures for a reported illness (acute, chronic,
by illness) as percent of total expenditures in a 4-week period
Rationale To determine financial burden of expenditures on medicines for a reported
illness
Source of data HH survey – Q4, Q18, Q22, Q24.D, Q 38
Prerequisite Select the adjusted group of interest.
Acute: In the selected group of interest, keep in the computation only
households who answer “Yes” to Q4.
Chronic: In the selected group of interest, keep in the computation only
households who answer “Yes” to Q18. Then calculate the total spent for
medicines related to the chronic illness by adding up the values of all Q24.G
22. 22
cells to obtain “adjusted chronic group”.
By illness: In the selected group of interest, include in the computation only
households that answered “Yes” to Q16 where a particular chronic illness is
reported (Q22). Then calculate the total spent on medicines used to treat this
particular chronic illness by adding up the values of these medicines from
Q.24.G to obtain “total by illness group”.
Computation Acute: Sum (total Q18 ÷ Q38 for each household in the adjusted group) x 2 ÷
number of households in the adjusted group x 100
Chronic, by illness: Sum (total Q24.D ÷ Q38 for each household in the
adjusted group of interest) ÷ number of households in the adjusted group x
100
Expressed as Expenditures on medicines for a reported illness (acute, chronic, by illness) in
a group of interest as a percent of total household expenditures during the
previous 4 weeks.
5.1.3.8 Percent of households with insurance coverage for any of the medicines
prescribed for a reported illness (acute, chronic, by illness)
Rationale To determine the extent of insurance coverage of medicines in households
Source of data HH survey – Q4, Q15, Q18, Q22, Q24.E,
Prerequisite Select the adjusted group of interest.
Acute: In the selected group of interest, keep in the computation only
households answering at least one row of Q13 to obtain the “adjusted acute
group”.
Chronic: In the selected group of interest, keep in the computation only
households answering at least one row of Q24 to obtain the “adjusted chronic
group”.
By illness: In the selected group of interest, include in the computation only
households that answered at least one row of Q24 where a particular chronic
illness is reported (Q22) to obtain the “adjusted by illness group”.
Computation Acute: Number of households in the adjusted group answering “yes, entirely”
or “part of it was covered” to Q15 ÷ number of households in the adjusted
group x 100
Chronic, by illness: Number of households with any “Yes” answer in column
24.E in the adjusted group ÷ number of households in the adjusted group x
100
Expressed as Percent of total households in a group of interest with any insurance coverage
for medicines used in a reported illness (acute, chronic, by illness).
5.1.3.9 Percent of respondents who say that price is a reason for not taking medicines
prescribed for a reported illness (acute, chronic, by illness)
Rationale To measure cost as a barrier to medicines access.
Source of data HH survey – Q4, Q12, Q16, Q17.j, Q18, Q22, Q25, Q26.j
Prerequisite Select the group of interest.
Acute: In the selected group of interest, keep in the computation only
households answering “No” to Q12 or Q16 to obtain the “adjusted acute
group”.
Chronic: In the selected group of interest, keep in the computation only
23. 23
households answering “No” to Q25 to obtain the “adjusted chronic group”.
By illness: In the selected group of interest, only households that answered
“No” to Q25 where a particular chronic illness is reported (Q22) are included
in the computation to obtain the “adjusted by illness group”.
Computation Acute: Number of households in the adjusted group who agree with Q17.j ÷
number of households in the adjusted group x 100
Chronic, by illness: Number of households in the adjusted group who agree
with Q26.j ÷ number of households in the adjusted group x 100
Expressed as Percent of households in a group of interest that report cost as a reason for not
taking medicines as prescribed for a reported illness (acute, chronic, by
illness)
5.1.3.10 Percent of households who can get free medicines at public health care facilities
Rationale Free medicines may increase access
Source of data HH survey – Q30.a
Prerequisite Select the group of interest.
Computation Number of respondents in the selected group who agree and strongly agree
with Q30 ÷ number of households in the group of interest x 100
Expressed as Percent of respondents in a group of interest who report that free medicines
are available at public health care facilities.
5.1.3.11 Percent of households who agree that medicines are more affordable at public
health care facilities than at private pharmacies
Rationale Perception about affordability may influence utilization
Source of data HH survey – Q30.b
Prerequisite Select the group of interest.
Computation Number of respondents in the selected group who agree and strongly agree
with Q30.b ÷ number of households in the group of interest x 100
Expressed as Percent of respondents in a group of interest who agree that medicines are
more affordable at public health care facilities than at private pharmacies.
5.1.3.12 Percent of households who can get credit for medicines at medicine retailers
(private pharmacies)
Rationale Possibility of getting credit to buy medicines may influence patterns of
utilization and access
Source of data HH survey – Q30.c
Prerequisite Select the group of interest.
Computation Number of respondents in the selected group who agree and strongly agree
with Q30.c ÷ number of households in the group of interest x 100
Expressed as Percent of respondents in a group of interest who agree that credit for
medicines is available at medicines retailers (private pharmacy, drug seller).
5.1.3.13 Percent of households who can usually afford to buy all medicines they need
Rationale Perceptions about affordability of medicines may influence patterns of
utilization
Source of data HH survey – Q30.d
24. 24
Prerequisite Select the group of interest.
Computation Number of respondents in the selected group who agree and strongly agree
with Q30.d ÷ number of households in the group of interest x 100
Expressed as Percent of respondents in a group of interest who agree that medicine
insurance coverage would increase utilization.
5.1.3.14 Percent of households who agree that medicine insurance coverage would
increase medicine use
Rationale Perceptions about insurance coverage for medicines may influence propensity
to join risk sharing arrangements
Source of data HH survey – Q308.e
Prerequisite Select the group of interest.
Computation Number of respondents in the selected group who agree and strongly agree
with Q30.e ÷ number of households in the group of interest x 100
Expressed as Percent of respondents in a group of interest who agree that medicine
insurance coverage would increase utilization.
5.1.3.15 Percent of households who had to borrow money or sell assets in the past to pay
for medicines
Rationale To assess how the cost of medicines affects household economic status and
poverty risk
Source of data HH survey – Q30.f
Prerequisite Select the group of interest.
Computation Number of respondents in the selected group who agree and strongly agree
with Q30.f ÷ number of households in the group of interest x 100
Expressed as Percent of respondents in a group of interest who report having sold assets in
the past to pay for medicines.
5.1.4 Mixed Indicators
5.1.4.1 Average number of medicines at home
Rationale To investigate aspects of access to and use of medicines at home
Source of data HH survey – Q28.A
Prerequisite Select the group of interest.
Computation Sum of number of medicines listed in Q28.A in the group of interest ÷
number of households the group of interest x 100
Expressed as Average number of medicines stored at home in a group of interest
5.1.4.2 Percent of households with no medicines at home
Rationale To investigate aspects of access to and use of medicines at home
Source of data HH survey – Q27
Prerequisite Select the group of interest.
Computation Number of households answering “No” to Q27 in the group of interest ÷
number of households in the group of interest x 100
Expressed as Percent of households in a group of interest with no medicines stored at
home
25. 25
5.1.4.3 Percent of households with children and no medicines at home
Rationale To investigate aspects of access to and use of medicines at home
Source of data HH survey – Q2, Q27
Prerequisite Select the group of interest.
Computation Number of households with children ( 5yo, 5 yo and older) answering
“No” to Q27 in the group of interest ÷ number of households in the
group of interest x 100
Expressed as Percent of households in a group of interest with no medicines stored at
home
5.1.4.4 Percent of households reporting an acute serious illness who sought care
outside the home but did not take any medicines
Rationale To assess access to medicines among those who sought care at the time
of a serious acute illness
Source of data HH survey – Q4, Q7 (analysis by gender) Q9, Q10, Q12
Prerequisite Select the adjusted group of interest.
In the selected group of interest, keep in the computation only
households answering “Yes” to Q4 and “serious” or “somewhat serious”
to Q9 to obtain the “adjusted group”
Computation Number of households in the adjusted group who answered “Yes” to
Q10 and “No” to Q12 ÷ number of households in the adjusted group x
100
Expressed as Percent of households in a group of interest reporting a serious acute
illness who sought care outside the home but did not take any medicines
5.1.4.5 Percent of households who do not have at home the medicines prescribed to a
chronically ill household member (overall, by chronic illness)
Rationale To investigate current access to and use of medicines in chronic
illnesses
Source of data HH survey – Q18, Q24, Q28
Prerequisite Select the adjusted group of interest.
Overall: In the selected group of interest, keep in the computation only
households answering “Yes” to Q18 to obtain the “adjusted overall
group”.
By illness: In the selected group of interest, keep in the computation
only households that answered “Yes” to Q18 where a particular chronic
illness is reported in Q22 to obtain the “adjusted by illness group”
Computation Overall: Number of households in the adjusted group who do not have
at home (Q28) a medicine prescribed for a chronic illness (Q24) ÷
number of households in the adjusted group x 100
By illness: Number of households in the adjusted group who do not
have at home (Q28) a medicine prescribed for a chronic illness (Q24) ÷
number of households in the adjusted group x 100
Expressed as Percent of households in a group of interest where a chronically ill
person who do not have at home the medicines prescribed to a
chronically ill household member (overall, by chronic illness)
26. 26
5.1.4.6 Percent of households who usually obtain less than 30 days of supply of a
medicine for a chronically ill household member
Rationale To investigate current access to and use of medicines in chronic
illnesses. People who obtain small quantities of medicines for chronic
illness are less likely to take their treatment regularly
Source of data HH survey – Q18, Q24C,
Prerequisite Select the adjusted group of interest.
In the selected group of interest, keep in the computation only
households answering “Yes” to Q18 to obtain the “adjusted overall
group”.
Computation Number of households in the adjusted group who usually obtain less
than 30 days supply of a medicine prescribed for a chronic illness
(Q24C) ÷ number of households in the adjusted group x 100
Expressed as Percent of households in a group of interest where a chronically ill
person who usually obtain less than 30 days of supply of a medicine
prescribed to a chronically ill household member
5.2 Use of Medicines
5.2.1 Indicators of Rational Use of Medicines
5.2.1.1 Percent of medicines taken for acute illness by category of person who
prescribed or recommended them
Rationale To investigate who prescribed or recommended medicines used for
acute illness
Source of data HH survey –Q13.C
Prerequisite Select the group of interest.
Computation Sum of number of medicines coded C1 (self), or C2 (household
member), or C3 (friend, neighbor), or C4 (doctor, health care provider),
or C5 (traditional healer), or C6 (pharmacist), or C7 (drug seller) in
/Q13C in the group of interest ÷ total number of medicines listed in Q13
in the group of interest x 100
Expressed as Percent of household medicines by different possible prescribers or
recommenders of medicines in a group of interest
5.2.1.2 Percent of household medicines from different sources
Rationale To investigate the relative importance of different sources of medicines
to households
Source of data HH survey – Q4, Q13, 18, Q28.C
Prerequisite Select the group of interest.
Computation Sum of number of medicines coded C1 (family friend), or C2 (public
hospital), or C3 (private or NGO hospital), or C4 (public health center
or dispensary), or C5 (private health care provider), or C6 (traditional
healer), or C7 (private pharmacy), or C8 (drug seller) in Q13/Q28.C in
the group of interest ÷ total number of medicines listed in Q13/Q28 in
the group of interest x 100
Expressed as Percent of household medicines obtained from different sources in a
group of interest
27. 27
5.2.1.3 Percent of acute illnesses for which the class of medicines taken does not
reasonably match recalled symptoms
Depending on data.
5.2.1.4 Percent of persons with acute illness who were treated with injections
Rationale To evaluate one aspect of rational use of medicines
Source of data HH survey – Q4, Q13.B,
Prerequisite Select the adjusted group of interest.
In the selected group of interest, keep in the computation only households
answering “Yes” to Q4 to obtain the “adjusted acute group”.
Computation Acute: Number of households in the adjusted group with at least one “2”
answer to 13.B ÷ number of households in the adjusted group x 100
Expressed as Percent total households in a group of interest who report receiving an
injection to treat an acute illness.
5.2.1.5 Percent of household medicines with adequate label
Rationale To investigate on aspect of rational use of medicines and quality of care
Source of data HH survey – Q28.E
Prerequisite Select the group of interest.
Computation Sum of (number of medicines coded “1” in Q28.F ÷ number of
medicines listed in Q28 in each household) ÷ number of households in
the group of interest) x 100
Expressed as Percent of household medicines with correct label in a group of interest
5.2.1.6 Percent of household medicines with adequate primary packaging
Rationale To investigate one aspect of rational use of medicines and quality of
care
Source of data HH survey – Q28.F
Prerequisite Select the group of interest.
Computation Sum of (number of medicines coded “1” in Q28.G ÷ number of
medicines listed in Q28 in each household) ÷ number of households in
the group of interest x 100
Expressed as Average number of household medicines with adequate primary
package in a group of interest
5.2.1.7 Percent of respondents who say that sick person/care giver decided against
taking medicines as prescribed for an illness (acute, chronic, by illness) for one
or more reasons related to acceptability
Rationale To measure how acceptability may influence medicine utilization.
Source of data HH survey – Q4, Q12, Q16, Q17.a, Q17.b, Q17.c, Q17.e, Q17.i, Q18, Q22,
Q25, Q26.a, Q26.b, Q26.c, Q26.e, Q26.i
Prerequisite Select the adjusted group of interest.
Acute: In the selected group of interest, keep in the computation only
households answering “No” to Q12 or Q16 to obtain the “adjusted acute
group”.
Chronic: In the selected group of interest, keep in the computation only
households answering “No” to Q25 to obtain the “adjusted chronic group”.
By illness: In the selected group of interest, keep in the computation only
28. 28
households where a particular chronic illness is reported (Q22) that answered
“No” to Q23 to obtain the “adjusted by illness group”.
Computation Acute: Number of households in the adjusted group who agree with Q17.a,
Q17.b, Q17.c, Q17.e, or Q17.i ÷ number of households in the adjusted group
x 100
Chronic, by illness: Number of households in the adjusted group who agree
with Q26.a, Q26.b, Q26.c, Q26.e, or Q26.i ÷ number of households in the
adjusted group of interest x 100
Expressed as Percent respondents in a group of interest who agree that poor acceptability
was a reason for not taking medicines as prescribed for a reported illness
(acute, chronic, by illness)
5.2.1.8 Percent of respondents who agree that previous side effects is a reason for not
taking a medicine as prescribed for a reported illness (acute, chronic, by illness)
Rationale To measure how tolerability influence medicine utilization.
Source of data HH survey – Q4, Q12, Q16, Q17.d, Q18, Q253, Q26.d
Prerequisite Select the adjusted group of interest.
Acute: In the selected group of interest, keep in the computation only
households answering “No” to Q12 or Q16 to obtain the “adjusted acute
group”.
Chronic: In the selected group of interest, keep in the computation only
households answering “No” to Q25 to obtain the “adjusted chronic group”.
By illness: In the selected group of interest, only households where a
particular chronic illness is reported (Q22) are included in the computation to
obtain the “adjusted by illness group”.
Computation Acute: Number of households in the adjusted group who agree with Q17.d ÷
number of households in the adjusted group x 100
Chronic, by illness: Number of households in the adjusted group who agree
with Q26.d ÷ number of households in the adjusted group x 100
Expressed as Percent households in a group of interest who agree that past side effects was
a reason for not taking medicines as prescribed for a reported illness (acute,
chronic, by illness).
5.2.1.9 Percent of antibiotics kept for future use
Rationale To investigate aspects of rational use of medicines available at home
Source of data HH survey – Q28.A, Q28.E
Prerequisite Select the group of interest.
Computation Sum of number of medicines listed as antibiotics (by name or for
infection) in Q28.A that are coded 3 in Q28.E in the group of interest ÷
total number of medicines listed in Q26 in the group of interest x 100
Expressed as Percent of antibiotics kept for future use in a group of interest
5.2.1.10 Percent of antimalarials kept for future use
Rationale To investigate aspects of rational use of medicines available at home
Source of data HH survey – Q28.A, Q28.E
Prerequisite Select the group of interest.
29. 29
Computation Sum of number of medicines listed as antimalarials (by name or for
fever) in Q28.A that are coded 3 in Q28.E in the group of interest ÷ total
number of medicines listed in Q28 in the group of interest x 100
Expressed as Percent of antimalarials kept for future use in a group of interest
5.2.1.11 Percent of households reporting a serious acute illness who did not seek care
outside the home and did not take any medicines
Rationale To assess access to medicines among those who did not seek care at the
time of a serious acute illness
Source of data HH survey – Q4, Q7 (analysis by gender), Q9, Q10, Q12
Prerequisite Select the adjusted group of interest.
In the selected group of interest, keep in the computation only
households answering “Yes” to Q4 and “serious” or “somewhat serious”
to Q9 to obtain the “adjusted group”
Computation Number of households in the adjusted group who answered “No” to
Q10 and Q12 ÷ number of households in the adjusted group x 100
Expressed as Percent of households in a group of interest reporting a serious acute
illness who did not seek care outside and did not take medicines
5.2.1.12 Percent of households reporting an acute serious illness who sought care
outside the home but did not take all medicines as prescribed
Rationale To assess appropriate use of medicines among those who had access to
medicines at the time of a serious acute illness
Source of data HH survey – Q4, Q7 (analysis by gender), Q9, Q10, Q12, Q16
Prerequisite Select the adjusted group of interest.
In the selected group of interest, keep in the computation only
households answering “Yes” to Q4 and “serious” or “somewhat serious”
to Q9 to obtain the “adjusted group”
Computation Number of households in the adjusted group who answered “Yes” to
Q10, “Yes” to Q12, and “No” to Q16 ÷ number of households in the
adjusted group x 100
Expressed as Percent of households in a group of interest reporting a serious acute
illness who sought care outside the home and obtained some medicines
but did not take all medicines as prescribed
5.2.1.13 Percent of households with a chronically ill person who was never told to take
medicines (overall, by illness)
Rationale To investigate overall access to care and medicines for chronic illnesses
Source of data HH survey - Q18, Q22, Q23
Prerequisite Select the adjusted group of interest.
Overall: In the selected group of interest, keep in the computation only
households answering “Yes” to Q18 to obtain the “adjusted overall
group”.
By illness: In the selected group of interest, keep in the computation
only households that answered “Yes” to Q18 where a particular chronic
illness is reported in Q22 to obtain the “adjusted by illness group”.
Computation Number of households in the adjusted group who answered “No” to
30. 30
Q23 ÷ number of households in the adjusted group x 100
Expressed as Percent of households in a group of interest where a chronically ill
person was never told to take medicines (overall, by illness)
5.2.1.14 Percent of households with a chronically ill person prescribed medicines who
does not take recommended medicines regularly (overall, by illness)
Rationale To investigate regular access to and use of medicines in chronic
illnesses
Source of data HH survey – Q18, Q22, Q25
Prerequisite Select the adjusted group of interest.
Overall: In the selected group of interest, keep in the computation only
households answering “Yes” to Q18 to obtain the “adjusted overall
group”.
By illness: In the selected group of interest, keep in the computation
only households that answered “Yes” to Q18 where a particular chronic
illness is reported in Q22 to obtain the “adjusted by illness group”
Computation Number of households in the adjusted group who answered “No” to
Q25 ÷ number of households in the adjusted group x 100
Expressed as Percent of households in a group of interest where a chronically ill
person who was prescribed medicines does not take recommended
medicines regularly (overall, by illness)
5.3 Perception of Quality
5.3.1 Indicators of Perception of Quality of Medicines and Delivery of Services
5.3.1.1 Percent of respondents who are satisfied with quality of services delivered by
local public health care facilities
Rationale Perception of quality of care may influence utilization
Source of data HH survey – Q31.a
Prerequisite Select the group of interest.
Computation Number of respondents who agree or strongly agree with Q31.a ÷ number of
households in the group of interest x 100
Expressed as Percent of respondents in a group of interest who are satisfied with the quality
of services delivered at local public health care facilities.
5.3.1.2 Percent of respondents who are satisfied with quality of services delivered by
private health care providers
Rationale Perception of quality of care may influence utilization
Source of data HH survey – Q31.b
Prerequisite Select the group of interest.
Computation Number of respondents who agree or strongly agree with Q31.b ÷ number of
households in the group of interest x 100
Expressed as Percent of respondents in a group of interest who are satisfied with the quality
of services delivered by local health care providers.
31. 31
5.3.1.3 Percent of respondents who agree that brand name medicines are better than
generic medicines
Rationale Perceptions about quality of medicines may influence utilization
Source of data HH survey – Q31.c
Prerequisite Select the group of interest.
Computation Number of respondents who agree or strongly agree with Q31.c ÷ number of
households in the group of interest x 100
Expressed as Percent of respondents in a group of interest who agree that medicines made
locally are of lesser quality.
5.3.1.4 Percent of respondents who agree that imported medicines are of better quality
than locally manufactured medicines
Rationale Perceptions about quality of medicines may influence utilization
Source of data HH survey – Q31.d
Prerequisite Select the group of interest.
Computation Number of respondents who agree or strongly agree with Q31.d ÷ number of
households in the group of interest x 100
Expressed as Percent of respondents in a group of interest who agree that imported
medicines are of better quality than locally manufactured medicines
6 Survey logistics and training
6.1 Selection of data collectors
In most settings, local teachers, people working for NGOs, or local government employees can
be good data collectors. Pharmacy or nursing students may also be available to serve as data
collectors during periods when they are not in classes, and their familiarity with medicines would
be very useful. When the household survey is conducted in conjunction withthe Level II survey,
it is possible to have a combined team composed of local data collectors from the community and
national data collectors who are also engaged in the Level II survey.
It may not be advisable for local health care staff to serve as data collectors. First, their
perspective as health system employees may consciously or unconsciously introduce bias into the
data collection process. If respondents are aware that data collectors work for local health
facility, they may tend to make more socially desirable responses. Methods to reduce possible
bias should also be discussed during training.
Data collectors should be familiar with the community and local language as this will minimize
cultural barriers, e.g. choice of words to explain certain concepts or mistrust of strangers asking
questions about family situations. If necessary the household questionnaire should be translated
into the local dialect. Safety and security are also better assured if data collectors know the area.
They need to have patience and be sensitive to issues that may arise during the introduction and
interview.
The best times for data collection will often be early in the morning or late in the afternoon when
people are less likely to be at work. As much as possible, interviews should not be conducted at
32. 32
mealtime. With good planning and preparation, a team of two data collectors can survey 15
households in one day.
The number of data collectors depends on the sample size (see sampling) and how much time is
allotted to do the actual fieldwork. In general, increasing the number of data collectors will allow
the survey to be completed in less time, but will involve more complicated training and logistics.
6.2 Training data collectors
This survey will often be carried out as a component of the Level II assessment of the country
pharmaceutical situation. As such, training and field-testing of the household survey will either
be done at the same time using the same data collectors or at the same time using two groups of
data collectors. Generally, doctors, pharmacists, nurses, or students in these disciplines are the
most prepared for collecting the Level II data in health facilities and pharmacies because of their
familiarity with medicines. As described above, local teachers, NGO representatives, or school
leavers can be trained to collect household data.
Data collectors should be trained to ask the survey questions in a standardized way, prompt
without leading the respondents to an answer, and fill in answers on the survey form. During
training, role-playing exercises are essential for practicing introducing the survey, gaining
consent, asking the questions, and filling in the forms. Training should also cover the following
questions:
Which households should be included /excluded?
Households should be representative of the economic status of the area. A household will be
included in the survey if an eligible respondent can be identified and interviewed on the day of
data collection in the local area.
Who should be interviewed?
The ideal respondent is the household member who fits all of the following five criteria.
However, an appropriate respondent who fills at least three of the criteria can be substituted.
o Is main health care decision maker
o Is knowledgeable about health of household members
o Is knowledgeable about health expenditures of the household
o Is knowledgeable about health utilization by household members
o Is the designed care giver for sick household members
How the interview should take place?
The interviewer should be familiar with all the questions and responses choices of the
questionnaire.
o Accuracy of answers will depend on the skills of data collectors. Problems may arise
from rephrasing questions so it is important that the interviewer read each question as it
is written, but not the responses unless specified on the questionnaire.
o The interviewer should listen carefully to the responses provided by the respondent, and
record the response by ticking the most appropriate boxes or filling in the blanks as
instructed.
o Responses should be marked right away on the questionnaire. Frequent responses that are
not included in the options provided should be identified and mentioned to supervisors.
33. 33
o Any unusual circumstances for a specific respondent should be written on the
questionnaire (e.g., elderly respondent unable to hear well or multiple people in the
household answering the questions).
6.3 Field testing
Field-testing is an essential component of training. Data collectors will need practice on
selecting households, introducing the study, and interviewing household respondents to be
certain they understand all aspects of the survey and to standardize methods. Generally field-
testing will be conducted in an area near the training site. During the field test, it is important to
use households that will be similar to the ones that will be encountered in all the survey locations
(urban, suburban, and rural).
All persons collecting household data should field test the survey in at least 5 households to gain
practice and ensure familiarity with the questionnaire. After the field test, the data collectors
should have a chance to ask questions and discuss problems in order to standardize the methods.
6.4 Preparation prior to data collectors training and survey visits
The national coordinator should seek appropriate assistance to create a list of country-specific
household assets and obtain a worksheet of household expenditures ranges in advance of the
training.
The national coordinator should inform community and health system leaders of the survey in
advance and contact them again close to the day of the intended visit. In some cases, it may
be necessary to have local community leaders accompany data collectors as they visit
households to ensure trust and cooperation.
34. 7 Household Consent Form (Annex 1)
WHO HOUSEHOLD SURVEY
Dear Participant,
You have been identified as the most knowledgeable respondent about health issues in your
household. We would like to interview you. This survey is conducted by the World Health
Organization and will take place in several countries around the world.
The interview will take approximately 30 minutes. I will ask you questions about:
• Members of your household who were sick over the past two weeks or who have a
chronic condition,
• Treatment and medicines they receive,
• Medicines stored in your home,
• Health insurance, health expenditures, and assets.
The information you provide will only be used to understand better how people obtain and
use medicines.
The information you provide is confidential and will not be shared with anyone. It will only
be used for this research. Your name, address, and other personal information will not be
on the questionnaire. Only a code will be used. The Survey Team may contact you again
only if it is necessary to complete the information at a later point in time.
Your participation is voluntary and you can stop the survey at any time. You are free to
refuse to answer any question. If you have any questions about this survey, you may ask
me or contact (name of institution and contact details) or (Principal Investigator at site).
Signing this consent indicates that you understand what will be expected of you and are
willing to participate in this survey.
Read by Respondent [ ] Read by Interviewer [ ]
Agreed and Signed [ ] Refused [ ]
Respondent: _____________________________________
Interviewer: _____________________________________ Date: ___/___/___