Climate change science, knowledge and impacts on water resources in South Asia
Senior Thesis Poster
1. INTRODUCTION
• Growing populations, increased development, pollution and
global warming have all had negative impacts on the
quantity and quality of fresh water available for human use.
• In 2015, participants at the World Economic Forum, ranked
water crises as the top global risk, and in December at the
UN Climate Change Conference in Paris, world leaders
acknowledged the instrumental role that water will play in a
continuous warming planet (Gleick, 2016).
• Where most places in the world are experiencing periods of
extreme drought New Jersey is currently in a pluvial period.
A pluvial period is defined as a prolonged phase of time in
which there is a wetter climate than the normal average.
• This region of the northeastern United States has been
experiencing the strongest pluvial conditions in the eastern
United States history (Pederson et al., 2012).
• It has been noted that as the most developed state in the
nation, we are on course to reach full build-out before any
other state and as a result, we have less margin for error ;
and a more pressing need for state-level planning than
other state in determining how we use our remaining
developable lands (Evans, 2009).
• The same study revealed that growth trends of the past 21
years has added one acre of impervious surface for every
4.2 acres of development; meaning that newly developed
land is, on average, 23.8% impervious surface (Hasse and
Lathrop, 2010).
• New Jersey’s long-term data documents a significant
increase in the average temperature, in precipitation, and a
significant rise in sea level that are consistent with observed
and predicted global trends of Climate Change ( NJDEP
2013). The combinations of these three increases threaten
the stability of the state’s infrastructure and clean
freshwater availability.
Land-Use Impacts on Stormwater Management in New Jersey
Rachel Nangle, Daniel L. Druckenbrod, Hongbing Sun
Department of Geological, Environmental, and Marine Sciences, Rider University, Lawrenceville, NJ 08648
ABSTRACT
Climate change is causing issues with water conservation
all over the world. Issues like drought, flooding, pollution due to
runoff, acidification and an increase in storm severity are all
causing harm to development and people’s livelihood. This
thesis evaluates how climate change is impacting New Jersey’s
need for increased water conservation during this pluvial
period. New Jersey’s high development leads to a decrease in
groundwater recharge and an increase in stormwater runoff due
to the growth of impermeable land cover created by
urbanization. Two watersheds and their corresponding stream
hydrographs are analyzed to observe how a more rural land
cover compares to a majorly urban land cover, in their
stormwater peak runoffs during two consecutive storm events.
Best management practices for water conservation currently in
place are not enough to sustain a reliable water supply to all of
New Jerseys populace as development continues to approach
full build out. Climate change is projected to increase the
amount of variability in precipitation, which will require better
water management practices for the future to protect New
Jerseys development and maintain a sustainable water supply.
RESULTS
WORKS CITED
Evans, Tim. "Planning Ahead in New Jersey Smart Growth Recommendations from New Jersey Future." New Jersey Future (2009): 1-4. Njfuture.org. Web.
Gleick, Peter, and Brett Walton. "The Most Important Water Stories of 2015 - Circle of Blue WaterNews." Circle of Blue WaterNews. Circle of Blue, 2016. Web. 21 Feb. 2016.
Hasse, John and Richard Lathrop . "Changing Landscapes in the Garden State: Urban Growth and Open Space Loss in NJ 1986 thru 2007." Environmental Studies Geospatial Research Lab. Department of Geography at Rowan University , Center for Remote Sensing and Spatial Analysis, Rutgers University (2010). Web.
"NJDEP 2007 Land Use/Land Cover Update (7/19/10)." State of New Jersey Department of Enviromental Protection, Bureau of GIS. NJDEP, 2016. Web. 31 Jan. 2016.
NJ DEP. "Climate Change in New Jersey: Temperature, Precipitation, Extreme Events and Sea Level." Climate Change in New Jersey: Trends in Temperature and Sea Level Environmental Trends Report (2013). Web.
Pederson, Neil, Andrew R. Bell, Edward R. Cook, Upmanu Lall, Naresh Devineni, Richard Seager, Keith Eggleston, and Kevin P. Vranes. "Is an Epic Pluvial Masking the Water Insecurity of the Greater New York City Region?" Journal of Climate J. Climate 26.4 (2013): 1339-354. Web.
Shaw, Elizabeth M. Hydrology in Practice. Wokingham, Berkshire, England: Van Nostrand Reinhold (UK), 1983. Print.
"USGS Water Data for New Jersey." USGS National Water Information System. U.S. Department of the Interior, 2016. Web. 31 Jan. 2016.
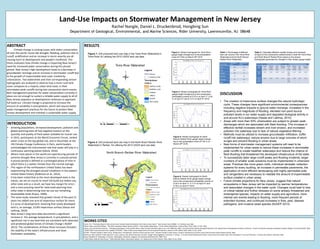
Table 1: Percentage of different
land use covers in the Toms River
Watershed and the North Branch
Raritan River Watershed.
North Poplar
Figure 2: Stream hydrograph for Toms River
gauge height change due to the precipitation
event of 0.35in on March 28th 2016.
Figure 1: GIS produced land use map in the Toms River Watershed in
Toms River NJ utilizing the 2012 USGS land use data.
Land use type:
Toms River %
cover
Raritan River %
cover
Urban 35.9 53.4
Forest 36.2 24.4
Wetlands 19.4 7.3
Agriculture 2.8 13
Barren land 4.1 0.2
Water 1.6 1.7
3/28/16 precipitation event 4/1/16-4/3/16 precipitation event
Stream
gauge
Rainfall
(in
inches)
effective
rainfall
(in/day)
peak
flow
(feet)
Recession
(in/day)
Rainfall
(in
inches)
effective
rainfall
(in/day)
peak
flow
(feet)
Recession
(in/day)
Toms
River
0.35 0.22 4.48 0.15 0.23,
0.40,
0.13
0.17 4.48 0.16
North
Branch
Raritan
0.40 0.52 3.07 0.12 0.32,
0.11,
0.18
0.28 3.10 0.12
Figure 3: Stream hydrograph for Toms River
gauge height change due to the consecutive
precipitation events of 0.23 in on April 1st, 0.40
in on April 2nd and 0.13 in on April 3rd 2016.
.
Figure 4: GIS produced land use map in the North Brach Raritan River
Watershed in Raritan, NJ utilizing the 2012 USGS land use data.
Figure 5: Stream hydrograph for North
Branch Raritan River gauge height change
due to the precipitation event of 0.40 in on
March 28th 2016.
Figure 6: Stream hydrograph for North
Branch Raritan River gauge height change
due to the consecutive precipitation events of
0.32 in on April 1st, 0.11 in on April 2nd and
0.18 in on April 3rd 2016.
Table 2: Calculated effective rainfall (in/day) and recession
(in/day) for the consecutive rainfall events in both the Toms River
and North Branch Raritan River based on the stream
hydrographs generated by changes in their stream gauge height.
DISCUSSION
• The creation of impervious surface changes the natural hydrologic
cycle. These changes have significant environmental consequences;
including negative impacts to ground water recharge, increases in the
frequency and magnitude of flooding, elevated non-point source
pollutant levels in our water supply and degraded biological activity in
and around NJ’s waterways (Hasse and Lathrop, 2010).
• Areas with more than 50% urbanization are subject to greater peak
discharges which are associated with flash flooding. This increase in
effective rainfall increases stream and river erosion, and increased
pollution into waterway due to lack of natural vegetative filtering.
• Methods must be utilized to increase groundwater infiltration, buffer
runoff into waterways, reduce erosion due to large volumes of storm
surges and prevent flooding in urban areas.
• New forms of stormwater management systems will need to be
implemented for urban areas to reduce these increases in stormwater
peak runoffs to create healthier waterways and reduce the chance of
flash flooding that threatened the developed infrastructure of the state.
• To successfully deter large runoff peaks and flooding incidents, larger
numbers of smaller scale solutions must be implemented in urbanized
areas. Practices like more green roofs, individual rainwater collection
systems for every building, an increase in permeable pavements, the
application of more efficient landscaping with highly permeable soils
and raingardens are necessary to mediate the amount of impermeable
surface created in urban areas.
• Future climate projections for New Jersey suggest that natural
ecosystems in New Jersey will be impacted by warmer temperatures
and associated changes in the water cycle. Changes could lead to loss
of critical habitat and further stresses on some already threatened and
endangered species, impacts on water supply and agriculture, more
intense rain events leading to flooding, more frequent periods of
extended dryness, and continued increases in fires, pest, disease
pathogens, and invasive weed species (NJDEP 2013).