
Recommended
Recommended
More Related Content
What's hot
What's hot (13)
Similar to The Efficiency of A Domed Roof To Reduce Heat Islands Using The CFD Calculations; Case Study: Tehran
Similar to The Efficiency of A Domed Roof To Reduce Heat Islands Using The CFD Calculations; Case Study: Tehran (20)
More from QUESTJOURNAL
More from QUESTJOURNAL (20)
Recently uploaded
Recently uploaded (20)
The Efficiency of A Domed Roof To Reduce Heat Islands Using The CFD Calculations; Case Study: Tehran
- 1. Quest Journals Journal of Architecture and Civil Engineering Volume 3 ~ Issue 4 (2017) pp: 01-08 ISSN(Online) : 2321-8193 www.questjournals.org *Corresponding Author: Mahnaz Mahmoudi Zarandi2 E-mail: mahnaz_mahmoody@yahoo.com 1 | Page 1 This article is part of studies “Satira Ebrahimi” in master's thesis entitled " Cultural Center and Art with Reduce of Heat Islands Approach ". This thesis is being studied under the supervision of Professor “Mahnaz Mahmoudi Zarandi” in Qazvin Islamic Azad University, Qazvin, Iran. Research Paper The Efficiency of A Domed Roof To Reduce Heat Islands Using The CFD Calculations; Case Study: Tehran Satira Ebrahimi1 , Mahnaz Mahmoudi Zarandi, (Ph.D)2 1 Masters Degree Of Architecture, Department Of Architecture & Urbanism, Qazvin Branch, Islamic Azad University, Qazvin, Iran 2 Assistant Professor, Academic Staff Department Of Architecture, North Tehran Branch, Islamic Azad University, Tehran, Iran Received; 28 Jan. 2017 Accepted; 18 Feb. 2017; © The author(s) 2017. Published with open access at www.questjournals.org ABSTRACT: Roofs, absorbing solar energy and heat that one of the factors affecting the phenomenon of heat islands are considered. Today one of the biggest problems in Tehran is the heat island problem that is due urban expansion. One of the ways of dealing with this phenomenon is using cool roofs (also it will be included roof forms). As winds, turbulence and fluid conditions in the atmosphere near the surface are the most important climatic factors affecting the distribution pattern of heating surfaces, so the effect of the wind on Semi-Spherical dome has been studied. Design Builder software and CFD Calculation was used for modeling the roof. The results showed that wind suction around arched roof was natural and habitual, so heat go away from the surface arched roof. Higher wind speed on these roof makes the heat more than the outer surface thereto. Heat dissipation in the area around will reduce the heat islands in the region and in order to reduce energy consumption and increase the comfort of the residents of the region will follow. So, architects should act intelligently to limit climate change. Keywords: Urban Heat Island (UHI), Tehran, Domed roof, wind, CFD, Design Builder I. INTRODUCTION Tehran is a metropolis, with the highest rate of urbanization. Dense urban contexts in many areas, traffic and pedestrians plurality of vehicles, irregular buildings and high rate of air pollution, turned Tehran into a heat island, which in itself has created a sub-climate in its own. Studies show that the temperature increase due to expansion of heat islands in Tehran is more than other cities of the country (sasanpour et al., 2014). heat island increase the number of hot days in the year. The island phenomenon harms is rising the financial burden per capita especially in the warmer months of the year, increasing emissions of air pollutants, greenhouse gases, threaten human health and welfare. According to the mentioned cases, appropriate strategies through incentive policies and macro management to mitigate urban heat island phenomenon is necessary. Including ways to reduce heat islands is using cool roofs (roof form). In the following article heat island is considered as fundamental principles and attempt to simulate a hemispherical Semi-Spherical dome, the behavior of wind to reduce the UHI on this form of roof is studied. II. LITERATURE SURVEY Issues related to the urban heat island, has long attracted the attention of climatologists, urban planners and urban managers. Heat island nearly a century ago, in 1833, was first proposed by Haward (Solecke, 2004). Now this phenomenon as a major problem in Asia. In fact, the urban heat island effect in all major cities there (Nemoto, Kobayashi, 2002). In 1997, the negative effects of heat islands was more cooling need and cooling equipment use. In addition to rising electricity consumption, it causing additional pollution and rising temperatures in urban environment. Including the positive effects of heat islands are reducing the use of fossil fuels for domestic heating in the cold season and increasing plant growth due to improve food production in these areas (Soltaninejad, 1998). At first time modeling on a small scale in 1997 in the form of a research project entitled "Application of meteorological studies of air pollution in urban design" was done to study urban heat islands. Bahraini et al
- 2. The Efficiency Of A Domed Roof To Reduce Heat Islands Using The CFD Calculations; ... *Corresponding Author: Mahnaz Mahmoudi Zarandi2 2 | Page (1997) were studied in this project, three areas of meteorology, air quality monitoring and urban deesigning. The above hypothesis test for physical modeling was performed using wind tunnels. studied urban areas was Imam Khomeini Square in downtown of Tehran. For the first time satellite images was used to determine heat islands, to design heat islands and to estimate energy losses, in Iran by Akhundzade and Serajian in 2006. In order to thermal adjustment of buildings using domed roof a lot of research has been done in the world. Blessman, Taniguchi et al, Cheung, Cheung and Melbourne, Newman et al., Savory and Toy, Taylor, Sabzevari and Yaghoubi, Tsugawa, were studied the airflow over the roof dome empirically. It should be noted that many studies has been focused on the roof dome with solar and thermal performance, but wind potential on the roof dome is studied very little. III. IMPORTANCE AND NECESSITY OF RESEARCH An increase in temperature has a significant effect on atmospheric, bio-economic conditions. Estimating surface temperature in different parts of the city is very important to study the Earth's surface temperature distribution and its causes. Therefore, analyzing the phenomenon of heat islands in cities is important. Especially long-term prevention of heat island intensity through urban planning and architectural design (accuracy in the form of urban rooftops and walls, etc.) is very effective in mitigation, efficiency and utility space, especially in urban temperature, pollution control, financial save and reduce the effects of heat islands. IV. METHODOLOGY This research is a descriptive-analyses study. In the first stage data was gathered by library studies, the main sources and translating the text. In the second stage for analyzing the behavior of wind on the Semi- Spherical dome, Design Builder Software with version 3.0.0.105 was used. Energy Plus is the software engine data analysis. The software is designed in such a way that possibility of extending meteorological data to main site has been available and climate data has been available in Tehran. For modelling Semi-Spherical dome, Design Builder Software was used and changes in wind speed and air pressure on the levels has been reviewed by CFD (CFD is a software to calculate the behavior of fluid dynamics). V. CASE STUDY AREA 5.1. Location Tehran (35◦ 51 'N, 51◦ 40' E), as the Iranian capital is a city where urbanization is growing quickly. Tehran has been located on the southern slopes of the Alborz mountain range. According to the latest population and housing census by the Statistics Center of Iran in 2012, the urban population are about 8.5 million, and still the most populous city in Iran, with a population difference is very distinctive from other cities. urbanization rate in this city is 92/8 percent that this is considered a serious threat to environmental resources. Figure 1: The study area (The Metropolitan of Tehran). In Figure 2, the average monthly temperature data from Mehrabad station (1191 m ) has been prepared for the period 2006-2016. As shown in the graph, the hottest month is "July".
- 3. The Efficiency Of A Domed Roof To Reduce Heat Islands Using The CFD Calculations; ... *Corresponding Author: Mahnaz Mahmoudi Zarandi2 3 | Page 5.2. Climate Tehran has kinda cool and semi-arid climate. The height difference in the north and south is about 900 meters that it is causing the temperature difference of Tehran. The average annual temperature is about 17 degrees. In the summer days, temperature is to 43◦C and in the winter evenings it is less than 0 ° C (Mahmoudian et al., 2006). In Tehran, land use change from normal levels to buildings built in recent decades, and expanding the size of the city, leading to changes in the Earth's surface. Changes of the surface covering materials effect on solar energy absorb and changes of forms the Earth's surface. The rapid movement of population from the countryside to the urban district of Tehran's accelerating urbanization in Tehran that contribute to spread city size and density of the made area. Based on available evidence such issues raise the temperature of a city (UHI), environmental pollution and so on. So, studying effect strategies and reducing the UHI is one of the major priorities for architects in the metropolis like Tehran. Figure 2: The average temperature in Tehran from 2006 to 2016 in Tehran Mehrabad station. Figure 3: (a) 22 district in Tehran metropolitan area. The shaded area shows the district of 6 in Tehran. Figure 3: (B) Land surface temperature from Landsat on 18 July 2000. Figure 3b shows the first observation of the clear surface temperature boundary that coincides with land use in Tehran and Urban District 6. What is particularly notable about the heat island intensity in Tehran is hours minimum and maximum values of its occurrence. Contrary to the impression, minimum intensity of the heat island (except for the days 15 February and 28 December) has been occurred at 12:30 to 18: 30 and the maximum intensity of heat island (except for days of April 9 and 31 October) has been happened at 00: 30 to 09:30 (at half the analyzed period, maximum amounth has been occurred at 09:30). it seems factors affecting the intensity of the heat island in the early morning hours are low intensity of winds and high relative intensity in urban areas outside of the city. The reverse can be seen at noon until the evening (Shamsipour et al., 2013). 5.3 Urban Heat Island (UHI) (a) (b)
- 4. The Efficiency Of A Domed Roof To Reduce Heat Islands Using The CFD Calculations; ... *Corresponding Author: Mahnaz Mahmoudi Zarandi2 4 | Page One of the emerging environmental hazards due to the urban expansion is "heat island". heat island is an example of unintentional climate change when urbanization causes changes in the land surface and atmosphere (Voogt, 2004). City heat island effect is a phenomenon in which the urban temperature is higher than the temperature of the surrounding rural areas (Landsberg, 1981; Oke, 1987; Voogt, 2004). 5.4 Wind Wind and humidity are two main variables that control the intensity of UHI. Only the wind has the power to away effectively heat from the heat source in order to prevent local heat buildup. This simple fluid motion is often with three-dimensional turbulence, which is as a catalyst (Hsieh, Huang, 2016). Horizontal motion causes the air temperature, humidity and atmospheric pressure in the horizontal direction disappeared, the air becomes equilibrium. Therefore, wind is an important moderating in nature (Alizadeh et al., 2006). Therefore, the formation of urban heat island remains heavily influenced by wind speed. With air flow, some cool air will mix with warm air. With an increase in wind speed this mix is increased. As a result, the intensity of the heat island formation is reduced and it's forming becomes difficult (Hurley et al, 2003). In Figure 4 wind speed data from Mehrabad station has been prepared (1191 m ) and the mean wind speed in the period 2006-2016, has been intended for all months. Computing unit on is the basis of km/h and m/s, ultimately as a graph is shown by the writer. As the charts show, the highest average of wind speed can be seen in "May". Figure 4 show the hottest month in "July". According to the figures it can be concluded with a drop in wind speed in the warm season (June - July), the heat in July has been increased. Figure 4: The average Wind speed in Tehran from 2006 to 2016 in Tehran Mehrabad station. Research done on the metropolis of Tehran (eg, Ranjbar Saadatabadi and Azadi, 2006; Soltanzadeh et al, 2010) show that the monthly mean meridional component of the wind speed at night in the past few decades had considerable reduction process. Tehran windrose flow is in the direction of 270 degrees West. Figure 5: 10 meter windrose of Tehransar: towers, during the entire day in 2005. 6. Semi-Spherical Dome
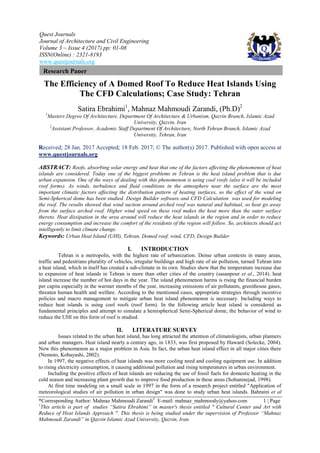
- 5. The Efficiency Of A Domed Roof To Reduce Heat Islands Using The CFD Calculations; ... *Corresponding Author: Mahnaz Mahmoudi Zarandi2 5 | Page About one-third of heat enter through the roof into the house (the Department of Energy United States of America, 1994). The roof form, the type of materials and the climate of the region are factors in improving protection functions and Thermal of roof (Shahi, 2008). Semi-Spherical Dome by allowing free movement of air across the exposed surfaces of roof and roof space ventilation, can reduce heat transfer through it. The first method for cooling the roof is attention to the proper orientation of the roof, its shape and shading (Nielsen, 2007). Semi-Spherical Dome due to the bumps are constantly exposed to wind (one of the main factors in controlling UHI). This subject decreases absorbed sun heat by the roof and therefore increases the convective heat transfer coefficient. Therefore less heat finds a way into the building. At night, the heat that is reflected from the roof to be resolved quickly and it has inactive cooling effect for the building. VI. RESULT AND DISCUSSION What causes air circulation around the domed roof is positive and negative pressure is created on both side. The surface of the dome facing the wind with a positive pressure, and the surface on the leeward side has the negative pressure. This difference in pressure causes the flow of wind around the dome more quickly and heat away from its surface. The single most important factor in the performance of arc roof is not pressure difference between the windward and leeward. What is important in removing heat discussed is the current wind speed and direction on the surface and surrounding space. In the pictures below, pressure and air speed are clearly displayed. Figure 6: Amount of air pressure. Figure 7: Wind speed and air pressure around the dome. Figure 6 and 7 display speed and air pressure to the dome arc, in the overall dimensions. Then if there is air flow after dealing with the dome has been a dramatic drop. In the windward, air pressure is in the range of 4/77 - 11/86 Pascal and wind speed is 4/83 meters per second. Air flow slightly go ahead and air pressure is in the range of -2/32 Pascal, speed is 3 /22 meters per second. WIND
- 6. The Efficiency Of A Domed Roof To Reduce Heat Islands Using The CFD Calculations; ... *Corresponding Author: Mahnaz Mahmoudi Zarandi2 6 | Page When air flow touches the sides of the dome, air pressure in the lower part is -9/41 Pascal and a little higher - near the tip of dome- less pressure can be seen (-23 / 58 Pascal). Air flow speed is also a function of air pressure and it is in the range of 0.81 - 1/61 meters per second. Finally the leeward side, the speed of air is 0/81 meters per second. In the image, pressure and air velocity is clearly seen. This factor cause to flow air around the hemispherical roof permanently. Table 1: The pressure and wind speed on the dome in meters per second The windwardThe parties of DomeThe leeward unitsm/spam/spam/spa Hemispherical roof4/834/77 - 11860/81 - 1/61 -9/410/81-9/41 - 0 Figure 8: The wind speed and direction in the section near the bottom of the hemispherical dome. In Figure 8, air speed at the bottom of the dome, near the edge of the dome (H = 13 / 80m) has been considered and arrowheads show the wind direction. The wind entere dome with almost high wind speeds and with 2/42 meters per second encounter with the dome surface. Then the wind had driven into two domes sides and its speed increases 5.62 meters per second. Its speed reaches as much as 2.42 meters per second on the leeward side. Figure 9: Wind speed and direction near the tip of the hemispherical dome. In Figure 9 air speed at the top of the dome, near the top of the dome (H = 18m) is considered and the spearhead be displayed the movement path of wind. the wind enter at high speed into the area of the dome, the wind speed on the windward dealt between 4/03 and 5/64 meters per second with the dome surface. Then moves its path toward two sides of the dome and its speed is increased up to 8/05 meters per second. In the path of wind movement to the back of dome, the wind speed is on the order 5/64, 4/03, 2/42, 0.81, and on the leeward, zero in meters per second wind. The highest wind speed is at the tip of the dome and air flow on the surface of the dome and the next surfaces is higher that it is causing heat go away from the roof and make it cool.
- 7. The Efficiency Of A Domed Roof To Reduce Heat Islands Using The CFD Calculations; ... *Corresponding Author: Mahnaz Mahmoudi Zarandi2 7 | Page Figure 10: displayes a pressure and air speed on four sides and image 11b displayes pressure and air speed on four sides two sides Air flow direction on the arched roof is not in linear and fixed; but after dealing with the dome open and divert the parties and redirect the path (Figure 10). How the wind moves from the bottom to the top of the dome is brought into view. Figure 10 shawes how the wind moves from the bottom to the top of the dome. It can be seen that the wind speed in all directions, the adjacent of the edge of the roof have lower speed and the wind speed increases closer to the top of the dome. In this Figure, the wind speed is considered from the bottom to up. wind speed at the windward is 2/42 - 4/83 meters per seconds. Wind speed On either side of the dome is between 5/62 - 8/86 meters per second which is faster than the other two sides.Wind speed on the leeward side of the dome is low and it is 0.81 meters per second. At the top of the dome because of pressure on the windward and leeward side, the air speed is more quickly, and the blind are formed. Air flow in the underneath of the dome is slower. But since the airflow can be done continuously, so it can be efficient to reduce heat transfer from the roof to environment. In this case, space can be cooled and heat islands will be reduced. Table 2: investigate the wind speed on the dome in meters per second (source: author) The windward sidesThe leeward sides The parties disinfection dome side The edge of the dome 2/425/620/81 Mid-Dome 3/226/440/81 Near the top of the dome 4/838/860/81 VII. CONCLUSIONS Evaluating air flow around the domed roof of the building is the first step to show its thermal conditions. In this study heat island effect in moderating the arched roof and CFD simulation are shown in Tehran. • airflow and air pressure distribution on the surface of the roof dome and its nature of suction is permanent. • According to the survey, wind speed after reaching the dome, as quickly as we can see on the sides. • Temperature variations in the roof dome shade during the day as a result of automating this type of roof. • movement the wind on the roof causes a dome roof convection coefficient be significantly higher in the front and lower on the leeward. • The maximum suction is occurred near the top (the peak) of dome that both sides of the windward side and the leeward side is reduced.
- 8. The Efficiency Of A Domed Roof To Reduce Heat Islands Using The CFD Calculations; ... *Corresponding Author: Mahnaz Mahmoudi Zarandi2 8 | Page • Move the air on the leeward side of the dome in a vortex form between the dome and flat roof surface is rotated, it causes the level mentioned be cooler. Roof dome prevent the heat accumulation on surfaces by permanently air movement, and adjuste ambient temperature and reduce heat islands in the district of 6 in Tehran province. REFERENCES [1]. Alizadeh, A. (2006), air and climate, Eighth Edition, University of Mashhad publication. [2]. Bahraini, S.H., Khoshpoor, H. and Arefi, M. (1997). the use of meteorological studies of air pollution in urban design, ecology, No. 18. [3]. Energy Department of the United States of America, 1994; http://www.nrel.gov/docs/legosti/old/15771.pdf [4]. Hsieh, Chun-Ming ; Huang, Hsin-Chiao, (2016), Mitigating urban heat islands: A method to identify potential wind corridor for cooling and ventilation, Computers, Environment and Urban Systems 57, 130–143. [5]. Hurley P, Manins P, Lee S, Boyle R, Ng YL, Dewundege P, Yearlong P. Year-long, (2003). high-resolution, urban airshed modelling: verification of TAPM predictions of smog and particles in Melbourne, Australia, Atmospheric Environment 37. 1899– 1910. [6]. Kok Nielsen, H. (2007). natural ventilation -design guide in warm climatic-, translator: Mohammad Ahmadinejad, First Edition, Tehran: soil Publication. [7]. Landsberg, H. E. (1981). The urban climate. Geophys (pp. 275). NewYork: Academic Press. [8]. Mahmudian,Ali Akbar. Ghasemi, Houshang. Houshmand fini, Gholam Reza. Artidar, Reza. (2006). A glance at Tehran from the beginning up till now. Tehran: GITASHENASI Geographical & Cartographic Institute. [9]. Nemoto, M. and Kobayashi, H. (2002). Trends in the Studies of Heat Island Mitigation Technology : Analysis from the Viewpoint of Energy Use. Science & Technology Trends Quarterly Review. No. 17. (Japanese) [10]. Oke, T. R. (1987). Boundary layer climates. London: Methuen. [11]. Sasanpour, F., Ziaeian, P. and Bahadori, M. (2014). investigate the relationship between land use and land cover and heat islands in Tehran, International Journal of Geographic Society of Iran, No. 29. [12]. Shahi, J. (2008). building components, ninth edition, Yazd University. [13]. Shamsipour, A. and Mehdian Mahfrozy, M. and Hosseinpour, Z. (2013). analyze the spatial core changes of the urban heat island in Tehran, journasl of naturall geography, Vol. 44, No. 3. [14]. Solecki, W. D, C. Rosenzweig, G. Pope, M. Chopping, R. Goldberg and A. Polissare, (2004). Urban Heat Island and Climate Change: An Assessment Interacting and Possible Adaptations in the Camden, New Jersey Region. New Jersey’s Environmental Decision Making. [15]. Soltaninejad, A. (1998). the environmental impact emissions from motor vehicles with a focus on Tehran's air, environmental Quarterly, Volume 9, No. 4. [16]. Voogt, J. A. (2004). Urban heat islands: Hotter cities. America Institute of Biological Sciences.