SlideShare a Scribd company logo
1 of 19
Download to read offline
Annals of Ecology and Environmental Science
Volume 1, Issue 1, 2017, PP 27-45
Annals of Ecology and Environmental Science V1 ● I1 ● 2017 27
Development of an Integrated Urban Heat Island Simulation
Tool
Ming Xu
Future Cities Laboratory, Singapore-ETH Centre, ETH Zurich
*Corresponding Author: Ming Xu, Future Cities Laboratory, Singapore-ETH Centre, ETH Zurich
INTRODUCTION
Urban heat island (UHI) effect is described as
the phenomenon that the air temperature in
urban area is consistently higher than its rural
area (Oke, 1973). While many causes of the
urban heat island such as reduced evaporation,
increased heat storage, increased net radiation,
reduced convection and increased anthropogenic
heat have been identified as in Gartland (2008),
the contribution of each component strongly
depends on the individual city and its
geography. In a high-density mixed-used
tropical city like Singapore, the urban
microclimate varies from location to location
and time to time.
From previous research, we have a broad
understanding of the magnitude of the urban
heat island effect in Singapore, and of its main
causes. A study of air temperatures conducted in
Wong and Chen (2006) between2001-2004
showed that the UHI intensity in Singapore was
about 4.5° C. Another study from Chow and
Roth (2006) found that the peak UHI magnitude
occurs approximately six hours after sunset at
central business districts, high-rise residential
estate, and low-rise residential area. Higher UHI
intensities generally occur during the southwest
monsoon period of May–August, with a
maximum of ~7° C observed at Orchard Road at
approximately 21:00 local time (Chow and
Roth, 2006).More detailed information about the
influence of albedo on the UHI in Singapore has
been obtained from satellite or aerial images
(Mackey et al., 2012). Wong and Chen (2006)
concluded that hotspots are normally observed
in the urban context on exposed hard surfaces
during the daytime, and suggested that these
could be addressed through shading by greenery
or artificial sun-shading devices. Several other
ABSTRACT
Urban heat island (UHI) effect is quite common in megacities due to the built-up area and reduced greenery
coverage of land surface, which highly affect urban livability. An integrated urban heat island simulation
tool is developed by accounting for major heat sources and heat sinks in selected area of interest, and their
interactions with the surrounding environment. Validation of simulated solar radiation and air temperature
is conducted at Kent Vale buildings and Punggol Waterway Terrace I, with correlation coefficient (𝑟) of
0.98 and 0.90, and mean absolute error (MAE(%)) of 4% and 13%, respectively. The validation results
confirm the performance of the simulation tool. As an implementation example of the developed integrated
urban heat island simulation tool, effects of air conditioners, traffic, grasslands and water bodies on urban
thermal environment are investigated by comparing results from two different scenarios, namely the base
scenario where all regions are set as concrete and the real situation scenario where each region is set as its
own property. It is found that (1) the simulation tool is able to simulate the stack effects induced by split-
type air conditioners accurately; (2) the air temperature above Clementi Road is more than 2C higher than
surrounding air throughout the daytime except during the early morning and can affect air even at 8m
above the ground; (3) grasslands can cool down much larger area than their upright surface with capability
of around 2C decided by the size of grassland through intrusion into the hotter regions from gaps between
three high-rise buildings and the verandah; (4) the air temperature at the water surface of the swimming
pool is found to be around 1.5 C cooler than the surrounding air and can go up to 1m above the water
surface with temperature of around 0.5C lower than the surrounding air.
Keywords: Urban heat island effect, Integrated simulation tool, Effects of air conditioners, Effects of
traffic, Effects of grasslands, Effects of water bodies;
.
Development of An Integrated Urban Heat Island Simulation Tool
28 Annals of Ecology and Environmental Science V1 ● I1 ● 2017
studies have investigated the urban microclimate
in Singapore relating to the urban heat island
effect (Chow et al., 2014; Shaffer et al., 2014;
Roth and Chow, 2012; Jusuf et al., 2007; Chow
and Roth, 2006; Li et al., 2013). Research exists
on several counter-measures, such as rooftop
gardens and albedo (Sproul et al., 2014; Gao et
al., 2014; Chen and Wong, 2006; Li and
Norford, 2016).
Recent challenges in modeling of urban heat
island are reviewed in Mirzaei (2015) by
addressing problems in building-scale models,
micro-scale models and city-scale models. It is
concluded that microclimate and building
models cannot cover the entire city due to the
complex parameters and extensive
computational cost. Despite the capability of
mesoscale models in investigation of the large-
scale UHI effect, their accuracy is not sufficient
to provide detailed information of the urban
canopy layer. This gap requires further research
to develop computationally and spatially
efficient models. Urban heat island is a typical
multi-physics multi-scale problem, which calls
for integrated evaluation of the complex
interactions between each key component in the
system. As pointed out in Xu (2016), it is
necessary to quantify the respective effects of
major heat sources and sinks which contribute to
urban heat island effect in Singapore. Xu (2016)
concludes that solar radiation is the predominant
heat source in Singapore, whose effects and
interactions with buildings and surrounding air
is investigated in Xu et al. (2017). Other heat
sources contribute to urban heat island effect is
mainly induced by anthropogenic activities
Quah and Roth (2012), such as industrial
activities, building energy consumption and
traffic system. Major heat sinks in the urban
context are grasslands, trees and water bodies.
To account for the combined effects of different
heat sources and sinks with various physics
background, model coupling is a widely adopted
and well proven numerical technique. For
instance, to simulate the combined effects of
building energy consumption and the
surrounding environment, coupled building
energy consumption and environment models
are implemented in Allegrini et al. (2015) and
Allegrini and Carmeliet (2017) by coupling the
Computational Fluid Dynamic (CFD) model
with radiation model. To simulate cooling
effects from heat sinks through evaporation such
as water bodies, coupled CFD and radiation
models are also widely used (Saneinejad et al.,
2012; Tominaga et al., 2015). Cooling effects of
greenery including grasslands and trees could be
modeled as porous media with the coupled CFD
and radiation model by adding source terms to
the governing equations, as adopted in
Saneinejad et al. (2012). Various modeling tools
and systems are developed across the world to
manage and evaluate the impacts of different
urban elements and urban designs on urban heat
island effect in city-scale and outdoor thermal
comfort in neighborhood-scale and street- scale.
Assessment of tools developed in Japan for
urban climate is conducted in Ooka (2007) by
classifying them according to corresponding
modeling scales. It is shown that these
assessment tools are quite powerful in
estimating countermeasures of urban heat island
effect and could be implemented as design tools
for practical applications. An operational
modeling system for urban heat island effect is
developed and implemented to Athens, Greece,
as reported in Giannaros et al. (2014). The
modeling system is built on the basis of a state-
of-art numerical weather prediction model
which is properly modified to allow for better
representation of the urban climate. While few
modeling tools account for the integration of
major heat sources including solar radiation,
industrial activities, building energy
consumption and traffic system, and major
heat sinks including grasslands, trees and
water bodies are developed.
The main objective of this study is to
develop an integrated urban heat island
simulation tool by accounting for major heat
sources and heat sinks in selected area of
interest, and their interactions with the
surrounding environment. This paper is
structured as follows: Section 2 presents
methodology applied in this study, Section 3
shows the validation process of the
developed integrated simulation tool,
Section 4 illustrates the results and related
discussions, Section 5 draws conclusions of
this study.
METHODS
Three universal conservation laws of mass,
momentum and energy are taken into
account by solving continuity equation
(Equation (1)), Navier-Stokers equation
(Equation (2)) and energy balance equation
(Equation (3)). The flow field and the
transport phenomena developed in the
Development of An Integrated Urban Heat Island Simulation Tool
Annals of Ecology and Environmental Science V1 ● I1 ● 2017 29
computational domain are described by the
Reynolds Averaged Navier-Stokes (RANS)
equations. The continuity, momentum and
energy conservation equations are solved in
a 3D (x, y, z) domain, as well as the
equations correspond to the turbulence
model. Conjugate heat transfer is simulated by
solving heat convection (Equation (4)),
conduction (Equation (5)) and radiation
(Equation (6)) between fluid and solid regions.
The turbulence effect in the developed flow and
heat transfer is modeled through the
standardk − ε model.
∂ρ
∂t
+ ∇ ∙ ρu = 0
(1)
∂ ρu
∂t
+ ∇ ∙ ρu⨂u + pI = μ∇2
u + ρg
(2)
ρCp
∂T
∂t
+ u ∙ ∇T = κ∇2
T + Q
(3)
q = h(Ta − T∞) (4)
q = −k∇T (5)
q = ϵσ(Ta
4
−Tb
4
) (6)
where ρ is density, t is time, u is flow velocity
field, p is pressure, Iis the identity matrix, μ is
turbulent eddy viscosity, g is the gravity
acceleration rate, T is temperature, Cp is the
specific heat, κ is the thermal conductivity, Q is
the additional heat flux, h is the heat transfer
coefficient, ϵ is the radiation factor and σ is the
Stefan-Boltzmann constant, respectively.
Solar radiation is simulated by accounting for
the combined effects of the Sun primary hits,
their reflective fluxes and diffusive sky radiative
fluxes (Howell et al. 2010). The primary hit rays
of solar radiation are calculated using a face
shading algorithm. The reflected fluxes are
considered diffusive and use a view factors
method to deposit the energy on visible walls.
The sky diffusive radiation for horizontal and
vertical walls is calculated following the Fair
Weather Conditions Method from the ASHRAE
Handbook.
Ray tracing technique of the solar load model is
used to forecast the direct illumination energy
source induced by incident solar radiation. By
using the illumination parameters and the sun
position vector, a beam is applied to any faces to
carry out a face-by-face shading analysis to
compute the heat flux on the boundary faces that
results from the incident radiation and determine
shadows on all interior walls and boundary faces.
The resulting heat flux computed by the solar
ray tracing algorithm will be coupled to the
energy equation with a source term. The heat
sources are assigned to adjacent cells such as
solid cells, shell conduction cells, and fluid cells
and added to computational cells which are
bordering each face. A two-band spectral model
which accounts for different material properties
in the infrared and visible bands is used for
direct solar illumination. Diffuse radiation is
calculated by a hemispherical-averaged single-
band spectral model. Opaque materials are
characterized by two-band absorptive. The
shading calculation used for solar ray tracing is
a straightforward vector geometry calculation. A
ray is traced from the face centroid in the sun
direction. Every other face is checked to
determine if the candidate face is in front of the
target face and if the ray intersects the target
face. An opaque face completely shades the test
face if both requirements are met.
A solar calculator is designed to compute solar
beam directions and irradiation for a given time,
date and position consists of latitude and
longitude. These values can be used as inputs to
the solar ray tracing algorithms. The equation
for normal direct irradiation applying the Fair
Weather Conditions Method is taken from the
ASHRAE Handbook:
Edn =
A
e
B
sin β
(7)
where A and B are apparent solar radiation at air
mass m = 0 and atmospheric extinction
coefficient, respectively. These values ofA and
Bare based on the earth's surface on a clear
day. β is the solar altitude (in degrees) above the
horizon. This algorithm is also similar to the
solar calculator adopted in ANSYS FLUENT.
The greeneries including grasslands and trees
are considered as heat sinks and porous
materials that cause pressure drop. In the
momentum conservation equations two source
terms are added, which correspond to the
thermal buoyancy and the pressure drop inside
the porous media, as presented in Fidaros et al.
(2017).
Six extra terms are added in the energy equation,
which are a source term corresponding to
thermal radiation calculated by the solar load
model, three more source terms corresponding
to the heat produced by buildings, traffic system
and industrial activities and two sink terms that
correspond to the air temperature reduction due
to evapotranspiration and evaporation of
greenery and water bodies, respectively. Other
Development of An Integrated Urban Heat Island Simulation Tool
30 Annals of Ecology and Environmental Science V1 ● I1 ● 2017
model set up follows strictly the suggestions
made in Xu (2017).
Open FOAM (www.openfoam.com) is
implemented in this study as the core model,
which is a free and open source Computational
Fluid Dynamics (CFD) software developed
primarily by Open CFD Ltd since 2004 and
distributed by Open CFD Ltd and the Open
FOAM Foundation. The non-uniform thermal
boundary condition was defined by considering
the solar irradiance that enables to include the
effect of shading and solar heating. Docker
(www.docker.com) is employed to perform
parallel computing on the 128-core High
Performance Computer (HPC) in Future Cities
Laboratory of Singapore-ETH Centre. Parallel
computing together with the customized CFD
program coupled with solar radiation model and
other key components to simulate conjugate
heat transfer ensured the high-performance of
this tool in terms of both accuracy and
efficiency.
MODEL VALIDATION
To validate the performance of the developed
integrated urban heat island simulation tool, two
rounds of simulations are carried out and
compared against observed data after calibrating
the key parameters of the tool. In the first round,
Kent Vale buildings (Figure 1), which are the
housing unit of faculty members of National
University of Singapore, are chosen. The
location of the Kent Vale buildings, which is the
key input information of the earlier developed
solar radiation model as one of the tool forcing,
is (1.302N, 103.768E) in latitude and
longitude, respectively. The model domain for
Kent Vale Buildings is selected as 250m
250m 200m in x, y and z directions,
respectively. With snappyHexMesh of Open
FOAM, a high resolution of around 5cm is
achieved for the smallest edges of buildings and
the total number of cells is 1.27 million.
Different regions are identified in Figure 1,
including buildings, greeneries, road pavement
and water bodies. Thermo physical and radiation
properties of different materials involved in both
models are set as tabulated in Table 1. Key
parameters are molar weight of the substance
(mol Weight) in kg/mol, specific heat capacity
(Cp) in J/kgK, dynamic viscosity (mu) in Pas,
Prandtl number (Pr), thermal conductivity
(Kappa) in W/mK, density of the material
(Density) in kg/m3 and emissivity, absorptive,
transmissivity and reflectivity of different
materials. Solar radiation is calculated with the
coupled solar load model by setting the specific
date of the typical day during each month and
location of the Kent Vale buildings. The tool is
forced by the real settings of initial air
temperature and velocity of each split type air-
conditioners on both sides of the Kent Vale
buildings, as measured in Bruelisauer et al.
(2014). Time series of heat flux due to traffic
system from 6am to 8pm during daytime (Figure
2) is adopted after part of Figure 3 in Quah and
Roth (2012), which is employed as the forcing
of traffic heat flux in the simulation tool. The
cooling effects of greeneries are simulated by
regarding the porous media which represent
grasslands as heat sinks by assuming the cooling
power of the grasslands is 22.5 W/m2, as
reported in Edwards et al. (2016) for evaporative
cooling power of a typical rain tree in Singapore.
A close cooling power of 20 W/m2is also set for
the water bodies involved in the model domain,
with reference values from Fidaros et al. (2017).
The initial air temperature is set as 27C in the
early morning at 6am as provided by the
measured data from the nearest meteorological
station of National Environmental Agency
(NEA). Wind profile on each specific date is set
according to the measured data at the
meteorological station at National University of
Singapore, which is around 500m from the
center of the model domain, as one of the
boundary conditions. Other boundary and initial
conditions include turbulent dissipation rate ,
turbulent kinetic energy 𝑘, kinematic turbulence
viscosity 𝜈𝑡 , pressure 𝑝, wall function parameter
𝛼 and incident radiation intensity 𝐺, which are
calculated according to the real situations of the
environment around Kent Vale buildings.
Figure1. 3D geometriesof Kent Vale buildings with different regions identified.
Development of An Integrated Urban Heat Island Simulation Tool
Annals of Ecology and Environmental Science V1 ● I1 ● 2017 31
Table1. Thermo physical and radiation properties of different materials.
Air Concrete Water
molWeight (kg/mol) 28.97 200 18
Cp (J/kgK) 1004 750 4180
mu (Pas) 0.000018 - 0.001057
Pr 0.7130 - 6.5241
Kappa (W/mK) - 0.8 -
Density (kg/m3
) - 2240 1000
Emissivity - 0.7 0.1
Absorptivity - 0.7 0.1
Transmissivity - 0 0.4
Reflectivity - 0.3 0.5
Figure2. Time series of heat flux from traffic on Clementi Road. Regenerated after part of Figure 3 in Quah
and Roth (2012).
Simulated solar radiation and air temperature on
a typical day of each month are validated
against observed data provided by National
University of Singapore Meteorological Station
(Figures 3-4, Tables 2-3). Statistical evaluations
are performed by calculating the correlation
coefficient (r) and the mean absolute error in
percentage (MAE (%)).
𝒓 =
∑(𝑿𝒎𝒐𝒅𝒆𝒍 − 𝑿𝒎𝒐𝒅𝒆𝒍)(𝑿𝒐𝒃𝒔 − 𝑿𝒐𝒃𝒔)
∑ 𝑿𝒎𝒐𝒅𝒆𝒍 − 𝑿𝒎𝒐𝒅𝒆𝒍
𝟐∑(𝑿𝒐𝒃𝒔 − 𝑿𝒐𝒃𝒔)𝟐
(8)
𝑴𝑨𝑬 (%) =
∑ (𝑿𝒎𝒐𝒅𝒆𝒍 − 𝑿𝒐𝒃𝒔)
(𝒎𝒂𝒙 𝑿𝒐𝒃𝒔 − 𝒎𝒊𝒏(𝑿𝒐𝒃𝒔))𝑵
(9)
where Xmodel and Xobs are simulated and
observed quantity, respectively. Xmodel and
Xobs are the mea values of simulated and
observed quantities, respectively. N is the total
number of quantities involved in the
calculation. max Xobs and min(Xobs ) are the
maximum and minimum observed data among
all involved quantities in the calculation,
respectively. The calculation of observed solar
radiation in each month throughout the whole
year around Kent Vale buildings can be found in
Xu (2016).
It is found that the simulated radiation (Figure 3)
and air temperature (Figure 4) generally agree
well with observations, with 𝑟 of 0.99, 0.98 and
MAE (%) of 2%, 4%, respectively (Tables 2 and
3). This shows that the modeling developed
integrated urban heat island simulation tool
could capture most portion of solar radiation and
air temperature. Much smaller solar radiation
and lower air temperature in November and
December are observed due to the heavy rainfall
during the Northeast monsoon season. Heavy
rainfall will diffuse more solar radiation,
enhance evaporation of water on the group
which low down the air temperature.
Development of An Integrated Urban Heat Island Simulation Tool
32 Annals of Ecology and Environmental Science V1 ● I1 ● 2017
Figure3. Validated solar radiation on a typical day of each month against measured data.Legend: measured
data (red line), simulated results (blue line).
Figure4. Validated air temperature on a typical day of each month against measured data. Legend: measured
data (red line), simulated results (blue line).
Table2. Statistics of simulated solar radiation on a typical day of each month.
Jan Feb Mar Apr May Jun Jul Aug Sep Oct Nov Dec
r 0.99 0.99 0.99 0.99 0.99 0.99 0.99 0.99 0.99 0.99 0.99 0.99
MAE(%) 1.67 1.97 1.66 2.48 1.55 1.78 2.02 1.78 1.72 1.40 1.39 1.22
Table3. Statistics of simulated air temperature on a typical day of each month.
Jan Feb Mar Apr May Jun Jul Aug Sep Oct Nov Dec
r 0.98 0.99 0.98 0.98 0.98 0.98 0.98 0.98 0.97 0.98 0.99 0.98
MAE(%) 4.96 5.11 4.96 5.02 5.03 4.94 5.59 5.79 6.59 5.24 5.11 5.63
To further evaluate the performance of the
developed simulation tool in simulating air
temperature, Punggol Waterway Terrace I
(Figure 5) is chosen as the second site to
compare the simulated results with observed
data measured by 49 sensors deployed on-site
on 6 Feb 2017. The location of Punggol
Waterway Terrace I is (1.408N, 103.900E) in
latitude and longitude, respectively. Similar
settings to the first case of Kent Vale buildings
are made by identifying different regions
including buildings and greeneries. As shown in
Figures 6-11, the simulated time series of air
temperature at 49 sensors generally match well
with observed data, with slight overestimations
at Sensors 17-22 especially during noon time.
The discrepancies at Sensors 17-22 are mainly
due to the underestimation of the cooling power
of surrounding greeneries, which has a dynamic
performance throughout the whole day
Development of An Integrated Urban Heat Island Simulation Tool
Annals of Ecology and Environmental Science V1 ● I1 ● 2017 33
especially the peak values during noon time. To
improve the model accuracy in predicting air
temperature at a complex situation as Sensors
17-22, detailed measurements of cooling power
of surrounding trees and grasslands are needed,
especially the dynamic performance throughout
the whole day. A great sample study of such
measurements is presented in Tan et al.
(2017).According to Table 4, the correlation
coefficient 𝑟 is consistently larger than 0.90 and
the MAE(%) is around 13%, which indicates
that the developed integrated urban heat island
simulation tool could simulate quite accurate air
temperature around real buildings with detailed
information.
Figure5. 3D geometries of Punggol Waterway Terrace I and the 49 deployed sensors.
Figure6. Validated air temperature at Sensors 1-8 against measured data. Legend: measured data (red line),
simulated results (blue line).
Development of An Integrated Urban Heat Island Simulation Tool
34 Annals of Ecology and Environmental Science V1 ● I1 ● 2017
Figure7.Validated air temperature at Sensors 9-16 against measured data. Legend: measured data (red line),
simulated results (blue line).
Development of An Integrated Urban Heat Island Simulation Tool
Annals of Ecology and Environmental Science V1 ● I1 ● 2017 35
Figure8.Validated air temperature at Sensors 17-24 against measured data. Legend: measured data (red line),
simulated results (blue line).
Development of An Integrated Urban Heat Island Simulation Tool
36 Annals of Ecology and Environmental Science V1 ● I1 ● 2017
Figure9. Validated air temperature at Sensors 25-32 against measured data. Legend: measured data (red line),
simulated results (blue line).
Development of An Integrated Urban Heat Island Simulation Tool
Annals of Ecology and Environmental Science V1 ● I1 ● 2017 37
Figure10. Validated air temperature at Sensors 23-40 against measured data. Legend: measured data (red line),
simulated results (blue line).
Development of An Integrated Urban Heat Island Simulation Tool
38 Annals of Ecology and Environmental Science V1 ● I1 ● 2017
Figure11.Validated air temperature at Sensors 41-49 against measured data. Legend: measured data (red line),
simulated results (blue line).
Development of An Integrated Urban Heat Island Simulation Tool
Annals of Ecology and Environmental Science V1 ● I1 ● 2017 39
Table4. Statistics of simulated air temperature at sensors 1-49.
Sensor 1 Sensor 2 Sensor 3 Sensor 4 Sensor 5 Sensor 6 Sensor 7
r 0.96 0.94 0.93 0.91 0.89 0.87 0.89
MAE (%) 7.40 11.44 38.74 12.79 13.00 13.23 15.11
Sensor 8 Sensor 9 Sensor 10 Sensor 11 Sensor 12 Sensor 13 Sensor 14
r 0.91 0.91 0.90 0.93 0.90 0.93 0.92
MAE (%) 13.67 15.38 11.29 9.87 12.49 10.03 12.90
Sensor 15 Sensor 16 Sensor 17 Sensor 18 Sensor 19 Sensor 20 Sensor 21
r 0.91 0.90 0.90 0.92 0.91 0.93 0.90
MAE (%) 14.57 14.30 67.37 64.49 74.33 58.00 47.06
Sensor 22 Sensor 23 Sensor 24 Sensor 25 Sensor 26 Sensor 27 Sensor 28
r 0.90 0.72 0.89 0.90 0.90 0.93 0.91
MAE (%) 39.45 16.78 13.30 20.77 30.25 21.17 19.37
Sensor 29 Sensor 30 Sensor 31 Sensor 32 Sensor 33 Sensor 34 Sensor 35
r 0.92 0.93 0.82 0.88 0.76 0.91 0.88
MAE (%) 11.37 9.82 21.36 14.11 20.12 17.83 17.41
Sensor 36 Sensor 37 Sensor 38 Sensor 39 Sensor 40 Sensor 41 Sensor 42
r 0.90 0.93 0.91 0.96 0.92 0.93 0.86
MAE (%) 15.96 34.62 11.89 7.81 24.12 8.98 14.07
Sensor 43 Sensor 44 Sensor 45 Sensor 46 Sensor 47 Sensor 48 Sensor 49
r 0.92 0.91 0.90 0.94 0.95 0.95 0.95
MAE (%) 13.83 11.36 14.16 9.41 20.69 9.05 9.69
RESULTS AND DISCUSSION
To quantify respective contributions from major
heat sources and sinks to the urban thermal
environment, impacts of air conditioners, traffic,
grasslands and water bodies are discussed in this
section as an implementation example of the
developed simulation tool. Two scenarios of
simulations are designed to achieve the goals,
namely the base scenario where all regions are
regarded as concrete and the real situation
scenario where each region is set with the
respective properties, such as buildings, road
pavement, grasslands and water bodies as shown
in Figure 1, respectively.
Impacts of Air Conditioners
In Singapore, the majority of installed air-
conditioning systems on high rise residential
buildings are split type air-conditioners,
compact units rejecting heat from air-
conditioning through a dry heat exchange. They
affect and in turn exposed to the urban
microclimate in their vicinity, with regard to
capacity to provide cooling and the efficiency of
their operation. Stack effect of split type air-
conditioners on high rise buildings are induced
by the buoyancy-driven airflow coming out
from the condensing units with rejected heat.
The increasingly hotter air accumulated at
higher levels of the same building will reduce
the energy efficiency by increasing the ambient
air temperature, the heat sink for the air-
conditioners. The effect was confirmed in field
measurements on Block H of Kent Vale
buildings in Bruelisauer et al. (2014). The model
uses the measurements of its case study to verify
the tool.
The 24-storey Kent Vale Block H is chosen to
study the stack effect of split type air-
conditioners. The tool is forced by the real
settings of initial air temperature and velocity of
each split type air-conditioners on the north side
of the Kent Vale Block H, as measured in
Bruelisauer et al. (2014). The measurement of
the stack effect was carried out on 23 November
2012. More details can be found in Bruelisauer
(2014). Since the air-conditioners are located in
the recessed area of Block H, horizontal wind is
not considered in this simulation. The patterns
of the simulated distributions of air temperature
(Figure 12) match well the observed data in
Bruelisauer et al. (2014). This indicates the tool
is able to capture microclimatic effects induced
by split type air-conditioners on high rise
buildings, which ensures the capability in
simulating impacts of building energy
consumption as one of the heat sources in urban
environment.
Development of An Integrated Urban Heat Island Simulation Tool
40 Annals of Ecology and Environmental Science V1 ● I1 ● 2017
Figure12. Validated simulated against measured data. Left: Validated vertical air temperature profile,
indicating stack effect. Right: Horizontal air temperature distribution as temperature difference to ambient air
temperature against measured data (top right image from Bruelisauer (2014)).
Impacts of Traffic
Heat induced by traffic system in megacities is
one of the major anthropogenic heat sources.
Estimations of major anthropogenic heat flux
includes building energy consumption, traffic
system and human metabolism are made in
Quah and Roth (2012). Time series of heat flux
due to traffic system from 6am to 8pm during
daytime (Figure 2) is adopted after part of
Figure 3 in Quah and Roth (2012), which is
employed as the forcing of traffic heat flux in
the simulation tool.
Effects of traffic on urban heat island effect, or
more specifically on the air temperature
distribution patterns are identified by comparing
the results of the base scenario where all regions
are concrete with the real situation where each
region is defined with its individual properties.
Air temperature distribution patterns at height of
0.5m above ground at 9am, 1pm and 5pm are
shown in Figure 13. 9 am is chosen as the
morning situation the heat flux induced by
traffic on Clementi Road is around 8.6 W/m2.
1pm represents the peak hour of solar radiation
as observed and indicated in Xu (2016), when
the traffic induced heat flux is around 14 W/ m2.
While 5pm stands for the afternoon situation
and the corresponding heat flux on Clementi
Road is set as 15 W/m2. Traffic induced heat
flux starts to increase from 7am, peaks at around
1pm and remains until around 8pm before
decreasing again.
It is found that the air temperature above
Clementi Road is more than 2C (up to 20 C)
higher than surrounding air throughout the
daytime except during the early morning. Before
9am when the traffic is not heavy, the air
temperature above Clementi Road is almost as
the same as other concrete regions. As shown in
Figure 13, it is also noticed that the heating
effects of Clementi Road reaches beyond its
upright regions and also heats up other parts
such as the region beside Block I through
convection. Due to radiation effects of the hot
road surface of Clementi Road, gradually
decreased heating effects are observed around
the Clementi Road, especially towards
Grassland 4 area. The interesting air temperature
distribution pattern around three high-rise
buildings and the verandah is decided the
interactions between building geometries, solar
radiation and surrounding cool air, which will
be investigated in another separate study.
Development of An Integrated Urban Heat Island Simulation Tool
Annals of Ecology and Environmental Science V1 ● I1 ● 2017 41
Figure13. Air temperature distribution pattern at height of 0.5m above ground at 9am (left), 1pm (middle) and
5pm (right) when all regions are concrete (upper) and with respective properties (lower), respectively.
Impacts of Grasslands
As illustrated in Figure 1, there are four
grasslands in this model, namely Grasslands 1
and 2 at the ground level in between the three
high-rise buildings and the verandah, Grassland
3 to the north of the verandah and Grassland 4
beside the Clementi Road located in the upper-
left corner of the model domain. Cooling effects
of grasslands are simulated by accounting for its
evapotranspiration rate throughout the day with
porous media technique of the region.
Both temporal and spatial effects of these four
grasslands can be identified with Figure 13. It is
found that the cooling effects of grasslands are
quite consistent throughout the whole day. The
distribution pattern of cooler zone is decided by
the interactions of the cool air around grasslands,
surrounding buildings and hotter air. Grasslands
1 and 2 is found to be able to cool down much
larger area than their upright surface through
intrusion into the hotter regions from gaps
between three high-rise buildings and the
verandah. The cooling effects of Grasslands 1
and 2 can be roughly estimated as 2C, as read
from Figure 6. Similar to Grasslands 1 and 2,
Grasslands 3 is also found to cool down the
surrounding environment by around 2C.
Shading effects from the high-rise buildings
could bring the air temperature by around 0.5C,
as can be observed in Figure 13. The cooling
effects of shading is most significant at noon,
which is around 1pm of Singapore time, as can
be seen in Figure 13. Deducting the cooling
effects of shading from the combined cooling
effects above Grasslands 1 and 2, their real
contributions are around 1.5C. Due to the
relatively smaller size, Grassland 4 is able to
cool down the surrounding hot air by around 0.5
C, which is the smallest among all four
grasslands.
To quantify the cooling effects of grasslands
along the vertical direction, air temperature
distribution pattern at heights of 1m, 1.5m and
2m above ground at 1pm are plotted in Figure
14 for Scenarios 1 and 2, respectively.
Combining with Figure 13, it is found that the
cooling effects of grasslands can reach up to 2m
above ground depends on their sizes. At the
height of 2m above ground, Grasslands 1 and 2
can still cool down the surrounding hot air by
more than 0.5C. Figure 14 also indicates the
cooling effects of shading from high-rise
buildings does not change much throughout the
day, as the simulation is carried out on 23
November when sun rises from Southeast and
Development of An Integrated Urban Heat Island Simulation Tool
42 Annals of Ecology and Environmental Science V1 ● I1 ● 2017
sets in Southwest. On this specific day, the open
space between three high-rise buildings and the
verandah is located in the shadow throughout
the daytime. The relatively cooler zone in the
middle of the open space between Blocks G, H
and I is mainly induced by the shading of Bridge
H. Although the cooler zone above Grasslands 3
and 4 could also go up to 2m above the ground,
the cooling effects are much smaller than those
of Grasslands 1 and 2, especially combining
with the shadings from the three high-rise
buildings. While Grassland 3 still can cool
down the hot air by less than 0.5C, which is
slighter stronger than that of Grassland 4.
Figur14. Air temperature distribution pattern at heights of 1m (left), 1.5m (middle) and 2m (right) above
ground at 1pm when all regions are concrete (upper) and with respective properties (lower), respectively.
Impacts of Water Bodies
Effects of water bodies on urban heat islands are
identified by comparing air temperature
distribution pattern above water surfaces with
the situation that there is no water body. To
simulate effects of water bodies on urban heat
islands, evaporation rates of the water bodies in
this model are set according to measured data.
As illustrated in Figure 1, there are five water
bodies in this model, namely Pools 1-4 located
at the ground floor beside Grasslands 1 and 2,
and the swimming pool at the top of the
verandah. Due to relatively smaller sizes of the
ground water feature pools, effects of water
bodies on urban heat islands are mainly focused
on the swimming pool. Since the swimming
pool is at the top of the verandah, air
temperature distribution pattern at heights of 7m,
7.5m and 8m at 1pm are plotted in Figure 15 for
both scenarios.
It is found that the air temperature at the water
surface of the swimming pool is around 1.5 C
cooler than the surrounding air, which is
relatively smaller than the cooling capability of
grasslands. The relatively cooler air can go up to
1m above the water surface with temperature of
around 0.5C lower than the surrounding air. In
addition, the cooled down region above the
water surface does not expand much through
radiation, which is slightly weaker than that of
grasslands. The possible reasons for difference
in cooling capabilities between grasslands and
water bodies can be mainly attributed to the
fundamental difference between evaporation
and evapotranspiration. Evaporation of water
from water bodies in urban area is mainly
induced by the heating effects of solar radiation.
Since small water bodies have relatively weaker
total amount of water evaporated during
daytime than huge water bodies such as lakes
and reservoirs. When the water bodies in urban
area are moving such as running rivers and
active coastal seas, the cooling effects due to
Development of An Integrated Urban Heat Island Simulation Tool
Annals of Ecology and Environmental Science V1 ● I1 ● 2017 43
evaporation of water bodies will be much
stronger than those of small water features such
as swimming pools and landscape pools. While
evapotranspiration of greenery includes
grasslands and trees is the combined effect of
both evaporation and transpiration. Due to
photosynthesis activities of greenery when there
is sufficient supply of sunlight, carbon dioxide,
nitrogen and phosphorus, much cooler water
vapor leaving the surfaces of leaves will enter
the environment with initial momentum, which
helps to magnify the cooling effects of greenery.
Other than cooling effects of water bodies, it is
recommended to name the effects of water
bodies as balancing effects, which will avoid the
surrounding environment from being neither too
hot nor too cold, as the specific heat capacity of
water is 4.2 times that of air.
As shown in Figure 15, it is also found that the
air temperature in the whole domain is slightly
lower with the existence of grasslands and water
bodies in the real situation than the base
scenario where all regions are regarded as
concrete. This combined cooling effect through
interactions between major heat sources and
sinks, and the surrounding air can be as high as
around 1C at critical locations around the
buildings even at the height of 8m above the
ground. Judging from Figure 15, the heating
effects of Clementi Road can still weakly affect
air temperature at the height of 8m above the
ground.
Figure15. Air temperature distribution pattern at heights of 7m (left), 7.5m (middle) and 8m (right) above
ground at 1pm when all regions are concrete (upper) and with respective properties (lower), respectively.
CONCLUSIONS
An integrated urban heat island simulation tool
is developed by accounting for major heat
sources and heat sinks in selected area of
interest, and their interactions with the
surrounding environment. By comparing
simulated solar radiation and air temperature on
a typical day of each month throughout the
whole year with observed data at Kent Vale
buildings, it is found that the simulation tool
could perform well in simulating solar radiation
and air temperature. A second validation case at
Punggol Waterway Terrace I further ensures the
capability of the developed integrated urban
heat island simulation toolin predicting air
temperature distribution pattern across the
model domain.
As an implementation example of the developed
integrated urban heat island simulation tool,
effects of traffic, grasslands and water bodies on
urban heat islands are investigated in this study
by comparing results from two different
scenarios, following the simulation-aided design
concept in Huang and Xu (2017). In Scenario 1,
all regions are set as concrete, while in Scenario
2, each region is set as its own property. It is
found that the air temperature above Clementi
Road is more than 2C and can be up to 20 C
Development of An Integrated Urban Heat Island Simulation Tool
44 Annals of Ecology and Environmental Science V1 ● I1 ● 2017
higher than surrounding air throughout the
daytime except during the early morning. Before
9am when the traffic is not heavy, the air
temperature above Clementi Road is almost as
the same as other concrete regions. The heating
up effects of Clementi Road also extends to
surrounding area through radiation and can
affect air temperature even at 8m above the
ground.
Cooling effects of grasslands are found to be
quite consistent throughout the whole day. The
distribution pattern of cooler zone is decided by
the interactions of the cool air around grasslands,
surrounding buildings and hotter air. Grasslands
is found to be able to cool down much larger
area than their upright surface through intrusion
into the hotter regions from gaps between three
high-rise buildings and the verandah. The
cooling effects of Grasslands can be roughly
estimated as 2C, with larger values for larger
grasslands. It is also found that the cooling
effects of grasslands can reach up to 2m above
ground depends on their sizes.
The air temperature at the water surface of the
swimming pool is found to be around 1.5 C
cooler than the surrounding air, which is
relatively smaller than the cooling capability of
grasslands. The relatively cooler air can go up to
1m above the water surface with temperature of
around 0.5C lower than the surrounding air. In
addition, the cooled down region above the
water surface does not expand much through
radiation, which is slightly weaker than that of
grasslands. The possible reasons for difference
in cooling capabilities between grasslands and
water bodies can be mainly attributed to the
fundamental difference between evaporation
and evapotranspiration. It is recommended to
name the effects of water bodies on urban heat
islands as balancing effects, which will avoid
the surrounding environment from being neither
too hot nor too cold.
By combing different urban heat islands
mitigation strategies such as increase the
greenery coverage with densely located
grasslands and trees and have more suitable
water bodies, better cooling effects can be
achieved to improve the thermal environment in
megacities. While such a combination of
different mitigation strategies of urban heat
island effect could be well evaluated by the
developed integrated urban heat island
simulation tool, as illustrated with the
implementation example.
ACKNOWLEDGEMENT
This work was financially supported by the
Singapore National Research Foundation (NRF)
under its Campus for Research Excellence And
Technological Enterprise (CREATE) program. I
would like to thank Dr. Marcel Bruelisauer for
providing the measured air conditioner stack
effects data on Kent Vale Block H, Richard Neil
Belcher for providing measured air temperature
data in Punggol Waterway Terrace I, Mayank
Kaushal and Dr. Xusheng Huang for providing
and editing the geometry file of Punggol
Waterway Terrace, respectively.
REFERENCES
[1] Allegrini, J. and Carmeliet, J., 2017.
Simulations of local heat islands in Zurich with
coupled CFD and building energy models.
Urban Climate, in press.
http://dx.doi.org/10.1016/j.uclim.2017.02.003.
[2] Allegrini, J., Dorer, V. and Carmeliet, J., 2015.
Coupled CFD, radiation and building energy
model for studying heat fluxes in an urban
environment with generic building
configurations. Sustainable Cities and Society,
19, 385-394.
[3] Bruelisauer, M., 2014. LowEx heat rejection
systems in the tropics: Beyond energy
efficiency, towards integrated multi-scale
cooling system. Doctoral Thesis No. 22273,
ETH Zurich.
[4] Bruelisauer, M., Meggers, F., Saber, E., Li, C.
and Leibundgut, H., 2014. Stuck in a stack –
Temperature measurement of the microclimate
around split typecondensing units in a high rise
building in Singapore. Energy and Buildings,
71, 28-37.
[5] Chen, Y. and Wong, N.H., 2006. Thermal
Benefits of City Parks. Energy and Buildings,
38(2), 105–120.
[6] Chow, W.T.L. and Roth, M., 2006. Temporal
Dynamics of the Urban Heat Island of
Singapore. International Journal of
Climatology, 26, 2243–2260.
[7] Chow, W.T.L., Salamanca, F., Georgescu, M.,
Mahalov, A., Milne, J.M. and Ruddell, B.L.,
2014. A Multi-Method and Multi-Scale
Approach for Estimating City-Wide
Anthropogenic Heat Fluxes. Atmospheric
Environment, 99, 64–76.
[8] Edwards, P.J., Hertig, T. and Sadlo, F., 2016.
Proceedings of the 4th
International Conference
on Countermeasures to Urban Heat Island,
Singapore.
[9] Fidaros, D., Baxevanou, C., Tsangrassoulis, A.,
Bartzanas, T. and Kittas, C., 2017. Bioclimatic
Reformation of urban area – a CFD study.
Procedia Environmental Science, 38, 586-594.
[10] Gao, Y., Xu, J., Yang, S., Tang, X., Zhou, Q.,
Ge, J., Xu, T. and Levinson, R., 2014. Cool
Roofs in China: Policy Review, Building
Development of An Integrated Urban Heat Island Simulation Tool
Annals of Ecology and Environmental Science V1 ● I1 ● 2017 45
Simulations, and Proof-of-Concept
Experiments. Energy Policy, 74, 190–214.
[11] Gertland, L., 2008. Heat Islands: Understanding
and Mitigating Heat in Urban Area. London:
Earthscan.
[12] Giannaros, T.M., Melas, D., Daglis, I.A. and
Keramitsoglou, I., 2014. Development of an
operational modelling system for urban heat
islands: an application to Athens, Greece.
Natural Hazards and Earth System Sciences,
14, 347-358.
[13] Howell, J.R., Siegel, R. and Menguc, M.P.,
(2010). Thermal Radiation Heat Transfer. Fifth
Edition. CRC Press.
[14] Huang, X. and Xu, M., 2017. Simulation Aided
Design: Using “CFD simulation – design loop”
for Better Thermal Environment. GSTF Journal
of Engineering Technology, 4(3), 8pp.
[15] Jusuf, S.K., Wong, N.H., Hagen, E., Anggoro,
R. and Hong, Y., 2007. The Influence of Land
Use on the Urban Heat Island in Singapore.
Habitat International, 31(2), 232–242.
[16] Li, X-X. and Norford, L.K., 2016. Evaluation
of cool roof and vegetations in mitigating urban
heat island in a tropical city, Singapore. Urban
Climate, 16, 59-74.
[17] Li, X-X., Koh, T.Y., Entekhabi, D., Roth, M.,
Panda, J. and Norford, L.K., 2013. A Multi-
Resolution Ensemble Study of a Tropical
Urban Environment and Its Interactions with
the Background Regional Atmosphere. Journal
of Geophysical Research – Atmospheres,
118(17), 9804–9818.
[18] Mackey, C.W., Lee, X. and Smith, R.B., 2012.
Remotely sensing the cooling effects of city
scale efforts to reduce urban heat island.
Building and Environment, 49, 348-358.
[19] Mirzaei, P.A., 2015. Recent challenges in
modelling of urban heat island. Sustainable
Cities and Society, 19, 200-206.
[20] Oke, T.R., 1973. City size and the urban heat
island. Atmospheric Environment, 7(8), 769-
779.
[21] Ooka, R., 2007. Recent development of
assessment tools for urban climate and heat-
island investigation especially based on
experiences in Japan. International Journal of
Climatology, 27, 1919-1930.
[22] Quah, A.K.L. and Roth, M., 2012. Diurnal and
weekly variation of anthropogenic heat
emissions in a tropical city, Singapore.
Atmospheric Environment, 46, 92-103.
[23] Roth, M, and Chow, W., 2012. A Historical
Review and Assessment of Urban Heat Island
Research in Singapore. Singapore Journal of
Tropical Geography, 33, 381–397.
[24] Saneinejad, S., Moonen, P., Defraeye, T.,
Derome, D. and Carmeliet, J., 2012. Coupled
CFD, radiation and porous media transport
model for evaluating evaporative cooling in an
urban environment. Journal of Wind
Engineering and Industrial Aerodynamics, 104-
106, 455-463.
[25] Shaffer, S.R., Chow, W.T.L., Georgescu, M.,
Hyde, P., Jenerette, G.D., Mahalov, A.,
Moustaoui, M. and Ruddell, B.L., 2014.
Multiscale Modeling and Evaluation of Urban
Surface Energy Balance in the Phoenix
Metropolitan Area. Journal of Applied
Meteorology and Climatology, 54(2), 322–338.
[26] Sproul, J., Wan, M.P., Mandel, B.H. and
Rosenfeld, A.H., 2014. Economic Comparison
of White, Green, and Black Flat Roofs in the
United States. Energy and Buildings, 71, 20–
27.
[27] Tan, C.L., Tan, P.Y., Wong, N.H., Takasuna,
H., Kudo, T., Takemasa, Y., Lim, C.V.J. and
Chua, H.X.V., 2017. Energy and Buildings, in
press,
http://dx.doi.org/10.1016/j.enbuild.2017.01.011.
[28] Tominaga Y., Sato, Y. and Sadohara, S., 2015.
CFD simulations of the effect of evaporative
cooling from water bodies in a micro-scale
urban environment: validation and application
studies. Sustainable Cities and Society, 19, 259-
270.
[29] Wong, N.H. and Chen, Y., 2006. Exploring the
Urban Heat Island Effect in Singapore. In
Tropical Sustainable Architecture, ed. Bay Joo
Hwa and Ong Boon Lay, 10-1-10-23. London:
Architectural Press, 23 pp.
[30] Xu, M., 2016. Towards a cooler Singapore.
Global Journal of Science Frontier Research,
16(3), 32-35.
[31] Xu, M., Brülisauer, M. and Berger, M., 2017.
Development of a new urban heat island
modelling tool: Kent Vale case study. Procedia
Computer Science, 108, 225-234.
[32] Xu, M., 2017. Impacts of Building Geometries
and Radiation Properties on Urban Thermal
Environment. Procedia Computer Science, 108,
2517-2521.

More Related Content

What's hot

Comparison of Latent Heat Flux Using Aerodynamic Methods and Using the Penman...
Comparison of Latent Heat Flux Using Aerodynamic Methods and Using the Penman...Comparison of Latent Heat Flux Using Aerodynamic Methods and Using the Penman...
Comparison of Latent Heat Flux Using Aerodynamic Methods and Using the Penman...Ramesh Dhungel
 
Climate Modelling, Predictions and Projections
Climate Modelling, Predictions and ProjectionsClimate Modelling, Predictions and Projections
Climate Modelling, Predictions and Projectionsipcc-media
 
Lesson 7 Basis for projection of climate change
Lesson 7   Basis for projection of climate changeLesson 7   Basis for projection of climate change
Lesson 7 Basis for projection of climate changeDr. P.B.Dharmasena
 
Downscaling global climate model outputs to fine scales over sri lanka for as...
Downscaling global climate model outputs to fine scales over sri lanka for as...Downscaling global climate model outputs to fine scales over sri lanka for as...
Downscaling global climate model outputs to fine scales over sri lanka for as...Pixel Clear (Pvt) Ltd
 
Arctic climate Change: observed and modelled temperature and sea-ice variability
Arctic climate Change: observed and modelled temperature and sea-ice variabilityArctic climate Change: observed and modelled temperature and sea-ice variability
Arctic climate Change: observed and modelled temperature and sea-ice variabilitySimoneBoccuccia
 
Human and natural_influences_on_the_changing_thermal_structure_of_the_atmosphere
Human and natural_influences_on_the_changing_thermal_structure_of_the_atmosphereHuman and natural_influences_on_the_changing_thermal_structure_of_the_atmosphere
Human and natural_influences_on_the_changing_thermal_structure_of_the_atmosphereSérgio Sacani
 
Modeling the Climate System: Is model-based science like model-based engineer...
Modeling the Climate System: Is model-based science like model-based engineer...Modeling the Climate System: Is model-based science like model-based engineer...
Modeling the Climate System: Is model-based science like model-based engineer...Steve Easterbrook
 
Publication_Draft_09Aug
Publication_Draft_09AugPublication_Draft_09Aug
Publication_Draft_09AugKevin Schmidt
 
Climate Modeling and Future Climate Change Projections
Climate Modeling and Future Climate Change ProjectionsClimate Modeling and Future Climate Change Projections
Climate Modeling and Future Climate Change ProjectionsJesbin Baidya
 
Climatology Applied To Architecture: An Experimental Investigation about Inte...
Climatology Applied To Architecture: An Experimental Investigation about Inte...Climatology Applied To Architecture: An Experimental Investigation about Inte...
Climatology Applied To Architecture: An Experimental Investigation about Inte...IJERA Editor
 
Analysis of the Temperature Changes in the Aburrá Valley between 1995 and 201...
Analysis of the Temperature Changes in the Aburrá Valley between 1995 and 201...Analysis of the Temperature Changes in the Aburrá Valley between 1995 and 201...
Analysis of the Temperature Changes in the Aburrá Valley between 1995 and 201...Enrique Posada
 
Dissertation_James_Brooks_MSc_Final_version
Dissertation_James_Brooks_MSc_Final_versionDissertation_James_Brooks_MSc_Final_version
Dissertation_James_Brooks_MSc_Final_versionJames Brooks
 
Modeling Past and Future Climate
Modeling Past and Future ClimateModeling Past and Future Climate
Modeling Past and Future ClimateAndreas Schmittner
 
Forecasting of air temperature based on remote
Forecasting of air temperature based on remoteForecasting of air temperature based on remote
Forecasting of air temperature based on remotemehmet şahin
 
The Relationship between Surface Soil Moisture with Real Evaporation and Pote...
The Relationship between Surface Soil Moisture with Real Evaporation and Pote...The Relationship between Surface Soil Moisture with Real Evaporation and Pote...
The Relationship between Surface Soil Moisture with Real Evaporation and Pote...IJEAB
 
Precipitable water modelling using artificial neural
Precipitable water modelling using artificial neuralPrecipitable water modelling using artificial neural
Precipitable water modelling using artificial neuralmehmet şahin
 

What's hot (20)

Comparison of Latent Heat Flux Using Aerodynamic Methods and Using the Penman...
Comparison of Latent Heat Flux Using Aerodynamic Methods and Using the Penman...Comparison of Latent Heat Flux Using Aerodynamic Methods and Using the Penman...
Comparison of Latent Heat Flux Using Aerodynamic Methods and Using the Penman...
 
Climate Modelling, Predictions and Projections
Climate Modelling, Predictions and ProjectionsClimate Modelling, Predictions and Projections
Climate Modelling, Predictions and Projections
 
B1060612
B1060612B1060612
B1060612
 
Lesson 7 Basis for projection of climate change
Lesson 7   Basis for projection of climate changeLesson 7   Basis for projection of climate change
Lesson 7 Basis for projection of climate change
 
Downscaling global climate model outputs to fine scales over sri lanka for as...
Downscaling global climate model outputs to fine scales over sri lanka for as...Downscaling global climate model outputs to fine scales over sri lanka for as...
Downscaling global climate model outputs to fine scales over sri lanka for as...
 
Arctic climate Change: observed and modelled temperature and sea-ice variability
Arctic climate Change: observed and modelled temperature and sea-ice variabilityArctic climate Change: observed and modelled temperature and sea-ice variability
Arctic climate Change: observed and modelled temperature and sea-ice variability
 
Climate Models
Climate ModelsClimate Models
Climate Models
 
Human and natural_influences_on_the_changing_thermal_structure_of_the_atmosphere
Human and natural_influences_on_the_changing_thermal_structure_of_the_atmosphereHuman and natural_influences_on_the_changing_thermal_structure_of_the_atmosphere
Human and natural_influences_on_the_changing_thermal_structure_of_the_atmosphere
 
Modeling the Climate System: Is model-based science like model-based engineer...
Modeling the Climate System: Is model-based science like model-based engineer...Modeling the Climate System: Is model-based science like model-based engineer...
Modeling the Climate System: Is model-based science like model-based engineer...
 
Publication_Draft_09Aug
Publication_Draft_09AugPublication_Draft_09Aug
Publication_Draft_09Aug
 
Climate Modeling and Future Climate Change Projections
Climate Modeling and Future Climate Change ProjectionsClimate Modeling and Future Climate Change Projections
Climate Modeling and Future Climate Change Projections
 
Climatology Applied To Architecture: An Experimental Investigation about Inte...
Climatology Applied To Architecture: An Experimental Investigation about Inte...Climatology Applied To Architecture: An Experimental Investigation about Inte...
Climatology Applied To Architecture: An Experimental Investigation about Inte...
 
Analysis of the Temperature Changes in the Aburrá Valley between 1995 and 201...
Analysis of the Temperature Changes in the Aburrá Valley between 1995 and 201...Analysis of the Temperature Changes in the Aburrá Valley between 1995 and 201...
Analysis of the Temperature Changes in the Aburrá Valley between 1995 and 201...
 
Dissertation_James_Brooks_MSc_Final_version
Dissertation_James_Brooks_MSc_Final_versionDissertation_James_Brooks_MSc_Final_version
Dissertation_James_Brooks_MSc_Final_version
 
Modeling Past and Future Climate
Modeling Past and Future ClimateModeling Past and Future Climate
Modeling Past and Future Climate
 
Forecasting of air temperature based on remote
Forecasting of air temperature based on remoteForecasting of air temperature based on remote
Forecasting of air temperature based on remote
 
The Relationship between Surface Soil Moisture with Real Evaporation and Pote...
The Relationship between Surface Soil Moisture with Real Evaporation and Pote...The Relationship between Surface Soil Moisture with Real Evaporation and Pote...
The Relationship between Surface Soil Moisture with Real Evaporation and Pote...
 
Nwp final paper
Nwp final paperNwp final paper
Nwp final paper
 
Workshop climate variability and modeling in Laos
Workshop climate variability and modeling in LaosWorkshop climate variability and modeling in Laos
Workshop climate variability and modeling in Laos
 
Precipitable water modelling using artificial neural
Precipitable water modelling using artificial neuralPrecipitable water modelling using artificial neural
Precipitable water modelling using artificial neural
 

Similar to Development of an Integrated Urban Heat Island Simulation Tool

A368 afa1 b0f8-4b79-812f-980f7dc622bf
A368 afa1 b0f8-4b79-812f-980f7dc622bfA368 afa1 b0f8-4b79-812f-980f7dc622bf
A368 afa1 b0f8-4b79-812f-980f7dc622bfShatabdi Mahanta
 
Urban Heat Island Paper.pdf
Urban Heat Island Paper.pdfUrban Heat Island Paper.pdf
Urban Heat Island Paper.pdfMeenu Rani
 
The impact of outdoor thermal environment on iraqi building
The impact of outdoor thermal environment on iraqi buildingThe impact of outdoor thermal environment on iraqi building
The impact of outdoor thermal environment on iraqi buildingAlexander Decker
 
A study on the strategies of Park City construction of Chengdu from the persp...
A study on the strategies of Park City construction of Chengdu from the persp...A study on the strategies of Park City construction of Chengdu from the persp...
A study on the strategies of Park City construction of Chengdu from the persp...IEREK Press
 
environments-06-00082-v2.pdf
environments-06-00082-v2.pdfenvironments-06-00082-v2.pdf
environments-06-00082-v2.pdfLilithlit
 
A MAGNIFICATION PLAN FOR THE URBAN HEAT ISLAND EFFECT: URBAN GREEN SPACE DEVE...
A MAGNIFICATION PLAN FOR THE URBAN HEAT ISLAND EFFECT: URBAN GREEN SPACE DEVE...A MAGNIFICATION PLAN FOR THE URBAN HEAT ISLAND EFFECT: URBAN GREEN SPACE DEVE...
A MAGNIFICATION PLAN FOR THE URBAN HEAT ISLAND EFFECT: URBAN GREEN SPACE DEVE...IRJET Journal
 
Estimation of diffuse solar radiation in the south of cameroon
Estimation of diffuse solar radiation in the south of cameroonEstimation of diffuse solar radiation in the south of cameroon
Estimation of diffuse solar radiation in the south of cameroonAlexander Decker
 
REVIEW OF THE URBAN HEAT ISLAND PHENOMENON ANALYSIS AS AN ADAPTATION TO CLIMA...
REVIEW OF THE URBAN HEAT ISLAND PHENOMENON ANALYSIS AS AN ADAPTATION TO CLIMA...REVIEW OF THE URBAN HEAT ISLAND PHENOMENON ANALYSIS AS AN ADAPTATION TO CLIMA...
REVIEW OF THE URBAN HEAT ISLAND PHENOMENON ANALYSIS AS AN ADAPTATION TO CLIMA...civej
 
Civil Engineering and Urban Planning: An International Journal (CiVEJ)
Civil Engineering and Urban Planning: An International Journal (CiVEJ)Civil Engineering and Urban Planning: An International Journal (CiVEJ)
Civil Engineering and Urban Planning: An International Journal (CiVEJ)civejjour
 
Reducing urban heat island effects
Reducing urban heat island effectsReducing urban heat island effects
Reducing urban heat island effectsShakya Ganguly
 
CFD AND DOE STUDY THE EFFECT OF SOLAR CHIMNEY TOWER RADIUS, HEIGHT, CHIMNEY R...
CFD AND DOE STUDY THE EFFECT OF SOLAR CHIMNEY TOWER RADIUS, HEIGHT, CHIMNEY R...CFD AND DOE STUDY THE EFFECT OF SOLAR CHIMNEY TOWER RADIUS, HEIGHT, CHIMNEY R...
CFD AND DOE STUDY THE EFFECT OF SOLAR CHIMNEY TOWER RADIUS, HEIGHT, CHIMNEY R...IAEME Publication
 
SIMULATION OF VAPOR AND HEAT FLUXES OVER WET AND DRY REGIME IN PADDY FIELD EN...
SIMULATION OF VAPOR AND HEAT FLUXES OVER WET AND DRY REGIME IN PADDY FIELD EN...SIMULATION OF VAPOR AND HEAT FLUXES OVER WET AND DRY REGIME IN PADDY FIELD EN...
SIMULATION OF VAPOR AND HEAT FLUXES OVER WET AND DRY REGIME IN PADDY FIELD EN...IAEME Publication
 
Thermal Comfor modelling presentation
Thermal Comfor modelling presentationThermal Comfor modelling presentation
Thermal Comfor modelling presentationAlonsoLucille
 
Ac.els cdn.com s0169204613002120-1-s2.0-s0169204613002120-main
Ac.els cdn.com s0169204613002120-1-s2.0-s0169204613002120-mainAc.els cdn.com s0169204613002120-1-s2.0-s0169204613002120-main
Ac.els cdn.com s0169204613002120-1-s2.0-s0169204613002120-mainShatabdi Mahanta
 
Computational Fluid Dynamics (CFD) Analysis of Natural Convection of Converge...
Computational Fluid Dynamics (CFD) Analysis of Natural Convection of Converge...Computational Fluid Dynamics (CFD) Analysis of Natural Convection of Converge...
Computational Fluid Dynamics (CFD) Analysis of Natural Convection of Converge...IJERA Editor
 
Mediterranean Morphologies in Hot Summer Conditions: Learning from France’s “...
Mediterranean Morphologies in Hot Summer Conditions: Learning from France’s “...Mediterranean Morphologies in Hot Summer Conditions: Learning from France’s “...
Mediterranean Morphologies in Hot Summer Conditions: Learning from France’s “...Journal of Contemporary Urban Affairs
 
Climate Variability: Integration of Renewable Energy into Present and Future ...
Climate Variability: Integration of Renewable Energy into Present and Future ...Climate Variability: Integration of Renewable Energy into Present and Future ...
Climate Variability: Integration of Renewable Energy into Present and Future ...AI Publications
 

Similar to Development of an Integrated Urban Heat Island Simulation Tool (20)

A368 afa1 b0f8-4b79-812f-980f7dc622bf
A368 afa1 b0f8-4b79-812f-980f7dc622bfA368 afa1 b0f8-4b79-812f-980f7dc622bf
A368 afa1 b0f8-4b79-812f-980f7dc622bf
 
Urban Heat Island Paper.pdf
Urban Heat Island Paper.pdfUrban Heat Island Paper.pdf
Urban Heat Island Paper.pdf
 
The impact of outdoor thermal environment on iraqi building
The impact of outdoor thermal environment on iraqi buildingThe impact of outdoor thermal environment on iraqi building
The impact of outdoor thermal environment on iraqi building
 
A study on the strategies of Park City construction of Chengdu from the persp...
A study on the strategies of Park City construction of Chengdu from the persp...A study on the strategies of Park City construction of Chengdu from the persp...
A study on the strategies of Park City construction of Chengdu from the persp...
 
Ijetcas14 508
Ijetcas14 508Ijetcas14 508
Ijetcas14 508
 
environments-06-00082-v2.pdf
environments-06-00082-v2.pdfenvironments-06-00082-v2.pdf
environments-06-00082-v2.pdf
 
A MAGNIFICATION PLAN FOR THE URBAN HEAT ISLAND EFFECT: URBAN GREEN SPACE DEVE...
A MAGNIFICATION PLAN FOR THE URBAN HEAT ISLAND EFFECT: URBAN GREEN SPACE DEVE...A MAGNIFICATION PLAN FOR THE URBAN HEAT ISLAND EFFECT: URBAN GREEN SPACE DEVE...
A MAGNIFICATION PLAN FOR THE URBAN HEAT ISLAND EFFECT: URBAN GREEN SPACE DEVE...
 
The effect of using solar chimney on reduced heating load in cold climate of US
The effect of using solar chimney on reduced heating load in cold climate of USThe effect of using solar chimney on reduced heating load in cold climate of US
The effect of using solar chimney on reduced heating load in cold climate of US
 
Estimation of diffuse solar radiation in the south of cameroon
Estimation of diffuse solar radiation in the south of cameroonEstimation of diffuse solar radiation in the south of cameroon
Estimation of diffuse solar radiation in the south of cameroon
 
REVIEW OF THE URBAN HEAT ISLAND PHENOMENON ANALYSIS AS AN ADAPTATION TO CLIMA...
REVIEW OF THE URBAN HEAT ISLAND PHENOMENON ANALYSIS AS AN ADAPTATION TO CLIMA...REVIEW OF THE URBAN HEAT ISLAND PHENOMENON ANALYSIS AS AN ADAPTATION TO CLIMA...
REVIEW OF THE URBAN HEAT ISLAND PHENOMENON ANALYSIS AS AN ADAPTATION TO CLIMA...
 
Civil Engineering and Urban Planning: An International Journal (CiVEJ)
Civil Engineering and Urban Planning: An International Journal (CiVEJ)Civil Engineering and Urban Planning: An International Journal (CiVEJ)
Civil Engineering and Urban Planning: An International Journal (CiVEJ)
 
Reducing urban heat island effects
Reducing urban heat island effectsReducing urban heat island effects
Reducing urban heat island effects
 
30120140505021
3012014050502130120140505021
30120140505021
 
CFD AND DOE STUDY THE EFFECT OF SOLAR CHIMNEY TOWER RADIUS, HEIGHT, CHIMNEY R...
CFD AND DOE STUDY THE EFFECT OF SOLAR CHIMNEY TOWER RADIUS, HEIGHT, CHIMNEY R...CFD AND DOE STUDY THE EFFECT OF SOLAR CHIMNEY TOWER RADIUS, HEIGHT, CHIMNEY R...
CFD AND DOE STUDY THE EFFECT OF SOLAR CHIMNEY TOWER RADIUS, HEIGHT, CHIMNEY R...
 
SIMULATION OF VAPOR AND HEAT FLUXES OVER WET AND DRY REGIME IN PADDY FIELD EN...
SIMULATION OF VAPOR AND HEAT FLUXES OVER WET AND DRY REGIME IN PADDY FIELD EN...SIMULATION OF VAPOR AND HEAT FLUXES OVER WET AND DRY REGIME IN PADDY FIELD EN...
SIMULATION OF VAPOR AND HEAT FLUXES OVER WET AND DRY REGIME IN PADDY FIELD EN...
 
Thermal Comfor modelling presentation
Thermal Comfor modelling presentationThermal Comfor modelling presentation
Thermal Comfor modelling presentation
 
Ac.els cdn.com s0169204613002120-1-s2.0-s0169204613002120-main
Ac.els cdn.com s0169204613002120-1-s2.0-s0169204613002120-mainAc.els cdn.com s0169204613002120-1-s2.0-s0169204613002120-main
Ac.els cdn.com s0169204613002120-1-s2.0-s0169204613002120-main
 
Computational Fluid Dynamics (CFD) Analysis of Natural Convection of Converge...
Computational Fluid Dynamics (CFD) Analysis of Natural Convection of Converge...Computational Fluid Dynamics (CFD) Analysis of Natural Convection of Converge...
Computational Fluid Dynamics (CFD) Analysis of Natural Convection of Converge...
 
Mediterranean Morphologies in Hot Summer Conditions: Learning from France’s “...
Mediterranean Morphologies in Hot Summer Conditions: Learning from France’s “...Mediterranean Morphologies in Hot Summer Conditions: Learning from France’s “...
Mediterranean Morphologies in Hot Summer Conditions: Learning from France’s “...
 
Climate Variability: Integration of Renewable Energy into Present and Future ...
Climate Variability: Integration of Renewable Energy into Present and Future ...Climate Variability: Integration of Renewable Energy into Present and Future ...
Climate Variability: Integration of Renewable Energy into Present and Future ...
 

More from Sryahwa Publications

The Role of Indigenous People Knowledge in the Biodiversity Conservation in ...
The Role of Indigenous People Knowledge in the Biodiversity  Conservation in ...The Role of Indigenous People Knowledge in the Biodiversity  Conservation in ...
The Role of Indigenous People Knowledge in the Biodiversity Conservation in ...Sryahwa Publications
 
The Social Daily Activity Correlation of Olive Baboon (Papio Anubis) in Gash...
The Social Daily Activity Correlation of Olive Baboon (Papio  Anubis) in Gash...The Social Daily Activity Correlation of Olive Baboon (Papio  Anubis) in Gash...
The Social Daily Activity Correlation of Olive Baboon (Papio Anubis) in Gash...Sryahwa Publications
 
Formation Patterns of Acridid Communities in Urban Landscapes of Turkmenistan
Formation Patterns of Acridid Communities in Urban  Landscapes of TurkmenistanFormation Patterns of Acridid Communities in Urban  Landscapes of Turkmenistan
Formation Patterns of Acridid Communities in Urban Landscapes of TurkmenistanSryahwa Publications
 
Effects of Baryte Mining on Water Quality in Azara-Awe Local Government Area...
Effects of Baryte Mining on Water Quality in Azara-Awe Local  Government Area...Effects of Baryte Mining on Water Quality in Azara-Awe Local  Government Area...
Effects of Baryte Mining on Water Quality in Azara-Awe Local Government Area...Sryahwa Publications
 
Evaluation of the Optimum Conditions for Biotechnological Magnesite Enrichment
Evaluation of the Optimum Conditions for Biotechnological  Magnesite EnrichmentEvaluation of the Optimum Conditions for Biotechnological  Magnesite Enrichment
Evaluation of the Optimum Conditions for Biotechnological Magnesite EnrichmentSryahwa Publications
 
Assessment of Air Quality along Urbanization Gradient in Apo District of the...
Assessment of Air Quality along Urbanization Gradient in Apo  District of the...Assessment of Air Quality along Urbanization Gradient in Apo  District of the...
Assessment of Air Quality along Urbanization Gradient in Apo District of the...Sryahwa Publications
 
Quality of Life (QoL) of Rural Dwellers in Nigeria: A Subjective Assessment ...
Quality of Life (QoL) of Rural Dwellers in Nigeria: A  Subjective Assessment ...Quality of Life (QoL) of Rural Dwellers in Nigeria: A  Subjective Assessment ...
Quality of Life (QoL) of Rural Dwellers in Nigeria: A Subjective Assessment ...Sryahwa Publications
 
Assessment of Endophytic Fungal Flora Responsible for Plant Growth Promotion...
Assessment of Endophytic Fungal Flora Responsible for Plant  Growth Promotion...Assessment of Endophytic Fungal Flora Responsible for Plant  Growth Promotion...
Assessment of Endophytic Fungal Flora Responsible for Plant Growth Promotion...Sryahwa Publications
 
Alleviation of Water Stress on Photosynthesis in Oilyplants
Alleviation of Water Stress on Photosynthesis in OilyplantsAlleviation of Water Stress on Photosynthesis in Oilyplants
Alleviation of Water Stress on Photosynthesis in OilyplantsSryahwa Publications
 
Mitochondrial Complex 1is Important for Plant Tolerance to Fungal Biotic Stress
Mitochondrial Complex 1is Important for Plant Tolerance to  Fungal Biotic StressMitochondrial Complex 1is Important for Plant Tolerance to  Fungal Biotic Stress
Mitochondrial Complex 1is Important for Plant Tolerance to Fungal Biotic StressSryahwa Publications
 
An Ecological, Socio-Economic and Silvicultural Assessment of the Sustainabi...
An Ecological, Socio-Economic and Silvicultural Assessment of  the Sustainabi...An Ecological, Socio-Economic and Silvicultural Assessment of  the Sustainabi...
An Ecological, Socio-Economic and Silvicultural Assessment of the Sustainabi...Sryahwa Publications
 
Medicine and Healthcare Journals-Sryahwa Publications
Medicine and Healthcare Journals-Sryahwa PublicationsMedicine and Healthcare Journals-Sryahwa Publications
Medicine and Healthcare Journals-Sryahwa PublicationsSryahwa Publications
 
Sryahwa Publications Engineering and Technology Journals
Sryahwa Publications Engineering and Technology JournalsSryahwa Publications Engineering and Technology Journals
Sryahwa Publications Engineering and Technology JournalsSryahwa Publications
 

More from Sryahwa Publications (13)

The Role of Indigenous People Knowledge in the Biodiversity Conservation in ...
The Role of Indigenous People Knowledge in the Biodiversity  Conservation in ...The Role of Indigenous People Knowledge in the Biodiversity  Conservation in ...
The Role of Indigenous People Knowledge in the Biodiversity Conservation in ...
 
The Social Daily Activity Correlation of Olive Baboon (Papio Anubis) in Gash...
The Social Daily Activity Correlation of Olive Baboon (Papio  Anubis) in Gash...The Social Daily Activity Correlation of Olive Baboon (Papio  Anubis) in Gash...
The Social Daily Activity Correlation of Olive Baboon (Papio Anubis) in Gash...
 
Formation Patterns of Acridid Communities in Urban Landscapes of Turkmenistan
Formation Patterns of Acridid Communities in Urban  Landscapes of TurkmenistanFormation Patterns of Acridid Communities in Urban  Landscapes of Turkmenistan
Formation Patterns of Acridid Communities in Urban Landscapes of Turkmenistan
 
Effects of Baryte Mining on Water Quality in Azara-Awe Local Government Area...
Effects of Baryte Mining on Water Quality in Azara-Awe Local  Government Area...Effects of Baryte Mining on Water Quality in Azara-Awe Local  Government Area...
Effects of Baryte Mining on Water Quality in Azara-Awe Local Government Area...
 
Evaluation of the Optimum Conditions for Biotechnological Magnesite Enrichment
Evaluation of the Optimum Conditions for Biotechnological  Magnesite EnrichmentEvaluation of the Optimum Conditions for Biotechnological  Magnesite Enrichment
Evaluation of the Optimum Conditions for Biotechnological Magnesite Enrichment
 
Assessment of Air Quality along Urbanization Gradient in Apo District of the...
Assessment of Air Quality along Urbanization Gradient in Apo  District of the...Assessment of Air Quality along Urbanization Gradient in Apo  District of the...
Assessment of Air Quality along Urbanization Gradient in Apo District of the...
 
Quality of Life (QoL) of Rural Dwellers in Nigeria: A Subjective Assessment ...
Quality of Life (QoL) of Rural Dwellers in Nigeria: A  Subjective Assessment ...Quality of Life (QoL) of Rural Dwellers in Nigeria: A  Subjective Assessment ...
Quality of Life (QoL) of Rural Dwellers in Nigeria: A Subjective Assessment ...
 
Assessment of Endophytic Fungal Flora Responsible for Plant Growth Promotion...
Assessment of Endophytic Fungal Flora Responsible for Plant  Growth Promotion...Assessment of Endophytic Fungal Flora Responsible for Plant  Growth Promotion...
Assessment of Endophytic Fungal Flora Responsible for Plant Growth Promotion...
 
Alleviation of Water Stress on Photosynthesis in Oilyplants
Alleviation of Water Stress on Photosynthesis in OilyplantsAlleviation of Water Stress on Photosynthesis in Oilyplants
Alleviation of Water Stress on Photosynthesis in Oilyplants
 
Mitochondrial Complex 1is Important for Plant Tolerance to Fungal Biotic Stress
Mitochondrial Complex 1is Important for Plant Tolerance to  Fungal Biotic StressMitochondrial Complex 1is Important for Plant Tolerance to  Fungal Biotic Stress
Mitochondrial Complex 1is Important for Plant Tolerance to Fungal Biotic Stress
 
An Ecological, Socio-Economic and Silvicultural Assessment of the Sustainabi...
An Ecological, Socio-Economic and Silvicultural Assessment of  the Sustainabi...An Ecological, Socio-Economic and Silvicultural Assessment of  the Sustainabi...
An Ecological, Socio-Economic and Silvicultural Assessment of the Sustainabi...
 
Medicine and Healthcare Journals-Sryahwa Publications
Medicine and Healthcare Journals-Sryahwa PublicationsMedicine and Healthcare Journals-Sryahwa Publications
Medicine and Healthcare Journals-Sryahwa Publications
 
Sryahwa Publications Engineering and Technology Journals
Sryahwa Publications Engineering and Technology JournalsSryahwa Publications Engineering and Technology Journals
Sryahwa Publications Engineering and Technology Journals
 

Recently uploaded

Call Girls Abids 7001305949 all area service COD available Any Time
Call Girls Abids 7001305949 all area service COD available Any TimeCall Girls Abids 7001305949 all area service COD available Any Time
Call Girls Abids 7001305949 all area service COD available Any Timedelhimodelshub1
 
Poly-film-Prefab cover agricultural greenhouse-polyhouse structure.pptx
Poly-film-Prefab cover agricultural greenhouse-polyhouse structure.pptxPoly-film-Prefab cover agricultural greenhouse-polyhouse structure.pptx
Poly-film-Prefab cover agricultural greenhouse-polyhouse structure.pptxAgrodome projects LLP
 
Species composition, diversity and community structure of mangroves in Barang...
Species composition, diversity and community structure of mangroves in Barang...Species composition, diversity and community structure of mangroves in Barang...
Species composition, diversity and community structure of mangroves in Barang...Open Access Research Paper
 
Delivering nature-based solution outcomes by addressing policy, institutiona...
Delivering nature-based solution outcomes by addressing  policy, institutiona...Delivering nature-based solution outcomes by addressing  policy, institutiona...
Delivering nature-based solution outcomes by addressing policy, institutiona...CIFOR-ICRAF
 
Call Girls South Delhi Delhi reach out to us at ☎ 9711199012
Call Girls South Delhi Delhi reach out to us at ☎ 9711199012Call Girls South Delhi Delhi reach out to us at ☎ 9711199012
Call Girls South Delhi Delhi reach out to us at ☎ 9711199012sapnasaifi408
 
Limnology and Wetland Management 2023 NaRM.pptx
Limnology and Wetland Management 2023 NaRM.pptxLimnology and Wetland Management 2023 NaRM.pptx
Limnology and Wetland Management 2023 NaRM.pptxTesfahunTesema
 
9873940964 Full Enjoy 24/7 Call Girls Near Shangri La’s Eros Hotel, New Delhi
9873940964 Full Enjoy 24/7 Call Girls Near Shangri La’s Eros Hotel, New Delhi9873940964 Full Enjoy 24/7 Call Girls Near Shangri La’s Eros Hotel, New Delhi
9873940964 Full Enjoy 24/7 Call Girls Near Shangri La’s Eros Hotel, New Delhidelih Escorts
 
VIP Call Girls Service Bandlaguda Hyderabad Call +91-8250192130
VIP Call Girls Service Bandlaguda Hyderabad Call +91-8250192130VIP Call Girls Service Bandlaguda Hyderabad Call +91-8250192130
VIP Call Girls Service Bandlaguda Hyderabad Call +91-8250192130Suhani Kapoor
 
Determination of antibacterial activity of various broad spectrum antibiotics...
Determination of antibacterial activity of various broad spectrum antibiotics...Determination of antibacterial activity of various broad spectrum antibiotics...
Determination of antibacterial activity of various broad spectrum antibiotics...Open Access Research Paper
 
Unit 1 - introduction to environmental studies.pdf
Unit 1 - introduction to environmental studies.pdfUnit 1 - introduction to environmental studies.pdf
Unit 1 - introduction to environmental studies.pdfRajjnish1
 
Thessaly master plan- WWF presentation_18.04.24.pdf
Thessaly master plan- WWF presentation_18.04.24.pdfThessaly master plan- WWF presentation_18.04.24.pdf
Thessaly master plan- WWF presentation_18.04.24.pdfTheaMan11
 
原版1:1复刻塔夫斯大学毕业证Tufts毕业证留信学历认证
原版1:1复刻塔夫斯大学毕业证Tufts毕业证留信学历认证原版1:1复刻塔夫斯大学毕业证Tufts毕业证留信学历认证
原版1:1复刻塔夫斯大学毕业证Tufts毕业证留信学历认证jdkhjh
 
885MTAMount DMU University Bachelor's Diploma in Education
885MTAMount DMU University Bachelor's Diploma in Education885MTAMount DMU University Bachelor's Diploma in Education
885MTAMount DMU University Bachelor's Diploma in Educationz xss
 
Call Girls Ahmedabad 7397865700 Ridhima Hire Me Full Night
Call Girls Ahmedabad 7397865700 Ridhima Hire Me Full NightCall Girls Ahmedabad 7397865700 Ridhima Hire Me Full Night
Call Girls Ahmedabad 7397865700 Ridhima Hire Me Full Nightssuser7cb4ff
 

Recently uploaded (20)

Call Girls Abids 7001305949 all area service COD available Any Time
Call Girls Abids 7001305949 all area service COD available Any TimeCall Girls Abids 7001305949 all area service COD available Any Time
Call Girls Abids 7001305949 all area service COD available Any Time
 
Model Call Girl in Rajiv Chowk Delhi reach out to us at 🔝9953056974🔝
Model Call Girl in Rajiv Chowk Delhi reach out to us at 🔝9953056974🔝Model Call Girl in Rajiv Chowk Delhi reach out to us at 🔝9953056974🔝
Model Call Girl in Rajiv Chowk Delhi reach out to us at 🔝9953056974🔝
 
Poly-film-Prefab cover agricultural greenhouse-polyhouse structure.pptx
Poly-film-Prefab cover agricultural greenhouse-polyhouse structure.pptxPoly-film-Prefab cover agricultural greenhouse-polyhouse structure.pptx
Poly-film-Prefab cover agricultural greenhouse-polyhouse structure.pptx
 
Species composition, diversity and community structure of mangroves in Barang...
Species composition, diversity and community structure of mangroves in Barang...Species composition, diversity and community structure of mangroves in Barang...
Species composition, diversity and community structure of mangroves in Barang...
 
Delivering nature-based solution outcomes by addressing policy, institutiona...
Delivering nature-based solution outcomes by addressing  policy, institutiona...Delivering nature-based solution outcomes by addressing  policy, institutiona...
Delivering nature-based solution outcomes by addressing policy, institutiona...
 
Call Girls South Delhi Delhi reach out to us at ☎ 9711199012
Call Girls South Delhi Delhi reach out to us at ☎ 9711199012Call Girls South Delhi Delhi reach out to us at ☎ 9711199012
Call Girls South Delhi Delhi reach out to us at ☎ 9711199012
 
FULL ENJOY Call Girls In kashmiri gate (Delhi) Call Us 9953056974
FULL ENJOY Call Girls In  kashmiri gate (Delhi) Call Us 9953056974FULL ENJOY Call Girls In  kashmiri gate (Delhi) Call Us 9953056974
FULL ENJOY Call Girls In kashmiri gate (Delhi) Call Us 9953056974
 
Sexy Call Girls Patel Nagar New Delhi +918448380779 Call Girls Service in Del...
Sexy Call Girls Patel Nagar New Delhi +918448380779 Call Girls Service in Del...Sexy Call Girls Patel Nagar New Delhi +918448380779 Call Girls Service in Del...
Sexy Call Girls Patel Nagar New Delhi +918448380779 Call Girls Service in Del...
 
Limnology and Wetland Management 2023 NaRM.pptx
Limnology and Wetland Management 2023 NaRM.pptxLimnology and Wetland Management 2023 NaRM.pptx
Limnology and Wetland Management 2023 NaRM.pptx
 
9873940964 Full Enjoy 24/7 Call Girls Near Shangri La’s Eros Hotel, New Delhi
9873940964 Full Enjoy 24/7 Call Girls Near Shangri La’s Eros Hotel, New Delhi9873940964 Full Enjoy 24/7 Call Girls Near Shangri La’s Eros Hotel, New Delhi
9873940964 Full Enjoy 24/7 Call Girls Near Shangri La’s Eros Hotel, New Delhi
 
VIP Call Girls Service Bandlaguda Hyderabad Call +91-8250192130
VIP Call Girls Service Bandlaguda Hyderabad Call +91-8250192130VIP Call Girls Service Bandlaguda Hyderabad Call +91-8250192130
VIP Call Girls Service Bandlaguda Hyderabad Call +91-8250192130
 
young call girls in Janakpuri🔝 9953056974 🔝 escort Service
young call girls in Janakpuri🔝 9953056974 🔝 escort Serviceyoung call girls in Janakpuri🔝 9953056974 🔝 escort Service
young call girls in Janakpuri🔝 9953056974 🔝 escort Service
 
Determination of antibacterial activity of various broad spectrum antibiotics...
Determination of antibacterial activity of various broad spectrum antibiotics...Determination of antibacterial activity of various broad spectrum antibiotics...
Determination of antibacterial activity of various broad spectrum antibiotics...
 
Unit 1 - introduction to environmental studies.pdf
Unit 1 - introduction to environmental studies.pdfUnit 1 - introduction to environmental studies.pdf
Unit 1 - introduction to environmental studies.pdf
 
Hot Sexy call girls in Nehru Place, 🔝 9953056974 🔝 escort Service
Hot Sexy call girls in Nehru Place, 🔝 9953056974 🔝 escort ServiceHot Sexy call girls in Nehru Place, 🔝 9953056974 🔝 escort Service
Hot Sexy call girls in Nehru Place, 🔝 9953056974 🔝 escort Service
 
Thessaly master plan- WWF presentation_18.04.24.pdf
Thessaly master plan- WWF presentation_18.04.24.pdfThessaly master plan- WWF presentation_18.04.24.pdf
Thessaly master plan- WWF presentation_18.04.24.pdf
 
Escort Service Call Girls In Shakti Nagar, 99530°56974 Delhi NCR
Escort Service Call Girls In Shakti Nagar, 99530°56974 Delhi NCREscort Service Call Girls In Shakti Nagar, 99530°56974 Delhi NCR
Escort Service Call Girls In Shakti Nagar, 99530°56974 Delhi NCR
 
原版1:1复刻塔夫斯大学毕业证Tufts毕业证留信学历认证
原版1:1复刻塔夫斯大学毕业证Tufts毕业证留信学历认证原版1:1复刻塔夫斯大学毕业证Tufts毕业证留信学历认证
原版1:1复刻塔夫斯大学毕业证Tufts毕业证留信学历认证
 
885MTAMount DMU University Bachelor's Diploma in Education
885MTAMount DMU University Bachelor's Diploma in Education885MTAMount DMU University Bachelor's Diploma in Education
885MTAMount DMU University Bachelor's Diploma in Education
 
Call Girls Ahmedabad 7397865700 Ridhima Hire Me Full Night
Call Girls Ahmedabad 7397865700 Ridhima Hire Me Full NightCall Girls Ahmedabad 7397865700 Ridhima Hire Me Full Night
Call Girls Ahmedabad 7397865700 Ridhima Hire Me Full Night
 

Development of an Integrated Urban Heat Island Simulation Tool

  • 1. Annals of Ecology and Environmental Science Volume 1, Issue 1, 2017, PP 27-45 Annals of Ecology and Environmental Science V1 ● I1 ● 2017 27 Development of an Integrated Urban Heat Island Simulation Tool Ming Xu Future Cities Laboratory, Singapore-ETH Centre, ETH Zurich *Corresponding Author: Ming Xu, Future Cities Laboratory, Singapore-ETH Centre, ETH Zurich INTRODUCTION Urban heat island (UHI) effect is described as the phenomenon that the air temperature in urban area is consistently higher than its rural area (Oke, 1973). While many causes of the urban heat island such as reduced evaporation, increased heat storage, increased net radiation, reduced convection and increased anthropogenic heat have been identified as in Gartland (2008), the contribution of each component strongly depends on the individual city and its geography. In a high-density mixed-used tropical city like Singapore, the urban microclimate varies from location to location and time to time. From previous research, we have a broad understanding of the magnitude of the urban heat island effect in Singapore, and of its main causes. A study of air temperatures conducted in Wong and Chen (2006) between2001-2004 showed that the UHI intensity in Singapore was about 4.5° C. Another study from Chow and Roth (2006) found that the peak UHI magnitude occurs approximately six hours after sunset at central business districts, high-rise residential estate, and low-rise residential area. Higher UHI intensities generally occur during the southwest monsoon period of May–August, with a maximum of ~7° C observed at Orchard Road at approximately 21:00 local time (Chow and Roth, 2006).More detailed information about the influence of albedo on the UHI in Singapore has been obtained from satellite or aerial images (Mackey et al., 2012). Wong and Chen (2006) concluded that hotspots are normally observed in the urban context on exposed hard surfaces during the daytime, and suggested that these could be addressed through shading by greenery or artificial sun-shading devices. Several other ABSTRACT Urban heat island (UHI) effect is quite common in megacities due to the built-up area and reduced greenery coverage of land surface, which highly affect urban livability. An integrated urban heat island simulation tool is developed by accounting for major heat sources and heat sinks in selected area of interest, and their interactions with the surrounding environment. Validation of simulated solar radiation and air temperature is conducted at Kent Vale buildings and Punggol Waterway Terrace I, with correlation coefficient (𝑟) of 0.98 and 0.90, and mean absolute error (MAE(%)) of 4% and 13%, respectively. The validation results confirm the performance of the simulation tool. As an implementation example of the developed integrated urban heat island simulation tool, effects of air conditioners, traffic, grasslands and water bodies on urban thermal environment are investigated by comparing results from two different scenarios, namely the base scenario where all regions are set as concrete and the real situation scenario where each region is set as its own property. It is found that (1) the simulation tool is able to simulate the stack effects induced by split- type air conditioners accurately; (2) the air temperature above Clementi Road is more than 2C higher than surrounding air throughout the daytime except during the early morning and can affect air even at 8m above the ground; (3) grasslands can cool down much larger area than their upright surface with capability of around 2C decided by the size of grassland through intrusion into the hotter regions from gaps between three high-rise buildings and the verandah; (4) the air temperature at the water surface of the swimming pool is found to be around 1.5 C cooler than the surrounding air and can go up to 1m above the water surface with temperature of around 0.5C lower than the surrounding air. Keywords: Urban heat island effect, Integrated simulation tool, Effects of air conditioners, Effects of traffic, Effects of grasslands, Effects of water bodies; .
  • 2. Development of An Integrated Urban Heat Island Simulation Tool 28 Annals of Ecology and Environmental Science V1 ● I1 ● 2017 studies have investigated the urban microclimate in Singapore relating to the urban heat island effect (Chow et al., 2014; Shaffer et al., 2014; Roth and Chow, 2012; Jusuf et al., 2007; Chow and Roth, 2006; Li et al., 2013). Research exists on several counter-measures, such as rooftop gardens and albedo (Sproul et al., 2014; Gao et al., 2014; Chen and Wong, 2006; Li and Norford, 2016). Recent challenges in modeling of urban heat island are reviewed in Mirzaei (2015) by addressing problems in building-scale models, micro-scale models and city-scale models. It is concluded that microclimate and building models cannot cover the entire city due to the complex parameters and extensive computational cost. Despite the capability of mesoscale models in investigation of the large- scale UHI effect, their accuracy is not sufficient to provide detailed information of the urban canopy layer. This gap requires further research to develop computationally and spatially efficient models. Urban heat island is a typical multi-physics multi-scale problem, which calls for integrated evaluation of the complex interactions between each key component in the system. As pointed out in Xu (2016), it is necessary to quantify the respective effects of major heat sources and sinks which contribute to urban heat island effect in Singapore. Xu (2016) concludes that solar radiation is the predominant heat source in Singapore, whose effects and interactions with buildings and surrounding air is investigated in Xu et al. (2017). Other heat sources contribute to urban heat island effect is mainly induced by anthropogenic activities Quah and Roth (2012), such as industrial activities, building energy consumption and traffic system. Major heat sinks in the urban context are grasslands, trees and water bodies. To account for the combined effects of different heat sources and sinks with various physics background, model coupling is a widely adopted and well proven numerical technique. For instance, to simulate the combined effects of building energy consumption and the surrounding environment, coupled building energy consumption and environment models are implemented in Allegrini et al. (2015) and Allegrini and Carmeliet (2017) by coupling the Computational Fluid Dynamic (CFD) model with radiation model. To simulate cooling effects from heat sinks through evaporation such as water bodies, coupled CFD and radiation models are also widely used (Saneinejad et al., 2012; Tominaga et al., 2015). Cooling effects of greenery including grasslands and trees could be modeled as porous media with the coupled CFD and radiation model by adding source terms to the governing equations, as adopted in Saneinejad et al. (2012). Various modeling tools and systems are developed across the world to manage and evaluate the impacts of different urban elements and urban designs on urban heat island effect in city-scale and outdoor thermal comfort in neighborhood-scale and street- scale. Assessment of tools developed in Japan for urban climate is conducted in Ooka (2007) by classifying them according to corresponding modeling scales. It is shown that these assessment tools are quite powerful in estimating countermeasures of urban heat island effect and could be implemented as design tools for practical applications. An operational modeling system for urban heat island effect is developed and implemented to Athens, Greece, as reported in Giannaros et al. (2014). The modeling system is built on the basis of a state- of-art numerical weather prediction model which is properly modified to allow for better representation of the urban climate. While few modeling tools account for the integration of major heat sources including solar radiation, industrial activities, building energy consumption and traffic system, and major heat sinks including grasslands, trees and water bodies are developed. The main objective of this study is to develop an integrated urban heat island simulation tool by accounting for major heat sources and heat sinks in selected area of interest, and their interactions with the surrounding environment. This paper is structured as follows: Section 2 presents methodology applied in this study, Section 3 shows the validation process of the developed integrated simulation tool, Section 4 illustrates the results and related discussions, Section 5 draws conclusions of this study. METHODS Three universal conservation laws of mass, momentum and energy are taken into account by solving continuity equation (Equation (1)), Navier-Stokers equation (Equation (2)) and energy balance equation (Equation (3)). The flow field and the transport phenomena developed in the
  • 3. Development of An Integrated Urban Heat Island Simulation Tool Annals of Ecology and Environmental Science V1 ● I1 ● 2017 29 computational domain are described by the Reynolds Averaged Navier-Stokes (RANS) equations. The continuity, momentum and energy conservation equations are solved in a 3D (x, y, z) domain, as well as the equations correspond to the turbulence model. Conjugate heat transfer is simulated by solving heat convection (Equation (4)), conduction (Equation (5)) and radiation (Equation (6)) between fluid and solid regions. The turbulence effect in the developed flow and heat transfer is modeled through the standardk − ε model. ∂ρ ∂t + ∇ ∙ ρu = 0 (1) ∂ ρu ∂t + ∇ ∙ ρu⨂u + pI = μ∇2 u + ρg (2) ρCp ∂T ∂t + u ∙ ∇T = κ∇2 T + Q (3) q = h(Ta − T∞) (4) q = −k∇T (5) q = ϵσ(Ta 4 −Tb 4 ) (6) where ρ is density, t is time, u is flow velocity field, p is pressure, Iis the identity matrix, μ is turbulent eddy viscosity, g is the gravity acceleration rate, T is temperature, Cp is the specific heat, κ is the thermal conductivity, Q is the additional heat flux, h is the heat transfer coefficient, ϵ is the radiation factor and σ is the Stefan-Boltzmann constant, respectively. Solar radiation is simulated by accounting for the combined effects of the Sun primary hits, their reflective fluxes and diffusive sky radiative fluxes (Howell et al. 2010). The primary hit rays of solar radiation are calculated using a face shading algorithm. The reflected fluxes are considered diffusive and use a view factors method to deposit the energy on visible walls. The sky diffusive radiation for horizontal and vertical walls is calculated following the Fair Weather Conditions Method from the ASHRAE Handbook. Ray tracing technique of the solar load model is used to forecast the direct illumination energy source induced by incident solar radiation. By using the illumination parameters and the sun position vector, a beam is applied to any faces to carry out a face-by-face shading analysis to compute the heat flux on the boundary faces that results from the incident radiation and determine shadows on all interior walls and boundary faces. The resulting heat flux computed by the solar ray tracing algorithm will be coupled to the energy equation with a source term. The heat sources are assigned to adjacent cells such as solid cells, shell conduction cells, and fluid cells and added to computational cells which are bordering each face. A two-band spectral model which accounts for different material properties in the infrared and visible bands is used for direct solar illumination. Diffuse radiation is calculated by a hemispherical-averaged single- band spectral model. Opaque materials are characterized by two-band absorptive. The shading calculation used for solar ray tracing is a straightforward vector geometry calculation. A ray is traced from the face centroid in the sun direction. Every other face is checked to determine if the candidate face is in front of the target face and if the ray intersects the target face. An opaque face completely shades the test face if both requirements are met. A solar calculator is designed to compute solar beam directions and irradiation for a given time, date and position consists of latitude and longitude. These values can be used as inputs to the solar ray tracing algorithms. The equation for normal direct irradiation applying the Fair Weather Conditions Method is taken from the ASHRAE Handbook: Edn = A e B sin β (7) where A and B are apparent solar radiation at air mass m = 0 and atmospheric extinction coefficient, respectively. These values ofA and Bare based on the earth's surface on a clear day. β is the solar altitude (in degrees) above the horizon. This algorithm is also similar to the solar calculator adopted in ANSYS FLUENT. The greeneries including grasslands and trees are considered as heat sinks and porous materials that cause pressure drop. In the momentum conservation equations two source terms are added, which correspond to the thermal buoyancy and the pressure drop inside the porous media, as presented in Fidaros et al. (2017). Six extra terms are added in the energy equation, which are a source term corresponding to thermal radiation calculated by the solar load model, three more source terms corresponding to the heat produced by buildings, traffic system and industrial activities and two sink terms that correspond to the air temperature reduction due to evapotranspiration and evaporation of greenery and water bodies, respectively. Other
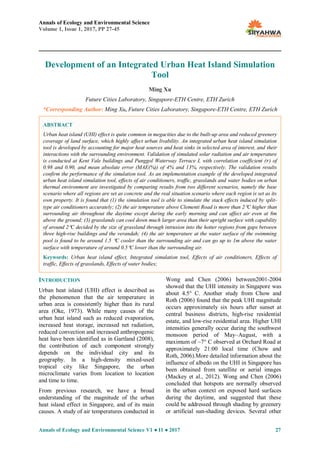
  • 4. Development of An Integrated Urban Heat Island Simulation Tool 30 Annals of Ecology and Environmental Science V1 ● I1 ● 2017 model set up follows strictly the suggestions made in Xu (2017). Open FOAM (www.openfoam.com) is implemented in this study as the core model, which is a free and open source Computational Fluid Dynamics (CFD) software developed primarily by Open CFD Ltd since 2004 and distributed by Open CFD Ltd and the Open FOAM Foundation. The non-uniform thermal boundary condition was defined by considering the solar irradiance that enables to include the effect of shading and solar heating. Docker (www.docker.com) is employed to perform parallel computing on the 128-core High Performance Computer (HPC) in Future Cities Laboratory of Singapore-ETH Centre. Parallel computing together with the customized CFD program coupled with solar radiation model and other key components to simulate conjugate heat transfer ensured the high-performance of this tool in terms of both accuracy and efficiency. MODEL VALIDATION To validate the performance of the developed integrated urban heat island simulation tool, two rounds of simulations are carried out and compared against observed data after calibrating the key parameters of the tool. In the first round, Kent Vale buildings (Figure 1), which are the housing unit of faculty members of National University of Singapore, are chosen. The location of the Kent Vale buildings, which is the key input information of the earlier developed solar radiation model as one of the tool forcing, is (1.302N, 103.768E) in latitude and longitude, respectively. The model domain for Kent Vale Buildings is selected as 250m 250m 200m in x, y and z directions, respectively. With snappyHexMesh of Open FOAM, a high resolution of around 5cm is achieved for the smallest edges of buildings and the total number of cells is 1.27 million. Different regions are identified in Figure 1, including buildings, greeneries, road pavement and water bodies. Thermo physical and radiation properties of different materials involved in both models are set as tabulated in Table 1. Key parameters are molar weight of the substance (mol Weight) in kg/mol, specific heat capacity (Cp) in J/kgK, dynamic viscosity (mu) in Pas, Prandtl number (Pr), thermal conductivity (Kappa) in W/mK, density of the material (Density) in kg/m3 and emissivity, absorptive, transmissivity and reflectivity of different materials. Solar radiation is calculated with the coupled solar load model by setting the specific date of the typical day during each month and location of the Kent Vale buildings. The tool is forced by the real settings of initial air temperature and velocity of each split type air- conditioners on both sides of the Kent Vale buildings, as measured in Bruelisauer et al. (2014). Time series of heat flux due to traffic system from 6am to 8pm during daytime (Figure 2) is adopted after part of Figure 3 in Quah and Roth (2012), which is employed as the forcing of traffic heat flux in the simulation tool. The cooling effects of greeneries are simulated by regarding the porous media which represent grasslands as heat sinks by assuming the cooling power of the grasslands is 22.5 W/m2, as reported in Edwards et al. (2016) for evaporative cooling power of a typical rain tree in Singapore. A close cooling power of 20 W/m2is also set for the water bodies involved in the model domain, with reference values from Fidaros et al. (2017). The initial air temperature is set as 27C in the early morning at 6am as provided by the measured data from the nearest meteorological station of National Environmental Agency (NEA). Wind profile on each specific date is set according to the measured data at the meteorological station at National University of Singapore, which is around 500m from the center of the model domain, as one of the boundary conditions. Other boundary and initial conditions include turbulent dissipation rate , turbulent kinetic energy 𝑘, kinematic turbulence viscosity 𝜈𝑡 , pressure 𝑝, wall function parameter 𝛼 and incident radiation intensity 𝐺, which are calculated according to the real situations of the environment around Kent Vale buildings. Figure1. 3D geometriesof Kent Vale buildings with different regions identified.
  • 5. Development of An Integrated Urban Heat Island Simulation Tool Annals of Ecology and Environmental Science V1 ● I1 ● 2017 31 Table1. Thermo physical and radiation properties of different materials. Air Concrete Water molWeight (kg/mol) 28.97 200 18 Cp (J/kgK) 1004 750 4180 mu (Pas) 0.000018 - 0.001057 Pr 0.7130 - 6.5241 Kappa (W/mK) - 0.8 - Density (kg/m3 ) - 2240 1000 Emissivity - 0.7 0.1 Absorptivity - 0.7 0.1 Transmissivity - 0 0.4 Reflectivity - 0.3 0.5 Figure2. Time series of heat flux from traffic on Clementi Road. Regenerated after part of Figure 3 in Quah and Roth (2012). Simulated solar radiation and air temperature on a typical day of each month are validated against observed data provided by National University of Singapore Meteorological Station (Figures 3-4, Tables 2-3). Statistical evaluations are performed by calculating the correlation coefficient (r) and the mean absolute error in percentage (MAE (%)). 𝒓 = ∑(𝑿𝒎𝒐𝒅𝒆𝒍 − 𝑿𝒎𝒐𝒅𝒆𝒍)(𝑿𝒐𝒃𝒔 − 𝑿𝒐𝒃𝒔) ∑ 𝑿𝒎𝒐𝒅𝒆𝒍 − 𝑿𝒎𝒐𝒅𝒆𝒍 𝟐∑(𝑿𝒐𝒃𝒔 − 𝑿𝒐𝒃𝒔)𝟐 (8) 𝑴𝑨𝑬 (%) = ∑ (𝑿𝒎𝒐𝒅𝒆𝒍 − 𝑿𝒐𝒃𝒔) (𝒎𝒂𝒙 𝑿𝒐𝒃𝒔 − 𝒎𝒊𝒏(𝑿𝒐𝒃𝒔))𝑵 (9) where Xmodel and Xobs are simulated and observed quantity, respectively. Xmodel and Xobs are the mea values of simulated and observed quantities, respectively. N is the total number of quantities involved in the calculation. max Xobs and min(Xobs ) are the maximum and minimum observed data among all involved quantities in the calculation, respectively. The calculation of observed solar radiation in each month throughout the whole year around Kent Vale buildings can be found in Xu (2016). It is found that the simulated radiation (Figure 3) and air temperature (Figure 4) generally agree well with observations, with 𝑟 of 0.99, 0.98 and MAE (%) of 2%, 4%, respectively (Tables 2 and 3). This shows that the modeling developed integrated urban heat island simulation tool could capture most portion of solar radiation and air temperature. Much smaller solar radiation and lower air temperature in November and December are observed due to the heavy rainfall during the Northeast monsoon season. Heavy rainfall will diffuse more solar radiation, enhance evaporation of water on the group which low down the air temperature.
  • 6. Development of An Integrated Urban Heat Island Simulation Tool 32 Annals of Ecology and Environmental Science V1 ● I1 ● 2017 Figure3. Validated solar radiation on a typical day of each month against measured data.Legend: measured data (red line), simulated results (blue line). Figure4. Validated air temperature on a typical day of each month against measured data. Legend: measured data (red line), simulated results (blue line). Table2. Statistics of simulated solar radiation on a typical day of each month. Jan Feb Mar Apr May Jun Jul Aug Sep Oct Nov Dec r 0.99 0.99 0.99 0.99 0.99 0.99 0.99 0.99 0.99 0.99 0.99 0.99 MAE(%) 1.67 1.97 1.66 2.48 1.55 1.78 2.02 1.78 1.72 1.40 1.39 1.22 Table3. Statistics of simulated air temperature on a typical day of each month. Jan Feb Mar Apr May Jun Jul Aug Sep Oct Nov Dec r 0.98 0.99 0.98 0.98 0.98 0.98 0.98 0.98 0.97 0.98 0.99 0.98 MAE(%) 4.96 5.11 4.96 5.02 5.03 4.94 5.59 5.79 6.59 5.24 5.11 5.63 To further evaluate the performance of the developed simulation tool in simulating air temperature, Punggol Waterway Terrace I (Figure 5) is chosen as the second site to compare the simulated results with observed data measured by 49 sensors deployed on-site on 6 Feb 2017. The location of Punggol Waterway Terrace I is (1.408N, 103.900E) in latitude and longitude, respectively. Similar settings to the first case of Kent Vale buildings are made by identifying different regions including buildings and greeneries. As shown in Figures 6-11, the simulated time series of air temperature at 49 sensors generally match well with observed data, with slight overestimations at Sensors 17-22 especially during noon time. The discrepancies at Sensors 17-22 are mainly due to the underestimation of the cooling power of surrounding greeneries, which has a dynamic performance throughout the whole day
  • 7. Development of An Integrated Urban Heat Island Simulation Tool Annals of Ecology and Environmental Science V1 ● I1 ● 2017 33 especially the peak values during noon time. To improve the model accuracy in predicting air temperature at a complex situation as Sensors 17-22, detailed measurements of cooling power of surrounding trees and grasslands are needed, especially the dynamic performance throughout the whole day. A great sample study of such measurements is presented in Tan et al. (2017).According to Table 4, the correlation coefficient 𝑟 is consistently larger than 0.90 and the MAE(%) is around 13%, which indicates that the developed integrated urban heat island simulation tool could simulate quite accurate air temperature around real buildings with detailed information. Figure5. 3D geometries of Punggol Waterway Terrace I and the 49 deployed sensors. Figure6. Validated air temperature at Sensors 1-8 against measured data. Legend: measured data (red line), simulated results (blue line).
  • 8. Development of An Integrated Urban Heat Island Simulation Tool 34 Annals of Ecology and Environmental Science V1 ● I1 ● 2017 Figure7.Validated air temperature at Sensors 9-16 against measured data. Legend: measured data (red line), simulated results (blue line).
  • 9. Development of An Integrated Urban Heat Island Simulation Tool Annals of Ecology and Environmental Science V1 ● I1 ● 2017 35 Figure8.Validated air temperature at Sensors 17-24 against measured data. Legend: measured data (red line), simulated results (blue line).
  • 10. Development of An Integrated Urban Heat Island Simulation Tool 36 Annals of Ecology and Environmental Science V1 ● I1 ● 2017 Figure9. Validated air temperature at Sensors 25-32 against measured data. Legend: measured data (red line), simulated results (blue line).
  • 11. Development of An Integrated Urban Heat Island Simulation Tool Annals of Ecology and Environmental Science V1 ● I1 ● 2017 37 Figure10. Validated air temperature at Sensors 23-40 against measured data. Legend: measured data (red line), simulated results (blue line).
  • 12. Development of An Integrated Urban Heat Island Simulation Tool 38 Annals of Ecology and Environmental Science V1 ● I1 ● 2017 Figure11.Validated air temperature at Sensors 41-49 against measured data. Legend: measured data (red line), simulated results (blue line).
  • 13. Development of An Integrated Urban Heat Island Simulation Tool Annals of Ecology and Environmental Science V1 ● I1 ● 2017 39 Table4. Statistics of simulated air temperature at sensors 1-49. Sensor 1 Sensor 2 Sensor 3 Sensor 4 Sensor 5 Sensor 6 Sensor 7 r 0.96 0.94 0.93 0.91 0.89 0.87 0.89 MAE (%) 7.40 11.44 38.74 12.79 13.00 13.23 15.11 Sensor 8 Sensor 9 Sensor 10 Sensor 11 Sensor 12 Sensor 13 Sensor 14 r 0.91 0.91 0.90 0.93 0.90 0.93 0.92 MAE (%) 13.67 15.38 11.29 9.87 12.49 10.03 12.90 Sensor 15 Sensor 16 Sensor 17 Sensor 18 Sensor 19 Sensor 20 Sensor 21 r 0.91 0.90 0.90 0.92 0.91 0.93 0.90 MAE (%) 14.57 14.30 67.37 64.49 74.33 58.00 47.06 Sensor 22 Sensor 23 Sensor 24 Sensor 25 Sensor 26 Sensor 27 Sensor 28 r 0.90 0.72 0.89 0.90 0.90 0.93 0.91 MAE (%) 39.45 16.78 13.30 20.77 30.25 21.17 19.37 Sensor 29 Sensor 30 Sensor 31 Sensor 32 Sensor 33 Sensor 34 Sensor 35 r 0.92 0.93 0.82 0.88 0.76 0.91 0.88 MAE (%) 11.37 9.82 21.36 14.11 20.12 17.83 17.41 Sensor 36 Sensor 37 Sensor 38 Sensor 39 Sensor 40 Sensor 41 Sensor 42 r 0.90 0.93 0.91 0.96 0.92 0.93 0.86 MAE (%) 15.96 34.62 11.89 7.81 24.12 8.98 14.07 Sensor 43 Sensor 44 Sensor 45 Sensor 46 Sensor 47 Sensor 48 Sensor 49 r 0.92 0.91 0.90 0.94 0.95 0.95 0.95 MAE (%) 13.83 11.36 14.16 9.41 20.69 9.05 9.69 RESULTS AND DISCUSSION To quantify respective contributions from major heat sources and sinks to the urban thermal environment, impacts of air conditioners, traffic, grasslands and water bodies are discussed in this section as an implementation example of the developed simulation tool. Two scenarios of simulations are designed to achieve the goals, namely the base scenario where all regions are regarded as concrete and the real situation scenario where each region is set with the respective properties, such as buildings, road pavement, grasslands and water bodies as shown in Figure 1, respectively. Impacts of Air Conditioners In Singapore, the majority of installed air- conditioning systems on high rise residential buildings are split type air-conditioners, compact units rejecting heat from air- conditioning through a dry heat exchange. They affect and in turn exposed to the urban microclimate in their vicinity, with regard to capacity to provide cooling and the efficiency of their operation. Stack effect of split type air- conditioners on high rise buildings are induced by the buoyancy-driven airflow coming out from the condensing units with rejected heat. The increasingly hotter air accumulated at higher levels of the same building will reduce the energy efficiency by increasing the ambient air temperature, the heat sink for the air- conditioners. The effect was confirmed in field measurements on Block H of Kent Vale buildings in Bruelisauer et al. (2014). The model uses the measurements of its case study to verify the tool. The 24-storey Kent Vale Block H is chosen to study the stack effect of split type air- conditioners. The tool is forced by the real settings of initial air temperature and velocity of each split type air-conditioners on the north side of the Kent Vale Block H, as measured in Bruelisauer et al. (2014). The measurement of the stack effect was carried out on 23 November 2012. More details can be found in Bruelisauer (2014). Since the air-conditioners are located in the recessed area of Block H, horizontal wind is not considered in this simulation. The patterns of the simulated distributions of air temperature (Figure 12) match well the observed data in Bruelisauer et al. (2014). This indicates the tool is able to capture microclimatic effects induced by split type air-conditioners on high rise buildings, which ensures the capability in simulating impacts of building energy consumption as one of the heat sources in urban environment.
  • 14. Development of An Integrated Urban Heat Island Simulation Tool 40 Annals of Ecology and Environmental Science V1 ● I1 ● 2017 Figure12. Validated simulated against measured data. Left: Validated vertical air temperature profile, indicating stack effect. Right: Horizontal air temperature distribution as temperature difference to ambient air temperature against measured data (top right image from Bruelisauer (2014)). Impacts of Traffic Heat induced by traffic system in megacities is one of the major anthropogenic heat sources. Estimations of major anthropogenic heat flux includes building energy consumption, traffic system and human metabolism are made in Quah and Roth (2012). Time series of heat flux due to traffic system from 6am to 8pm during daytime (Figure 2) is adopted after part of Figure 3 in Quah and Roth (2012), which is employed as the forcing of traffic heat flux in the simulation tool. Effects of traffic on urban heat island effect, or more specifically on the air temperature distribution patterns are identified by comparing the results of the base scenario where all regions are concrete with the real situation where each region is defined with its individual properties. Air temperature distribution patterns at height of 0.5m above ground at 9am, 1pm and 5pm are shown in Figure 13. 9 am is chosen as the morning situation the heat flux induced by traffic on Clementi Road is around 8.6 W/m2. 1pm represents the peak hour of solar radiation as observed and indicated in Xu (2016), when the traffic induced heat flux is around 14 W/ m2. While 5pm stands for the afternoon situation and the corresponding heat flux on Clementi Road is set as 15 W/m2. Traffic induced heat flux starts to increase from 7am, peaks at around 1pm and remains until around 8pm before decreasing again. It is found that the air temperature above Clementi Road is more than 2C (up to 20 C) higher than surrounding air throughout the daytime except during the early morning. Before 9am when the traffic is not heavy, the air temperature above Clementi Road is almost as the same as other concrete regions. As shown in Figure 13, it is also noticed that the heating effects of Clementi Road reaches beyond its upright regions and also heats up other parts such as the region beside Block I through convection. Due to radiation effects of the hot road surface of Clementi Road, gradually decreased heating effects are observed around the Clementi Road, especially towards Grassland 4 area. The interesting air temperature distribution pattern around three high-rise buildings and the verandah is decided the interactions between building geometries, solar radiation and surrounding cool air, which will be investigated in another separate study.
  • 15. Development of An Integrated Urban Heat Island Simulation Tool Annals of Ecology and Environmental Science V1 ● I1 ● 2017 41 Figure13. Air temperature distribution pattern at height of 0.5m above ground at 9am (left), 1pm (middle) and 5pm (right) when all regions are concrete (upper) and with respective properties (lower), respectively. Impacts of Grasslands As illustrated in Figure 1, there are four grasslands in this model, namely Grasslands 1 and 2 at the ground level in between the three high-rise buildings and the verandah, Grassland 3 to the north of the verandah and Grassland 4 beside the Clementi Road located in the upper- left corner of the model domain. Cooling effects of grasslands are simulated by accounting for its evapotranspiration rate throughout the day with porous media technique of the region. Both temporal and spatial effects of these four grasslands can be identified with Figure 13. It is found that the cooling effects of grasslands are quite consistent throughout the whole day. The distribution pattern of cooler zone is decided by the interactions of the cool air around grasslands, surrounding buildings and hotter air. Grasslands 1 and 2 is found to be able to cool down much larger area than their upright surface through intrusion into the hotter regions from gaps between three high-rise buildings and the verandah. The cooling effects of Grasslands 1 and 2 can be roughly estimated as 2C, as read from Figure 6. Similar to Grasslands 1 and 2, Grasslands 3 is also found to cool down the surrounding environment by around 2C. Shading effects from the high-rise buildings could bring the air temperature by around 0.5C, as can be observed in Figure 13. The cooling effects of shading is most significant at noon, which is around 1pm of Singapore time, as can be seen in Figure 13. Deducting the cooling effects of shading from the combined cooling effects above Grasslands 1 and 2, their real contributions are around 1.5C. Due to the relatively smaller size, Grassland 4 is able to cool down the surrounding hot air by around 0.5 C, which is the smallest among all four grasslands. To quantify the cooling effects of grasslands along the vertical direction, air temperature distribution pattern at heights of 1m, 1.5m and 2m above ground at 1pm are plotted in Figure 14 for Scenarios 1 and 2, respectively. Combining with Figure 13, it is found that the cooling effects of grasslands can reach up to 2m above ground depends on their sizes. At the height of 2m above ground, Grasslands 1 and 2 can still cool down the surrounding hot air by more than 0.5C. Figure 14 also indicates the cooling effects of shading from high-rise buildings does not change much throughout the day, as the simulation is carried out on 23 November when sun rises from Southeast and
  • 16. Development of An Integrated Urban Heat Island Simulation Tool 42 Annals of Ecology and Environmental Science V1 ● I1 ● 2017 sets in Southwest. On this specific day, the open space between three high-rise buildings and the verandah is located in the shadow throughout the daytime. The relatively cooler zone in the middle of the open space between Blocks G, H and I is mainly induced by the shading of Bridge H. Although the cooler zone above Grasslands 3 and 4 could also go up to 2m above the ground, the cooling effects are much smaller than those of Grasslands 1 and 2, especially combining with the shadings from the three high-rise buildings. While Grassland 3 still can cool down the hot air by less than 0.5C, which is slighter stronger than that of Grassland 4. Figur14. Air temperature distribution pattern at heights of 1m (left), 1.5m (middle) and 2m (right) above ground at 1pm when all regions are concrete (upper) and with respective properties (lower), respectively. Impacts of Water Bodies Effects of water bodies on urban heat islands are identified by comparing air temperature distribution pattern above water surfaces with the situation that there is no water body. To simulate effects of water bodies on urban heat islands, evaporation rates of the water bodies in this model are set according to measured data. As illustrated in Figure 1, there are five water bodies in this model, namely Pools 1-4 located at the ground floor beside Grasslands 1 and 2, and the swimming pool at the top of the verandah. Due to relatively smaller sizes of the ground water feature pools, effects of water bodies on urban heat islands are mainly focused on the swimming pool. Since the swimming pool is at the top of the verandah, air temperature distribution pattern at heights of 7m, 7.5m and 8m at 1pm are plotted in Figure 15 for both scenarios. It is found that the air temperature at the water surface of the swimming pool is around 1.5 C cooler than the surrounding air, which is relatively smaller than the cooling capability of grasslands. The relatively cooler air can go up to 1m above the water surface with temperature of around 0.5C lower than the surrounding air. In addition, the cooled down region above the water surface does not expand much through radiation, which is slightly weaker than that of grasslands. The possible reasons for difference in cooling capabilities between grasslands and water bodies can be mainly attributed to the fundamental difference between evaporation and evapotranspiration. Evaporation of water from water bodies in urban area is mainly induced by the heating effects of solar radiation. Since small water bodies have relatively weaker total amount of water evaporated during daytime than huge water bodies such as lakes and reservoirs. When the water bodies in urban area are moving such as running rivers and active coastal seas, the cooling effects due to
  • 17. Development of An Integrated Urban Heat Island Simulation Tool Annals of Ecology and Environmental Science V1 ● I1 ● 2017 43 evaporation of water bodies will be much stronger than those of small water features such as swimming pools and landscape pools. While evapotranspiration of greenery includes grasslands and trees is the combined effect of both evaporation and transpiration. Due to photosynthesis activities of greenery when there is sufficient supply of sunlight, carbon dioxide, nitrogen and phosphorus, much cooler water vapor leaving the surfaces of leaves will enter the environment with initial momentum, which helps to magnify the cooling effects of greenery. Other than cooling effects of water bodies, it is recommended to name the effects of water bodies as balancing effects, which will avoid the surrounding environment from being neither too hot nor too cold, as the specific heat capacity of water is 4.2 times that of air. As shown in Figure 15, it is also found that the air temperature in the whole domain is slightly lower with the existence of grasslands and water bodies in the real situation than the base scenario where all regions are regarded as concrete. This combined cooling effect through interactions between major heat sources and sinks, and the surrounding air can be as high as around 1C at critical locations around the buildings even at the height of 8m above the ground. Judging from Figure 15, the heating effects of Clementi Road can still weakly affect air temperature at the height of 8m above the ground. Figure15. Air temperature distribution pattern at heights of 7m (left), 7.5m (middle) and 8m (right) above ground at 1pm when all regions are concrete (upper) and with respective properties (lower), respectively. CONCLUSIONS An integrated urban heat island simulation tool is developed by accounting for major heat sources and heat sinks in selected area of interest, and their interactions with the surrounding environment. By comparing simulated solar radiation and air temperature on a typical day of each month throughout the whole year with observed data at Kent Vale buildings, it is found that the simulation tool could perform well in simulating solar radiation and air temperature. A second validation case at Punggol Waterway Terrace I further ensures the capability of the developed integrated urban heat island simulation toolin predicting air temperature distribution pattern across the model domain. As an implementation example of the developed integrated urban heat island simulation tool, effects of traffic, grasslands and water bodies on urban heat islands are investigated in this study by comparing results from two different scenarios, following the simulation-aided design concept in Huang and Xu (2017). In Scenario 1, all regions are set as concrete, while in Scenario 2, each region is set as its own property. It is found that the air temperature above Clementi Road is more than 2C and can be up to 20 C
  • 18. Development of An Integrated Urban Heat Island Simulation Tool 44 Annals of Ecology and Environmental Science V1 ● I1 ● 2017 higher than surrounding air throughout the daytime except during the early morning. Before 9am when the traffic is not heavy, the air temperature above Clementi Road is almost as the same as other concrete regions. The heating up effects of Clementi Road also extends to surrounding area through radiation and can affect air temperature even at 8m above the ground. Cooling effects of grasslands are found to be quite consistent throughout the whole day. The distribution pattern of cooler zone is decided by the interactions of the cool air around grasslands, surrounding buildings and hotter air. Grasslands is found to be able to cool down much larger area than their upright surface through intrusion into the hotter regions from gaps between three high-rise buildings and the verandah. The cooling effects of Grasslands can be roughly estimated as 2C, with larger values for larger grasslands. It is also found that the cooling effects of grasslands can reach up to 2m above ground depends on their sizes. The air temperature at the water surface of the swimming pool is found to be around 1.5 C cooler than the surrounding air, which is relatively smaller than the cooling capability of grasslands. The relatively cooler air can go up to 1m above the water surface with temperature of around 0.5C lower than the surrounding air. In addition, the cooled down region above the water surface does not expand much through radiation, which is slightly weaker than that of grasslands. The possible reasons for difference in cooling capabilities between grasslands and water bodies can be mainly attributed to the fundamental difference between evaporation and evapotranspiration. It is recommended to name the effects of water bodies on urban heat islands as balancing effects, which will avoid the surrounding environment from being neither too hot nor too cold. By combing different urban heat islands mitigation strategies such as increase the greenery coverage with densely located grasslands and trees and have more suitable water bodies, better cooling effects can be achieved to improve the thermal environment in megacities. While such a combination of different mitigation strategies of urban heat island effect could be well evaluated by the developed integrated urban heat island simulation tool, as illustrated with the implementation example. ACKNOWLEDGEMENT This work was financially supported by the Singapore National Research Foundation (NRF) under its Campus for Research Excellence And Technological Enterprise (CREATE) program. I would like to thank Dr. Marcel Bruelisauer for providing the measured air conditioner stack effects data on Kent Vale Block H, Richard Neil Belcher for providing measured air temperature data in Punggol Waterway Terrace I, Mayank Kaushal and Dr. Xusheng Huang for providing and editing the geometry file of Punggol Waterway Terrace, respectively. REFERENCES [1] Allegrini, J. and Carmeliet, J., 2017. Simulations of local heat islands in Zurich with coupled CFD and building energy models. Urban Climate, in press. http://dx.doi.org/10.1016/j.uclim.2017.02.003. [2] Allegrini, J., Dorer, V. and Carmeliet, J., 2015. Coupled CFD, radiation and building energy model for studying heat fluxes in an urban environment with generic building configurations. Sustainable Cities and Society, 19, 385-394. [3] Bruelisauer, M., 2014. LowEx heat rejection systems in the tropics: Beyond energy efficiency, towards integrated multi-scale cooling system. Doctoral Thesis No. 22273, ETH Zurich. [4] Bruelisauer, M., Meggers, F., Saber, E., Li, C. and Leibundgut, H., 2014. Stuck in a stack – Temperature measurement of the microclimate around split typecondensing units in a high rise building in Singapore. Energy and Buildings, 71, 28-37. [5] Chen, Y. and Wong, N.H., 2006. Thermal Benefits of City Parks. Energy and Buildings, 38(2), 105–120. [6] Chow, W.T.L. and Roth, M., 2006. Temporal Dynamics of the Urban Heat Island of Singapore. International Journal of Climatology, 26, 2243–2260. [7] Chow, W.T.L., Salamanca, F., Georgescu, M., Mahalov, A., Milne, J.M. and Ruddell, B.L., 2014. A Multi-Method and Multi-Scale Approach for Estimating City-Wide Anthropogenic Heat Fluxes. Atmospheric Environment, 99, 64–76. [8] Edwards, P.J., Hertig, T. and Sadlo, F., 2016. Proceedings of the 4th International Conference on Countermeasures to Urban Heat Island, Singapore. [9] Fidaros, D., Baxevanou, C., Tsangrassoulis, A., Bartzanas, T. and Kittas, C., 2017. Bioclimatic Reformation of urban area – a CFD study. Procedia Environmental Science, 38, 586-594. [10] Gao, Y., Xu, J., Yang, S., Tang, X., Zhou, Q., Ge, J., Xu, T. and Levinson, R., 2014. Cool Roofs in China: Policy Review, Building
  • 19. Development of An Integrated Urban Heat Island Simulation Tool Annals of Ecology and Environmental Science V1 ● I1 ● 2017 45 Simulations, and Proof-of-Concept Experiments. Energy Policy, 74, 190–214. [11] Gertland, L., 2008. Heat Islands: Understanding and Mitigating Heat in Urban Area. London: Earthscan. [12] Giannaros, T.M., Melas, D., Daglis, I.A. and Keramitsoglou, I., 2014. Development of an operational modelling system for urban heat islands: an application to Athens, Greece. Natural Hazards and Earth System Sciences, 14, 347-358. [13] Howell, J.R., Siegel, R. and Menguc, M.P., (2010). Thermal Radiation Heat Transfer. Fifth Edition. CRC Press. [14] Huang, X. and Xu, M., 2017. Simulation Aided Design: Using “CFD simulation – design loop” for Better Thermal Environment. GSTF Journal of Engineering Technology, 4(3), 8pp. [15] Jusuf, S.K., Wong, N.H., Hagen, E., Anggoro, R. and Hong, Y., 2007. The Influence of Land Use on the Urban Heat Island in Singapore. Habitat International, 31(2), 232–242. [16] Li, X-X. and Norford, L.K., 2016. Evaluation of cool roof and vegetations in mitigating urban heat island in a tropical city, Singapore. Urban Climate, 16, 59-74. [17] Li, X-X., Koh, T.Y., Entekhabi, D., Roth, M., Panda, J. and Norford, L.K., 2013. A Multi- Resolution Ensemble Study of a Tropical Urban Environment and Its Interactions with the Background Regional Atmosphere. Journal of Geophysical Research – Atmospheres, 118(17), 9804–9818. [18] Mackey, C.W., Lee, X. and Smith, R.B., 2012. Remotely sensing the cooling effects of city scale efforts to reduce urban heat island. Building and Environment, 49, 348-358. [19] Mirzaei, P.A., 2015. Recent challenges in modelling of urban heat island. Sustainable Cities and Society, 19, 200-206. [20] Oke, T.R., 1973. City size and the urban heat island. Atmospheric Environment, 7(8), 769- 779. [21] Ooka, R., 2007. Recent development of assessment tools for urban climate and heat- island investigation especially based on experiences in Japan. International Journal of Climatology, 27, 1919-1930. [22] Quah, A.K.L. and Roth, M., 2012. Diurnal and weekly variation of anthropogenic heat emissions in a tropical city, Singapore. Atmospheric Environment, 46, 92-103. [23] Roth, M, and Chow, W., 2012. A Historical Review and Assessment of Urban Heat Island Research in Singapore. Singapore Journal of Tropical Geography, 33, 381–397. [24] Saneinejad, S., Moonen, P., Defraeye, T., Derome, D. and Carmeliet, J., 2012. Coupled CFD, radiation and porous media transport model for evaluating evaporative cooling in an urban environment. Journal of Wind Engineering and Industrial Aerodynamics, 104- 106, 455-463. [25] Shaffer, S.R., Chow, W.T.L., Georgescu, M., Hyde, P., Jenerette, G.D., Mahalov, A., Moustaoui, M. and Ruddell, B.L., 2014. Multiscale Modeling and Evaluation of Urban Surface Energy Balance in the Phoenix Metropolitan Area. Journal of Applied Meteorology and Climatology, 54(2), 322–338. [26] Sproul, J., Wan, M.P., Mandel, B.H. and Rosenfeld, A.H., 2014. Economic Comparison of White, Green, and Black Flat Roofs in the United States. Energy and Buildings, 71, 20– 27. [27] Tan, C.L., Tan, P.Y., Wong, N.H., Takasuna, H., Kudo, T., Takemasa, Y., Lim, C.V.J. and Chua, H.X.V., 2017. Energy and Buildings, in press, http://dx.doi.org/10.1016/j.enbuild.2017.01.011. [28] Tominaga Y., Sato, Y. and Sadohara, S., 2015. CFD simulations of the effect of evaporative cooling from water bodies in a micro-scale urban environment: validation and application studies. Sustainable Cities and Society, 19, 259- 270. [29] Wong, N.H. and Chen, Y., 2006. Exploring the Urban Heat Island Effect in Singapore. In Tropical Sustainable Architecture, ed. Bay Joo Hwa and Ong Boon Lay, 10-1-10-23. London: Architectural Press, 23 pp. [30] Xu, M., 2016. Towards a cooler Singapore. Global Journal of Science Frontier Research, 16(3), 32-35. [31] Xu, M., Brülisauer, M. and Berger, M., 2017. Development of a new urban heat island modelling tool: Kent Vale case study. Procedia Computer Science, 108, 225-234. [32] Xu, M., 2017. Impacts of Building Geometries and Radiation Properties on Urban Thermal Environment. Procedia Computer Science, 108, 2517-2521.