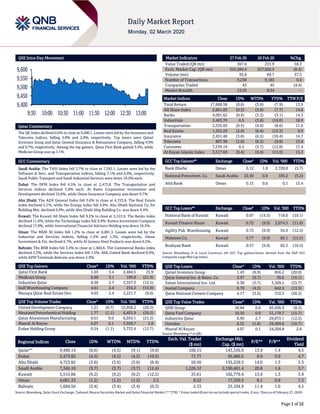
QSE INTRA-DAY MOVEMENT
•
0 likes•24 views

The QE Index declined 0.6% to close at 9,490.1. Losses were led by the Insurance and Telecoms indices, falling 3.8% and 2.0%, respectively.

Recommended
Recommended
More Related Content
What's hot
What's hot (20)
Similar to QSE INTRA-DAY MOVEMENT
Similar to QSE INTRA-DAY MOVEMENT (20)
More from QNB Group
More from QNB Group (20)
Recently uploaded
Recently uploaded (20)
QSE INTRA-DAY MOVEMENT
- 1. Page 1 of 12 QSE Intra-Day Movement Qatar Commentary The QE Index declined 0.6% to close at 9,490.1. Losses were led by the Insurance and Telecoms indices, falling 3.8% and 2.0%, respectively. Top losers were Qatari Investors Group and Qatar General Insurance & Reinsurance Company, falling 9.9% and 9.7%, respectively. Among the top gainers, Qatar First Bank gained 3.4%, while Medicare Group was up 3.1%. GCC Commentary Saudi Arabia: The TASI Index fell 3.7% to close at 7,345.1. Losses were led by the Software & Serv. and Transportation indices, falling 7.1% and 6.0%, respectively. Saudi Public Transport and Saudi Industrial Services were down 10.0% each. Dubai: The DFM Index fell 4.5% to close at 2,473.8. The Transportation and Services indices declined 5.8% each. Al Ramz Corporation Investment and Development declined 10.0%, while Oman Insurance Company was down 9.7%. Abu Dhabi: The ADX General Index fell 3.6% to close at 4,723.8. The Real Estate index declined 5.1%, while the Energy index fell 4.9%. Abu Dhabi National Co. for Building Mat. declined 9.9%, while Abu Dhabi Ship Building Co. was down 9.4%. Kuwait: The Kuwait All Share Index fell 9.2% to close at 5,515.9. The Banks index declined 11.0%, while the Technology index fell 9.9%. Kamco Investment Company declined 17.8%, while International Financial Advisers Holding was down 16.5%. Oman: The MSM 30 Index fell 1.2% to close at 4,081.3. Losses were led by the Industrial and Services indices, falling 1.5% and 1.3%, respectively. Oman Investment & Fin. declined 6.7%, while Al Jazeera Steel Products was down 6.5%. Bahrain: The BHB Index fell 3.4% to close at 1,604.6. The Commercial Banks index declined 5.3%, while the Services index fell 1.5%. Ahli United Bank declined 8.9%, while APM Terminals Bahrain was down 5.9%. QSE Top Gainers Close* 1D% Vol. ‘000 YTD% Qatar First Bank 1.03 3.4 2,484.5 25.9 Medicare Group 6.60 3.1 199.8 (21.9) Industries Qatar 8.99 2.7 3,357.3 (12.5) Gulf Warehousing Company 4.61 2.4 254.2 (15.9) Mazaya Qatar Real Estate Dev. 0.65 2.4 2,221.7 (9.6) QSE Top Volume Trades Close* 1D% Vol. ‘000 YTD% United Development Company 1.21 (0.7) 12,958.2 (20.5) Mesaieed Petrochemical Holding 1.77 (1.1) 6,401.9 (29.5) Qatar Aluminium Manufacturing 0.61 0.0 6,034.1 (21.5) Masraf Al Rayan 4.07 0.1 5,958.7 2.8 Ezdan Holding Group 0.54 (1.1) 5,733.4 (12.7) Market Indicators 27 Feb 20 26 Feb 20 %Chg. Value Traded (QR mn) 367.0 231.9 58.3 Exch. Market Cap. (QR mn) 525,584.4 527,626.3 (0.4) Volume (mn) 95.8 69.7 37.5 Number of Transactions 9,238 9,183 0.6 Companies Traded 43 45 (4.4) Market Breadth 13:25 8:34 – Market Indices Close 1D% WTD% YTD% TTM P/E Total Return 17,669.58 (0.6) (3.8) (7.9) 13.9 All Share Index 2,861.83 (0.5) (3.8) (7.7) 14.6 Banks 4,091.62 (0.4) (3.3) (3.1) 14.3 Industrials 2,463.70 0.5 (3.8) (16.0) 18.0 Transportation 2,335.03 (0.5) (4.0) (8.6) 11.9 Real Estate 1,325.29 (2.0) (6.4) (15.3) 9.9 Insurance 2,451.40 (3.8) (6.5) (10.4) 14.7 Telecoms 807.38 (2.0) (6.2) (9.8) 13.9 Consumer 7,539.19 0.2 (3.7) (12.8) 17.4 Al Rayan Islamic Index 3,517.69 (0.4) (4.4) (11.0) 15.2 GCC Top Gainers## Exchange Close# 1D% Vol. ‘000 YTD% Bank Dhofar Oman 0.12 1.8 2,720.0 (5.7) National Petrochem. Co. Saudi Arabia 22.50 0.9 185.2 (5.2) Ahli Bank Oman 0.15 0.0 0.1 15.4 GCC Top Losers## Exchange Close# 1D% Vol. ‘000 YTD% National Bank of Kuwait Kuwait 0.87 (14.5) 718.0 (19.1) Kuwait Finance House Kuwait 0.72 (9.9) 2,074.3 (11.8) Agility Pub. Warehousing Kuwait 0.72 (9.9) 54.9 (12.5) Mabanee Co. Kuwait 0.77 (9.9) 85.1 (15.5) Boubyan Bank Kuwait 0.57 (9.9) 82.2 (10.5) Source: Bloomberg (# in Local Currency) (## GCC Top gainers/losers derived from the S&P GCC Composite Large Mid Cap Index) QSE Top Losers Close* 1D% Vol. ‘000 YTD% Qatari Investors Group 1.43 (9.9) 856.2 (20.0) Qatar General Ins. & Reins. Co. 2.07 (9.7) 36.6 (16.1) Salam International Inv. Ltd. 0.38 (5.7) 3,369.2 (25.7) Aamal Company 0.70 (4.5) 642.9 (13.5) Qatar National Cement Company 4.17 (3.6) 310.5 (26.3) QSE Top Value Trades Close* 1D% Val. ‘000 YTD% QNB Group 18.84 0.6 83,436.9 (8.5) Qatar Fuel Company 19.30 0.0 31,170.7 (15.7) Industries Qatar 8.99 2.7 29,873.1 (12.5) Ooredoo 6.32 (1.8) 29,499.6 (10.7) Masraf Al Rayan 4.07 0.1 24,204.8 2.8 Source: Bloomberg (* in QR) Regional Indices Close 1D% WTD% MTD% YTD% Exch. Val. Traded ($ mn) Exchange Mkt. Cap. ($ mn) P/E** P/B** Dividend Yield Qatar*# 9,490.14 (0.6) (4.5) (9.1) (9.0) 100.15 143,326.9 13.9 1.4 4.5 Dubai 2,473.82 (4.5) (4.5) (4.5) (10.5) 71.77 95,886.5 8.9 0.9 4.7 Abu Dhabi 4,723.82 (3.6) (3.6) (3.6) (6.9) 50.50 135,229.3 14.0 1.3 5.3 Saudi Arabia 7,345.10 (3.7) (3.7) (3.7) (12.4) 1,226.12 2,190,401.4 20.8 1.6 3.7 Kuwait 5,515.86 (9.2) (9.2) (9.2) (12.2) 33.61 102,779.4 13.9 1.3 3.9 Oman 4,081.33 (1.2) (1.2) (1.2) 2.5 8.52 17,330.5 8.1 0.8 7.3 Bahrain 1,604.56 (3.4) (3.4) (3.4) (0.3) 2.33 25,104.9 11.4 1.0 4.5 Source: Bloomberg, Qatar Stock Exchange, Tadawul, Muscat Securities Market and Dubai Financial Market (** TTM; * Value traded ($ mn) do not include special trades, if any, #Data as of February 27, 2020) 9,400 9,450 9,500 9,550 9,600 9:30 10:00 10:30 11:00 11:30 12:00 12:30 13:00
- 2. Page 2 of 12 Qatar Market Commentary The QE Index declined 0.6% to close at 9,490.1. The Insurance and Telecoms indices led the losses. The index fell on the back of selling pressure from GCC and non-Qatari shareholders despite buying support from Qatari shareholders. Qatari Investors Group and Qatar General Insurance & Reinsurance Company were the top losers, falling 9.9% and 9.7%, respectively. Among the top gainers, Qatar First Bank gained 3.4%, while Medicare Group was up 3.1%. Volume of shares traded on Thursday rose by 37.5% to 95.8mn from 69.7mn on Wednesday. Further, as compared to the 30-day moving average of 83.9mn, volume for the day was 14.3% higher. United Development Company and Mesaieed Petrochemical Holding Company were the most active stocks, contributing 13.5% and 6.7% to the total volume, respectively. Source: Qatar Stock Exchange (* as a % of traded value) Earnings Releases, Global Economic Data and Earnings Calendar Earnings Releases Company Market Currency Revenue (mn) 4Q2019 % Change YoY Operating Profit (mn) 4Q2019 % Change YoY Net Profit (mn) 4Q2019 % Change YoY Saudi Ground Services Co.* Saudi Arabia SR 2,539.8 -0.6% 416.0 12.1% 423.4 14.9% Methanol Chemicals Co.* Saudi Arabia SR 527.2 -24.9% (40.6) N/A (84.1) N/A Alandalus Property Co.* Saudi Arabia SR 176.1 6.9% 104.2 12.6% 64.8 35.1% Tabuk Cement Co.* Saudi Arabia SR 238.7 59.7% 27.3 N/A 24.2 N/A Batic Inv. And Logistics Co.* Saudi Arabia SR 463.9 -8.6% 16.2 -40.0% 6.9 -51.4% Saudi Industrial Services Co.* Saudi Arabia SR 675.9 19.7% 93.4 6.0% 50.9 9.0% Saudi Paper Manufacturing Co. Saudi Arabia SR 128.4 -14.1% (5.0) N/A (11.3) N/A Dallah Healthcare Co.* Saudi Arabia SR 1,252.1 6.0% 154.4 5.6% 146.9 3.6% Taiba Investments Co.* Saudi Arabia SR 387.5 -4.6% 173.8 5.0% 171.9 167.1% Zahrat Al Waha for Trading Co.* Saudi Arabia SR 519.8 6.4% 73.4 38.5% 56.6 63.4% United Wire Factories Co.* Saudi Arabia SR 724.4 35.4% 32.9 93.5% 22.1 211.3% Bupa Arabia For Coop. Insurance* Saudi Arabia SR 10,410.9 21.5% – – 97.7 16.7% RAK Co. for White Cement & Construction Materials* Abu Dhabi AED 236.5 3.7% 25.3 21.5% 19.4 49.3% Bahrain Flour Mills Company* Bahrain BHD 7.1 -0.3% 0.3 47.6% 1.9 54.8% Source: Company data, DFM, ADX, MSM, TASI, BHB. (*Financial for FY2019) Global Economic Data Date Market Source Indicator Period Actual Consensus Previous 02/27 US Bureau of Economic Analysis GDP Annualized QoQ 4Q2019 2.1% 2.1% 2.1% 02/27 US Bureau of Economic Analysis GDP Price Index 4Q2019 1.3% 1.4% 1.4% 02/27 US Department of Labor Initial Jobless Claims 22-Feb 219k 212k 211k 02/27 US Department of Labor Continuing Claims 15-Feb 1,724k 1,711k 1,733k 02/28 UK GfK NOP (UK) GfK Consumer Confidence Feb -7 -8 -9 02/27 EU European Central Bank M3 Money Supply YoY Jan 5.2% 5.3% 4.9% 02/27 EU European Commission Services Confidence Feb 11.2 11 11 02/27 EU European Commission Consumer Confidence Feb -6.6 – -6.6 02/28 Germany German Federal Statistical Office CPI MoM Feb 0.4% 0.3% -0.6% 02/28 Germany German Federal Statistical Office CPI YoY Feb 1.7% 1.7% 1.7% 02/28 France INSEE National Statistics Office CPI MoM Feb 0.0% 0.0% -0.4% 02/28 France INSEE National Statistics Office CPI YoY Feb 1.4% 1.5% 1.5% 02/28 France INSEE National Statistics Office PPI MoM Jan -0.1% – 0.1% 02/28 France INSEE National Statistics Office PPI YoY Jan 0.2% – 0.6% 02/28 France INSEE National Statistics Office Consumer Spending MoM Jan -1.1% 0.0% -0.3% 02/28 France INSEE National Statistics Office Consumer Spending YoY Jan -0.9% 0.3% 2.1% 02/28 France INSEE National Statistics Office GDP QoQ 4Q2019 -0.1% -0.1% -0.1% 02/28 France INSEE National Statistics Office GDP YoY 4Q2019 0.9% 0.8% 0.8% Overall Activity Buy %* Sell %* Net (QR) Qatari Individuals 20.12% 12.30% 28,720,941.50 Qatari Institutions 21.74% 11.90% 36,102,672.39 Qatari 41.86% 24.20% 64,823,613.88 GCC Individuals 0.98% 2.70% (6,313,044.33) GCC Institutions 1.31% 4.99% (13,529,639.73) GCC 2.29% 7.69% (19,842,684.06) Non-Qatari Individuals 7.03% 5.31% 6,304,589.88 Non-Qatari Institutions 48.82% 62.80% (51,285,519.71) Non-Qatari 55.85% 68.11% (44,980,929.83)
- 3. Page 3 of 12 Global Economic Data Date Market Source Indicator Period Actual Consensus Previous 02/28 Japan Ministry of Internal Affairs and Communications Tokyo CPI YoY Feb 0.4% 0.5% 0.6% 02/28 Japan Ministry of Economy Trade and Industry Industrial Production MoM Jan 0.8% 0.2% 1.2% 02/28 Japan Ministry of Economy Trade and Industry Industrial Production YoY Jan -2.5% -3.1% -3.1% 02/29 China China Federation of Logistics and Purchasing Composite PMI Feb 28.9 – 53 02/29 China China Federation of Logistics Manufacturing PMI Feb 35.7 45 50 02/29 China China Federation of Logistics Non-manufacturing PMI Feb 29.6 50.5 54.1 02/28 India Central Statistics Office India GDP YoY 4Q2019 4.7% 4.7% 5.1% 02/28 India Central Statistics Office India GVA YoY 4Q2019 4.5% 4.4% 4.8% Source: Bloomberg (s.a. = seasonally adjusted; n.s.a. = non-seasonally adjusted; w.d.a. = working day adjusted) Earnings Calendar Tickers Company Name Date of reporting 4Q2019 results No. of days remaining Status DBIS Dlala Brokerage & Investment Holding Company 3-Mar-20 1 Due AKHI Al Khaleej Takaful Insurance Company 3-Mar-20 1 Due QGRI Qatar General Insurance & Reinsurance Company 4-Mar-20 2 Due QFBQ Qatar First Bank 4-Mar-20 2 Due QOIS Qatar Oman Investment Company 8-Mar-20 6 Due ZHCD Zad Holding Company 11-Mar-20 9 Due BRES Barwa Real Estate Company 11-Mar-20 9 Due QGMD Qatari German Company for Medical Devices 11-Mar-20 9 Due Source: QSE News Qatar WDAM posts 47.8% YoY decrease but 6% QoQ increase in net profit in 4Q2019, below our estimate – Widam Food Company's (WDAM) net profit declined 47.8% YoY (but rose 6.0% on QoQ basis) to QR15.0mn in 4Q2019, below our estimate of QR28.6mn (variation of -47.5%). The miss was due to the company recording QR6.3mn of “Other Impairments” under losses from discontinued operations within 4Q2019 vs. none in 3Q2019. After the company recorded QR13.8mn as of 1H2019 for the discontinued Al Rkya farm losses, followed by none in 3Q2019, we were not expecting the company to record additional losses from discontinued operations in 4Q2019. The company's revenues came in at QR125.7mn in 4Q2019, which represents an increase of 9.0% YoY (+6.9% QoQ). In FY2019, WDAM posted net profit of QR78.39mn compared to net profit amounting to QR108.39mn for the same period of the previous year. EPS amounted to QR0.44 in FY2019 as compared to QR0.60 in FY2018. The boards of directors propose distribution of a cash dividend of 30% of the nominal share value i.e., QR0.30 per share. (QNB FS Research, QSE, Company Press Release) MCCS' bottom line declines 34.5% YoY in 4Q2019 – Mannai Corporation (MCCS) reported net profit of QR121.6mn in 4Q2019 as compared to net profit of QR185.8mn (-34.5% YoY) in 4Q2018 and net loss of QR6.5mn in 3Q2019.The company's revenue came in at QR3,066.6mn in 4Q2019, which represents a decrease of 0.7% YoY. However, on QoQ basis revenue rose 8.6%. In FY2019, MCCS recorded net profit of QR202.6mn compared to net profit amounting to QR407.1mn for the same period of the previous year. EPS amounted to QR0.44 in FY2019 as compared to QR0.89 in FY2018. Reviewing and approving the board of directors’ proposal for a cash dividend payment of QR0.2 per share, being 20% of the nominal share value. In FY2019, MCCS reported 7.6% increase in revenue to reach QR11.6bn over QR10.8bn in the previous year, driven by solid growth in its Information and Communications Technology (ICT) businesses. ICT revenue crossed QR9bn, which accounts for 79% of the total revenue in the current period, MCCS stated in a statement. The group’s profit before interest, tax, depreciation and amortization expenses (EBITDA) for FY2019 increased to QR1.1bn compared to QR1bn last year, an increase of 7.5%. “Despite strong performance by the ICT business, the net profit was depressed due to the increase in finance costs; subdued general market conditions in the retail and luxury segment impacted the performance of its jewelry business. During the period, finance costs increased by QR87mn to QR405mn, an increase of 27% over last year, mainly as a result of higher borrowings relating to increased investment and acquisitions in the Information Technology segment,” MCCS stated. (QSE, Company Press Release, Gulf-Times.com) Qatar central bank’s January foreign reserves rises to QR199.1bn – Qatar Central Bank has published Qatar’s foreign reserves and data on monetary aggregates for January 2020, which showed that international reserves and foreign currency liquidity rose to QR199.1bn in January 2020 from QR198.4bn in December 2019. M1 money supply increased 5.1% from January 2019 and 3.7% from December 2019. Qatar’s M2 Money supply rose 5.2% YoY and 2.4% MoM in January 2020. (Bloomberg) QIGD to hold its EGM on March 17 – Qatari Investors Group’s (QIGD) board of directors has invited the shareholders to attend the Extraordinary General Assembly meeting (EGM) will be held on March 17, 2020. In case the quorum is not met, the second meeting will be held on March 31, 2020. The agenda includes to discuss the proposal of the board of directors to
- 4. Page 4 of 12 amend the company's Articles of Association in accordance with the Commercial Companies Law No. 11 of 2015 and the decisions of the Qatar Financial Markets Authority, in particular the corporate governance code and legal entities listed in the main market issued by the board of directors of Qatar Financial Markets Authority No. 5 of 2016. (QSE) ORDS announces the appointment of new Ooredoo Algeria Deputy General Manager – Ooredoo (ORDS) announced the appointment of Bassam Yousef Al Ibrahim as Ooredoo Algeria’s Deputy General Manager, as of March 01, 2020. Bassam Yousef Al Ibrahim has over 20 years of experience in the telecoms industry. Bassam was holding the position of Deputy Chief Procurement Officer – Strategic Sourcing at Ooredoo Group. He has held a range of senior positions within Ooredoo, having joined in 2013 in the IT software department, and has significant experience at senior management level across the telecommunications sector. (QSE) IQCD projects total capital expenditure of QR4.6bn for 2020-24 – Industries Qatar (IQCD) - the holding entity of Qatar Petrochemicals Company (QAPCO), Qatar Fertiliser Company (QAFCO) and Qatar Steel - has projected QR4.6bn total capital expenditure (capex) for 2020-24 with as much as 48% of it going for the fertilizer segment. According to the company’s business plan, IQCD is expected to see total capital capex of QR1.3bn each in 2020 and next year, after which it will be at QR0.7bn in 2022, QR0.6bn in 2023 and QR0.7bn in 2024. The group had reported net profit of QR2.6bn on revenues of QR13.7bn in 2019 and recommended 40% cash dividend. Asia remained the group’s largest market in 2019, while its presence in Americas and Indian sub-continent continued to be substantial. Among its subsidiaries, QAFCO is slated to see a routine capex of QR2.2bn in various projects including maintenance turnaround. The fertilizer segment had reported net profit of QR873mn on revenues of QR4.4bn in 2019. Asia remains a main market for the fertilizer segment and the Indian sub-continent is another key market for fertilizers along with North and South America. QAPCO will see turnaround/reliability-related capex of QR0.7bn and another QR0.5bn of routine capex primarily related to HSE (health safety and environment). Its petrochemical business has seen net profit of QR1.3bn on revenues of QR4.4bn in 2019. Asia remains a main market for IQCD for polyethylene (low density and linear low density) and methyl tert-butyl ether; while the Indian subcontinent remains a key market for polyethylene (LDPE and LLDPE) as well as methanol. Its fuel additive business QAFAC, which is under the petrochemicals segment, is expected to see total capex of QR0.5bn, largely related to planned turnaround (in 2022 and 2023), and HSE. Qatar Steel is slated to see routine capex of QR0.6bn related to maintenance replacement, turnaround and other minor projects. The steel unit had reported net profit of QR36mn on revenues of QR5.1bn in 2019. Asia remains a key market for steel products, while Qatar remains another key market for IQCD’s steel products. Minister of State for Energy Affairs, Chairman of the board of directors and Managing Director at IQCD, HE Saad Sherida Al Kaabi said the company has improved its overall supply chain and marketing activities in the past year. The Minister noted that IQCD continued to focus on ensuring safe, efficient, and reliable operations with consistent production levels, supported by significant efforts on output and cost optimization. Partnering with the Qatar Chemical and Petrochemical Marketing and Distribution Company (Muntajat) enabled the group to access global markets, while reducing costs. The group has also been investing heavily in its health, safety, and environmental (HSE) programs as it aspires to be an HSE role model in the region (Gulf-Times.com, Peninsula Qatar) UDCD, Corinthia Hotels sign deal to manage, operate Corinthia Doha in Gewan Island – United Development Company (UDCD) signed an agreement with Corinthia Hotels to manage and operate Corinthia Doha, which will be located in UDCD’s newest flagship real estate development – Gewan Island. Under the agreement, Corinthia Hotels, a limited company incorporated under the laws of Malta, will manage and operate the first Corinthia Hotel in Doha which will be constructed by UDCD. Corinthia Hotels currently operates a group of luxury hotels in major cities including London, Lisbon, Prague, Budapest, Malta, Tripoli, Al Khartoum, St Petersburg, Rome, Brussels, Moscow, Dubai and Bucharest among several others in Europe, Africa and the Middle East. Corinthia Doha is therefore poised to be a prominent structure in Gewan Island, overlooking the island’s planned golf course and beach club. Corinthia Doha will be established on an area of 13,000 square meters and will comprise 110 guestrooms, a banquet hall and outdoor patio with a 1000 people capacity, an all-day dining and specialty restaurants in addition to a luxurious spa facility. (Gulf-Times.com) Vodafone Qatar connects Barwa Labour City with GigaNet – Vodafone Qatar has connected the Barwa Labour City with its state-of-the-art GigaNet fiber network that will give thousands of workers access to fixed services, including high-speed Internet, in addition to powering many of the commercial entities located there. The development, designed and developed by Barwa Real Estate Group, comes as part of the efforts to improve the housing standards of workers in Qatar and meet the needs of the local market in line with the objectives of Qatar National Vision 2030 and Qatar’s preparations for hosting the 2022 FIFA World Cup. Businesses will also benefit from the wide range of services available with GigaNet Fibre, including access to Vodafone GigaBusiness plans, offering unlimited data with speeds up to 1Gbps, high- speed corporate Internet, security services and fixed voice solutions. (Gulf-Times.com) PSA: Qatar posts QR12.51bn trade surplus in January – Qatar's trade surplus amounted to QR12.51bn in January 2020 with Asia accounting for about 72% of the country's exports, according to the Planning and Statistics Authority (PSA). The surplus, however, fell 12.4% and 20.7% YoY and MoM respectively, a PSA report stated. In absolute terms, Japan, China, South Korea, India and Singapore were among the largest export markets of Qatar; while imports mainly came from China, the US, Germany, the UK and India during the period under review. In January 2020, total exports of goods (including exports of goods of domestic origin and re-exports) amounted to QR22.38bn, which registered 5% and 9% declines on yearly and monthly basis respectively. Although the exports of petroleum gases and other gaseous hydrocarbons grew 1.5% YoY to QR15.15bn; those of crude fell 23% to QR3.15bn, non-
- 5. Page 5 of 12 crude by 13.7% to QR1.18bn and other commodities by 13.3% to QR2.06bn at the end of January 2020. On a monthly basis, the exports of petroleum gases and other gaseous hydrocarbons shrank 6.8%, crude by 15.7%, non-crude by 26.1% and other commodities by 12.3%. Petroleum gases constituted 70.33% of the exports of domestic products compared to 67.81% a year ago period, crude 14.62% (15.63%), non-crude 5.48% (6.64%) and other commodities 9.56% (9.82%). The country's re-exports amounted to QR0.85bn in January 2020, which showed surges of 5.3% and 26.2% on a yearly and monthly basis respectively. Qatar's total imports (valued at cost insurance and freight) amounted to QR9.88bn, which showed 6.4% and 11.9% jump YoY and MoM respectively in January 2020. (Gulf-Times.com) QCB: Qatari commercial banks' assets growth tops 12% in January – Robust credit off-take largely helped commercial banks in Qatar to report a strong more than 12% YoY jump in their total assets at the end of January 2020, according to the Qatar Central Bank (QCB) data. The banks' total assets stood at QR1.56tn in the review period with domestic assets constituting more than 85% of the total. Domestic assets witnessed about 14% YoY surge to QR1.33tn at the end of January 31, 2020 on robust growth trajectory especially in the case of credit, securities portfolio and claims on banks. Total credit of the commercial banks grew about 12% to QR1.06tn. Their domestic credit facilities shot up about 14% YoY to QR986.14bn at the end of review period. They constituted more than 74% of the total domestic assets of the banks. Private sector credit registered more than 18% YoY expansion to QR698.72bn, or 66% of the total credit at the end of January this year and public sector credit was up a marginal 1% to QR348bn in the review period. However, the credit facilities under non- banking financial institutions witnessed more than 5% YoY decline to QR14.25bn during the review period. The securities portfolio, which accounted for 12% of domestic assets, registered more than 11% YoY increase to QR194.77bn, of which debt witnessed about 9% growth to QR115.99bn and Sukuk by about 16% to QR74.22bn. The total debt growth was mainly on account of QR101.44bn domestic debt, of which those issued by the government was at QR92.51bn. The banks’ debt instruments amounted to QR5.31bn and others QR3.61bn at the end of January 31, 2020. Of the QR74.22bn Sukuk, about 97% or QR71.65bn, came through the domestic route with sovereign issue at QR68.06bn, banks QR2.82bn and others at QR0.77bn during the review period. The commercial banks' claims on banks amounted to QR148.77bn, which showed about a 24% YoY growth at the end of January this year. (Gulf- Times.com) Ezdan: West Bay, Al Sadd account for 40% demand for open plan offices and units – Nearly 40% demand for open plan offices and units have come from West Bay and Al Sadd, according to new report by Ezdan Real State (Ezdan). Greater demand is due to improved services for open plan office and administrative areas offered for tenancies in premium locations, the report stated. For companies, this provides incentives to improve their businesses. A case in point is Lusail City, Ezdan stated, and noted 95% of its infrastructure has already been completed. Lusail City extends over an area of 38 square kilometers, which can accommodate nearly 200,000 residents and an additional manpower of 170,000. It includes many establishments, housing units and offices including 22 hotels. According to Ezdan, the city currently ranks third in terms of demand for administrative offices thanks to its high- quality buildings and rentals at competitive prices. In terms of real estate activities in Qatar from February 16 to 20, Ezdan stated some 82 property deals have been executed during the period, which was valued at more than QR255.2mn. The Ezdan report is based on data provided by the Real Estate Registration Department. The deals covered seven municipalities: Umm Salal, Al Khor, Al Thakhira, Doha, Al Rayyan, Al Shamal, Al Daayen and Al Wakrah, and pertained to vacant land lots, housing, multi-use buildings, multi-use land lots, and residential buildings. (Gulf-Times.com) Al-Kaabi: Plan to raise LNG output progressing well – HE the Minister of State for Energy Affairs Saad bin Sherida Al-Kaabi confirmed that the pace of work in implementing the project to increase Qatar's production of liquefied gas from 77mn tons per year (tpy) to 126mn tpy by 2027 is going well, denying media reports that there has been a delay in the project for several months. Regarding the effects of the Coronavirus 2019 (COVID- 19) on LNG shipments for Qatar Petroleum customers and its subsidiaries, the minister clarified, in statements on the sidelines of the General Assembly of Industries Qatar Company, that the coronavirus is a global issue and what happens in the delivery of gas shipments globally occurs with Qatar Petroleum as well. HE Al-Kaabi also stressed that Qatar Petroleum cooperates with its customers in a manner that provides them with their needs and provides them with support in all forms, which is something that Qatar always does. (Gulf-Times.com) Qatar-US trade volume expands to record QR30bn in 2019 – The Qatar-US bilateral trade volume reached at all time high in 2019 breaching the previous peak level recorded in 2014. The total value of goods exchanged between the two countries during the year jumped to nearly QR30bn ($8.15bn), registering a double- digit growth of 36% YoY compared to QR21.84bn ($5.99bn) in 2018, latest official data showed. The trade was skewed in favor of the US, which is one of Qatar’s largest trade partners and import destinations. The US trade surplus against Qatar in 2019 reached at QR17.34bn ($4.76bn), which is also the all time high, registering a sharp jump of 67% compared to compared to QR10.4bn ($2.85bn) for the corresponding period previous year (2018). According to the latest data published by the US Census Bureau on its website, the total value of US exports of goods to Qatar in 2019 stood at QR23.52bn ($6.46bn) - all time high-, while its imports from Qatar reached at QR6.15bn ($1.69bn) (second highest ever), and slightly higher compared to $1.57bn in 2018. (Peninsula Qatar) QFZA signs MoU with IBPC to boost Indian firms – Qatar Free Zone Authority (QFZA) recently signed a Memorandum of Understanding (MoU) with the Indian Business and Professionals Council (IBPC Qatar) aiming to support trade and investment opportunities for Indian companies and businesses looking to establish operations in Qatar Free Zones. QFZA offers unique incentives and benefits which allow Indian companies to serve new markets in the region and internationally, across various key sectors such as logistics, manufacturing, and the chemicals industry. (Qatar Tribune) International
- 6. Page 6 of 12 US cooling consumer spending, inflation put spotlight on Fed amid coronavirus – The US consumer spending slowed in January and could lose further momentum as the fast-spreading coronavirus outbreak, which has sparked a stock market sell-off and revived fears of a recession, causes households to tighten their purse strings. Other data on Friday showed the goods trade deficit contracted sharply last month as both imports and exports declined. While the narrowing goods trade deficit could be a boost to the calculation of gross domestic product, a lot depends on how the coronavirus unfolds in the US. The Commerce Department stated consumer spending, which accounts for more than two-thirds of US economic activity, increased 0.2% last month as unseasonably mild weather reduced demand for heating and undercut sales at clothing stores. Consumer spending shot up 0.4% in December. Economists polled by Reuters had forecasted consumer spending gaining 0.3% in January. While a separate report on Friday from the University of Michigan showed its consumer sentiment index increased to a near two-year high in February, it noted that a fifth of respondents mentioned the coronavirus in the final days of the survey in part because of the plunge in stock prices. Still, consumer fundamentals remain healthy. Personal income jumped 0.6% in January, the most since February 2019, after gaining 0.1% in December. Income was boosted by the annual cost of living adjustment for social security recipients and other government welfare programs. Wages rose 0.5% in January after gaining 0.1% in the prior month. Savings raced to $1.33tn last month, the highest since March 2019, from $1.26tn in December. Consumer prices as measured by the personal consumption expenditures (PCE) price index edged up 0.1% in January. The PCE price index was held back by a 0.7% drop in the cost of energy goods and services, offsetting a 0.3% gain in food prices. The PCE price index increased 0.3% in December. In the 12 months through January, the PCE price index accelerated 1.7%. That was the biggest gain since December 2018 and reflected the drop of 2019’s low readings from the calculation. The PCE price index advanced 1.5% YoY in December. When adjusted for inflation, consumer spending nudged up 0.1% in January after a similar gain in the prior month. That suggests consumer spending got off to a slow start in the first quarter after cooling considerably in the final three months of 2019. Consumer spending increased at a 1.7% annualized rate in the fourth quarter, stepping back from the July-September quarter’s brisk 3.2% pace. The economy grew at a 2.1% rate in the fourth quarter, matching the third quarter’s pace. (Reuters) US economy grows steadily in fourth-quarter, but coronavirus looms large – The US economy grew moderately in the fourth quarter, the government confirmed, and is facing a bumpy road in early 2020 amid the fast-spreading coronavirus that has left financial markets fearing a recession. Though other data on Thursday suggested some stabilizing in business investment in January and the labor market remained solid, which failed to calm jittery investors. Wall Street’s main indexes dropped for the sixth straight session and slid into correction territory. The yield on the 10-year US Treasury note touched an all-time low for the third consecutive day. GDP increased at a 2.1% annualized rate, supported by a smaller import bill, the Commerce Department said in its second estimate of fourth- quarter GDP. That was unrevised from last month’s advance estimate and matched the growth pace logged in the July- September quarter. The economy grew by an unrevised 2.3% in 2019, the slowest annual growth in three years and missing the White House’s 3% growth target for a second straight year. Excluding trade, inventories and government spending, the economy grew at a 1.3% rate in the fourth quarter, the slowest in four years. This measure of domestic demand was previously reported to have risen at a 1.4% pace in the fourth quarter. Business investment fell at a steeper 2.3% rate in the fourth quarter, instead of the previously reported 1.5% pace. It was the third straight quarterly decline and the longest such stretch since 2009. There were downward revisions last quarter to spending on equipment, mostly light trucks. Growth in consumer spending, which accounts for more than two-thirds of US economic activity, slowed to a 1.7% pace in the fourth quarter, instead of the previously reported 1.8% rate. A separate report on Thursday showed applications for unemployment benefits increased 8,000 to 219,000 last week, though the underlying trend remained consistent with solid labor market conditions. (Reuters) Britain, on trade collision course with EU, says it could walk away – Britain unveiled a negotiating mandate on Thursday for talks with the European Union that puts it on a collision course with Brussels, saying it was ready to walk away if good progress was not made by June. Britain unveiled a negotiating mandate on Thursday for talks with the European Union that puts it on a collision course with Brussels, saying it was ready to walk away if good progress was not made by June. After leaving the EU last month, Britain has until the end of the year to negotiate a trade deal and agreements on everything from fishing to transport, to replace more than 40 years of closely aligned political and economic relations. Having accepted that British businesses will encounter new frictions in trade with the bloc outside its single market and customs union, the government has made its stance clear - self-determination must trump economic concerns. So if, by June, good progress has not been made on Britain’s demand for what it calls a standard free trade agreement or even on the least controversial areas of the talks, London said it would focus on preparations for a sharp break with the EU. (Reuters) Eurozone’s inflation expectations tumble to record low – A key market gauge of long-term Eurozone’s inflation expectations fell to a record low on Friday as concerns about the spread of coronavirus intensified. The five-year, five-year forward fell to 1.1182%, its lowest level ever. It measures expected euro zone inflation over a five-year period. Countries on three continents reported their first cases of the coronavirus on Friday and the world prepared for a pandemic, triggering worries around an already weak global growth outlook. Inflation expectations have breached a previous record low in October at around 1.12%, according to Refinitiv data. (Reuters) German inflation edges towards ECB target in February – German annual inflation accelerated in February to within touching distance of the European Central Bank’s (ECB) target, data showed on Friday, but the coronavirus epidemic means the firming price pressures pose no threat to the ECB’s stimulus policy. German consumer prices, harmonized to make them
- 7. Page 7 of 12 comparable with inflation data from other European Union countries, rose by 1.7% YoY after posting a 1.6% increase in the previous month, the Federal Statistics Office stated. Despite the acceleration, inflation remained just below the ECB’s target level of close to but below 2%. The reading was above a Reuters forecast for 1.6%. Labor Office data released earlier on Friday showed German unemployment dropped unexpectedly in February, suggesting that the strong job market will continue to support growth in Europe’s largest economy. The number of people out of work fell by 10,000 to 2.262mn in seasonally adjusted terms. That confounded a Reuters consensus forecast for a rise of 3,000. The unemployment rate was steady at 5.0%. (Reuters) French consumer pulls back even before coronavirus outbreak – French consumer spending fell unexpectedly sharply in January, official data showed on Friday, flagging a weak start to the year even before the coronavirus outbreak began taking its toll. The INSEE official stats agency stated consumer spending, the traditional motor of the Eurozone’s second-biggest economy, fell 1.1% in January from December. The drop crushed the average forecast for an increase of 0.1% in a Reuters poll of 14 economists in which none had expected anything lower than -0.6%. INSEE blamed much of the decrease on a sharp drop in sales of new cars as a government scheme to increase the price of more polluting vehicles took effect in January. As a result, the sale of transportation goods plunged 7.1% from December when it had increased 2.4% before the scheme took effect. While the January weakness was concentrated in car sales, the economy increasingly faces a broader challenge from the coronavirus outbreak, which the government estimates could shave 0.1 percentage points from its 2020 growth forecast of 1.3%. (Reuters) Japan fourth-quarter capex down, virus outbreak dims outlook – Japanese companies slashed spending on plant and equipment in the December quarter, bolstering recession fears as the coronavirus outbreak and global slowdown pile pressure on the export-reliant economy. Capital spending fell 3.5% in the last quarter from the same period a year earlier, Ministry of Finance (MoF) data showed, posting the first decline in 13 quarters and reversing from the prior quarter’s 7.1% gain. On a seasonally adjusted basis, business expenditure declined 4.2% QoQ in the October-December period, the data showed. The data will be used to calculate revised GDP figures due March 9, and follows a preliminary estimate that Japan’s economy shrank an annualized 6.3% in the last quarter. The gloomy GDP data was followed by a separate indicator that showed a 2.1% drop in core machinery orders - a volatile data series serving as a leading indicator of capital spending - in the last quarter. Manufacturers anticipate a further 5.2% drop in the January- March period. Manufacturers’ business spending fell 9.0% from a year earlier, according to survey, conducted among firms with at least 10mn Yen ($92,533) in capital. It followed a 6.4% gain in the previous quarter. Service-sector spending fell 0.1% YoY, following the third quarter’s 7.6% increase. Corporate recurring profit decreased 4.6% in the October-December quarter from a year earlier, falling for the third consecutive quarter. Sales dropped 6.4% YoY in October-December, down for the second straight quarter and slowing further from the previous period’s 2.6% decline. (Reuters) Japan's factory activity shrinks at fastest pace since 2016 on coronavirus hit – Japan’s factory activity was hit by its sharpest contraction in nearly four years in February, raising a red flag over manufacturing in the world’s third-largest economy as the impact from the coronavirus outbreak spreads. The manufacturing slowdown offers the clearest evidence yet of the epidemic’s damaging effects on global growth and businesses and is likely to ramp up pressure on Japanese policymakers to boost growth. The au Jibun Bank Japan Manufacturing Purchasing Managers’ Index (PMI) slipped to a seasonally- adjusted 47.8 from a final 48.8 in the previous month. The February reading was its lowest since May 2016. The index stayed below the 50.0 threshold that separates contraction from expansion for a 10th month, marking the longest stretch since a 16-month run to June 2009 during the global financial crisis. (Reuters) China's central bank to ensure ample liquidity through targeted RRR cuts – China’s central bank stated on Thursday that it will ensure ample liquidity through targeted reserve requirement ratio (RRR) cuts for banks at an appropriate time, and will keep monetary policy prudent and flexible to support the economy. China has announced a flurry of steps in recent weeks to shore up investor confidence and help keep smaller businesses afloat as the coronavirus epidemic severely disrupts economic activity. The central bank stated it was releasing another 500bn Yuan ($71.30bn) to banks to extend cheap loans to small and medium-sized enterprises, on top of 300bn Yuan announced earlier this month for loans to companies that make health supplies such as masks and protective suits. The central bank will increase the re-lending and re-discount quota again if needed, and help the country’s smaller banks to replenish capital if they need more funds, Liu said, replying to questions about increasing borrowing needs. Data from China’s Industry and Information Technology Ministry showed only about 30% of China’s small and medium enterprises have resumed normal production, and officials are worried that many may have to start cutting jobs, putting additional pressure on the economy. Small and mid-size firms account for over 80% of nationwide employment and over 60% of GDP. China’s banking sector may face a surge of up to 7.7tn Yuan ($1.1tn) of non-performing loans (NPLs) in 2020 if the virus outbreak doesn’t peak until April, credit agency S&P Global estimated last week. (Reuters) China’s February factory activity contracts at record pace as coronavirus bites – Factory activity in China contracted at the fastest pace ever in February, even worse than during the global financial crisis, highlighting the colossal damage from the coronavirus outbreak on the world’s second-largest economy. China’s official Purchasing Managers’ Index (PMI) fell to a record low of 35.7 in February from 50.0 in January, the National Bureau of Statistics stated on Saturday, well below the 50-point mark that separates monthly growth from contraction. Analysts polled by Reuters expected the February PMI to come in at 46.0. The data foreshadows that the economic disruption from the virus will likely extend to the whole first quarter of 2020 since the disease outbreak has caused widespread transport curbs and required tough public health measures that have paralyzed economic activity. A sub- index of manufacturing production nosedived to 27.8 in February from January’s 51.3 while a reading of new orders
- 8. Page 8 of 12 plunged to 29.3, down from 51.4 a month earlier. New export orders received by Chinese manufacturers also declined at the fastest pace in years, with the NBS warning of mounting pressure on exporters from delayed shipments and cancelled orders. Labor conditions remained tight amid travel restrictions with a sub-reading for employment falling to 31.8 from 47.5. (Reuters) China's service sector activity contracts at record pace in Feb – China’s services sector activity also shrank at a record pace in February, official data showed on Saturday. The official non- manufacturing PMI fell to 29.6, from 54.1 in January, the National Bureau of Statistics stated. The 50-point mark separates growth from contraction on a monthly basis. Beijing has been counting on a strong services sector to help offset prolonged weakness in manufacturing, which has been weighed by weak domestic and global demand and the protracted US-China trade war. The official January composite PMI, which includes both manufacturing and services activity, fell to 28.9 from January’s 53.0. (Reuters) China factory activity dives to worst on record as coronavirus paralyses economy – China’s factories were dealt a devastating blow in February as the coronavirus epidemic triggered the sharpest contraction in activity on record, a private survey showed, with the health crisis paralyzing large parts of the economy. The Caixin/Markit Manufacturing Purchasing Managers’ Index (PMI) tumbled to 40.3 last month, the lowest level since the survey began in 2004, and down sharply from the 51.1 reading in January as well as the 50-mark that separates growth from contraction. The headline number was well off a Reuters poll forecast at 45.7 and even worse than the depths of the financial crisis in 2008-09, underlining the crippling effects of the virus across the country where authorities have imposed tough travel curbs and public health measures to contain the outbreak. The findings, which focus mostly on small and export-oriented businesses, were backed by an equally grim official survey released on Saturday, which showed the steepest contraction on record. (Reuters) India's economy grows slowly in Dec quarter, with virus impact to come – India’s economy expanded by 4.7% in the December quarter compared with the same period a year earlier, the slowest pace in more than six years, and analysts see the global impact of the coronavirus further stifling growth in Asia’s third- largest economy. The GDP data released on Friday showed consumer demand, private investment and exports all struggling, while higher government spending and an improvement in rural demand lent support. The read-out for the final quarter of 2019 matched the forecast of analysts in a Reuters poll, but was below a revised - and greatly increased - 5.1% growth rate for the previous quarter. (Reuters) Regional OPEC leaning towards larger oil cuts as virus hits prices, demand – Several key OPEC members are leaning towards a bigger than previously expected oil output cut, sources said, as oil prices fell to $50 per barrel on fears the coronavirus outbreak will hit oil demand badly. Saudi Arabia, the biggest producer in OPEC, and some other members are considering agreeing an output cut of 1mn bpd for the second quarter of 2020, more than an initially proposed cut of 600,000 bpd, the sources said. The Financial Times newspaper was first to report the deeper cut idea. The virus has caused almost 2,800 deaths in China and has spread to dozens of other countries. Oil LOCc1 has slid by almost 25% this year on lower demand and slower expected economic growth, alarming OPEC members. The OPEC and its allies including Russia, a grouping known as OPEC+, have already been curbing oil output by 1.7mn bpd under a deal that runs to the end of March. They are scheduled to meet on March 5-6 in Vienna to decide further policy. In an initial response to counter the impact of the virus on the oil market, an OPEC+ committee this month recommended the group deepen its output cuts by 600,000 bpd, a figure now seen as not enough by some in the group. Two other OPEC sources said the need for additional action was clearer than when the OPEC+ committee recommendation was made. “The situation has deteriorated,” an industry source said. “There is a lot of concern.” Saudi Arabia is already making unilateral curbs of more 500,000 bpd in crude supplies to China for March, sources said. The OPEC+ panel that recommended the 600,000 bpd cut, called the Joint Technical Committee, is scheduled to convene again on March 3, sources said, to revise the recommendation in the light of more recent oil market data. (Reuters) OPEC could deepen oil supply cuts with or without Russia – OPEC could agree on deeper oil supply cuts this week, with or without Russia’s support, to halt the slide in crude prices triggered by the global spread of the coronavirus, sources said. Moscow is resisting further output curbs, arguing that reduced production by the Saudi Arabia-led OPEC and its allies, a group known as OPEC+, will not necessarily revive oil demand, the sources said. Russian President, Vladimir Putin said that current prices are acceptable for his country’s budget and that Russia - a key member of OPEC+ - has sufficient resources to contend with any deterioration in the global economy. “Saudi Arabia wants to hold prices from falling, but Russia is still not agreeing. So the only way might be for OPEC to cut alone, which will not send a good signal to the market. There should be a cut, there is no other option,” adding that another option might be for OPEC to delay a decision until low oil prices force Moscow to come on board, sources said. (Reuters) Moderate GCC debt issuance in 4Q2019 wraps up a strong year – GCC debt issuance was moderate in 4Q2019 relative to previous quarters, standing at around $11bn, including $3.9bn in Sukuk, compared to circa $30bn in 3Q2019. Issuances have moderated possibly due to refinancing needs being already completed during the year. Issuances in 4Q2019 were dominated by sovereigns and quasi-sovereigns. NBK in its ‘economic update’ noted that though 4Q2019 posted a modest issuance, in comparison to prior quarters, the gross issuance throughout 2019 was solid reaching $102bn, and total outstanding debt (domestic and international) rose to $517bn at the end of 2019 from close to $457bn. Issuance may have eased in 4Q2019 on the back of a lower need to refinance after the exceptionally strong run earlier in the year, driven in part by a large volume of maturities: around $43bn in GCC bonds and Sukuk matured in 2019. With generally expansionary budgets and low borrowing costs, issuance has regained traction so far this year. More than $11bn had been issued as of mid February, one of the most notable of which was a $3bn issuance by QNB Group in Qatar, NBK analysts noted. (Peninsula Qatar)
- 9. Page 9 of 12 Saudi Arabia’s economy grows just 0.3% in 2019 as oil sector shrinks – Saudi Arabia’s economy grew by a weaker-than- expected 0.3% in 2019 as the oil sector contracted sharply, official data showed, although the non-oil sector accelerated. Saudi Arabia, the world’s biggest oil exporter, wants to boost the private sector and diversify its economy away from oil, but sliding oil prices and crude output cuts agreed with OPEC allies continue to weigh on its overall growth. Real economic growth in the non-oil sector increased by 3.3% last year, according to data from the General Authority for Statistics, the strongest growth since 2014. Overall GDP growth was below an official forecast of 0.9% and the oil sector shrank by 3.6%, marking Saudi Arabia’s economy’s worst performance since it contracted in 2017. Expansion of the non-oil sector was mainly driven by growth in the private sector, which amounted to 3.8%, said the statistics authority. “Non-oil activities continued to strengthen supported by high investment activity,” Chief Economist at Abu Dhabi Commercial Bank, Monica Malik said. In 2019, financial, insurance and business services, as well as retail trade and restaurants and hotels, were among the activities that saw the strongest growth - reflecting the government’s investment drive into areas such as tourism and entertainment. The energy and manufacturing sectors shrank. Saudi exports fell by 10.4% YoY, because of a 14% drop in oil exports, the data showed. (Reuters) SAMA: Saudi Arabia’s reserves up 2.4% in January – The Saudi Arabian Monetary Authority (SAMA) reported an increase in assets by 2.54% during January 2020, compared with the same months of last year to SR1.91tn. On a monthly basis, assets marginally increased compared to its level in December 2019 at SR1.9tn. Meanwhile, Saudi Arabia’s foreign reserves grew by 2.4% last month by SR44.55bn to SR1.88tn, compared with SR1.84tn in the same period in the year before. Reserves also increased by SR8.47bn compared with its level in December at SR1.87tn. Meanwhile, general reserves rose by 0.25% MoM to SR470.8bn, while the government’s current account surged by 45% MoM to SR86.66bn. On an annual basis, general reserves declined by 3%, while the current account went up by 55%. The M1 money supply roses 5.3% from a year ago, M2 money supply rose 7.3% from a year ago and the M3 money supply rose 6.6% from a year ago. (Zawya, Bloomberg) Saudi Arabia’s mortgage contracts hit new record level – The number of new mortgage contracts in Saudi Arabia surged by 147% YoY in January, according to the monthly bulletin of the Saudi Arabian Monetary Authority (SAMA). Last month marked the highest level of mortgage loans in the history of Saudi banks, in terms of the number of contracts as well as provided finances. The number of mortgage contracts reached around 23,668 contracts, compared with 9,578 in January 2019, with an increase of 2% on a monthly basis compared to its level in December of last year. Commercial banks accounted for 94% of these contracts, while housing finance companies provided 6%. Products supported by the housing programs accounted for 22,432 contracts with a total value of SAR 9.4bn, or about 93% of the total finances. (Zawya) Saudi Arabia may slash April oil prices to Asia by most since 2012 – Saudi Arabia is expected to make the deepest cuts to its monthly official selling prices (OSP) to Asia since 2012, tracking declines in Middle East benchmarks and weak refining margins as the coronavirus outbreak has cut demand. Large Saudi crude price cuts for a second straight month indicate that Asia, the world’s fastest growing demand center for oil, is swamped with supplies after the spreading virus led to run cuts at Chinese refineries. Six refiners polled by Reuters expect the April OSP for Asia for Arab Light crude will fall by $2.04 a barrel on average. That would be the biggest price cut for the Saudi flagship grade since early 2012, according to Refinitiv Eikon data. In February, the Dubai benchmark market structure moved into a contango, where prompt prices are lower than those in future months which indicates lower demand, from a backwardation in January, when prompt prices are higher than later prices, indicating higher demand. Asian refiners will also begin shutdowns in April for spring maintenance further dampening crude demand. (Reuters) Saudi Aramco sets March propane price at $430 a ton – Saudi Aramco has set its March propane price at $430 a ton, down from $505 a ton in February, the company stated. Saudi Aramco has set March butane at $480 a ton, down from $545 a ton in February. The prices provide a benchmark against which Middle East sales of liquefied petroleum gas (LPG) to Asia are gauged. (Reuters) Saudi Aramco secures unconditional EU okay for $69bn SABIC deal – Saudi Aramco has gained unconditional EU antitrust approval for its $69bn bid for a 70% stake in petrochemicals group Saudi Basic Industries Corp (SABIC), according to an EU filing. Saudi Aramco announced the deal in March last year, a move key to its diversification into refining and petrochemicals. The European Commission cleared the deal on Thursday, a filing on its site showed. Reuters reported on February 21 that the deal was heading for unconditional EU clearance. (Reuters) CBUAE recommends measures to mitigate coronavirus impact – The Central Bank of the UAE (CBUAE) advised banks to reschedule loans and reduce fees and commissions as part of measures to mitigate the economic effects of the coronavirus outbreak. The country is a regional business hub and major transit point for passengers travelling to China and other destinations in Asia. “Financial institutions are expected to implement measures such as re-scheduling of loans contracts, granting temporary deferrals on monthly loan payments, and reducing fees and commissions for affected customers,” it stated. (Reuters) Listed companies in UAE report AED78.52bn profit in 2019 – The combined profit of 126 listed Emirati and foreign firms amounted to AED78.52bn in 2019, a YoY growth of 7.7% from AED72.24bn, according to the financial statements revealed by these companies which account for 95.5% of 132 corporations trading in the Abu Dhabi Securities Exchange (ADX) and Dubai Financial Market (DFM). Most of the companies which failed to disclose their financial statements are foreign, given that the Securities and Commodities Authority mandates listed companies to file earnings reports within 45 days following the end of each fiscal quarter. According to these results, the banking sector continues its lead over other business platforms, securing net profit of AED46.47bn, a YoY growth of 11.6% from AED41.63bn. The realty sector came second with AED12.7bn followed by the telecommunication companies which reported
- 10. Page 10 of 12 AED10.43bn in profit. The three sectors' combined profit of AED69.6bn account for 88.6% of total earnings booked by all companies listed in the country's two main bourses. In more detail, 61 DFM-listed firms reported AED38.855bn, a growth of 14.4% over last year, while 65 ADX-listed companies announced AED39.67bn, up 2.8% on 2018. The Emirates NBD was the best performer with AED14.502bn, followed by First Abu Dhabi Bank, AED12.52bn. Dubai Islamic Bank achieved AED5.013bn in profit, while Abu Dhabi Commercial Bank reported AED4.79bn. (Zawya) Dubai's non-oil foreign trade up 6% – Dubai saw remarkable external trade growth in 2019, spurred by its efforts to achieve its 2025 trade target of AED2tn. The Emirate's non-oil foreign trade rose 6% to reach AED1.37tn last year despite headwinds from an intensified global economic downturn. In terms of value, Dubai's external trade hit AED1.371tn last year compared to AED1.299tn in 2018. Exports skyrocketed 22% to AED155bn, re-exports grew by 4% to AED420bn and imports rose by 3% to AED796bn. Over the 2010-19 decade, the value of Dubai's external trade went up by 52% thanks to the agility, versatility and flexibility of the external trade sector in the Emirate, which discovered alternative markets and trade paths to make up for sluggish growth in some markets. "Dubai's strong foreign trade performance, which reflects its robust economic fundamentals and its resilience against odds, gave it a positive start to 2020 - the year of preparation for the next 50 years," according to a statement. In terms of volume, non-oil external trade surged 19% from 91mn tons in 2018 to reach 109mn tons last year. Re-exports rose by a record 48% to reach 17mn tons, while exports rose by 45% to 19mn tons and imports grew by 9% to 72mn tons. These figures capped a prosperous decade for Dubai from 2010-2020, during which external trade grew by 70%. (Zawya) Dubai's Emirates Group sees slowdown due to coronavirus – Dubai’s Emirates Group has seen a measurable slowdown in business due to the coronavirus outbreak and has asked staff to take paid and unpaid leave, according to an internal email seen by Reuters. Emirates Group, a state-owned holding company that counts Emirates airline among its assets, had more than 100,000 employees, including more than 21,000 cabin crew and 4,000 pilots, at end-March 2019, the end of its last financial year. “A particular challenge for us right now is dealing with the impact of the COVID-19,” the email to staff said, using the name of the disease caused by the coronavirus SARS-CoV-2. “We’ve seen a measurable slowdown in business across our brands, and a need for flexibility in the way we work.” The email asked staff who have “accrued a significant balance of annual leave” to consider taking paid leave. It also stated the company was offering unpaid leave to employees in non- operational roles and may offer it to operational staff. “In all cases, we strongly encourage you to take up this opportunity if you have the support and approval of your line manager,” the email said. (Reuters) Dubai Islamic postpones Sukuk amid coronavirus volatility – Dubai Islamic Bank (DIB) has postponed a planned issuance of US dollar-denominated Sukuk due to market conditions resulting from the new coronavirus outbreak, sources said. DIB, the largest Islamic bank in the UAE, hired banks to arrange the Islamic bonds last month, a document showed on February 20. It was planning to raise the financing - likely to be $750mn - on February 26, but decided to wait for better market conditions, sources said. The potential deal received a good response from investors while it was being marketed, but volatility in the debt markets as the coronavirus outbreak intensifies would have increased the Sukuk profit rate, sources said. DIB has hired a group of banks including Emirates NBD Capital, First Abu Dhabi Bank, HSBC and Standard Chartered to arrange the deal. Fund managers have said a rise in regional bond spreads since the beginning of the year suggests the impact of the virus outbreak on global economic growth may translate into higher funding costs for Middle East debt issuers, potentially curbing new borrowing. (Reuters) NMC Health hires Moelis for debt restructuring – NMC Health, the UAE healthcare company, has hired Moelis & Co to advise on a debt restructuring, sources said. The sources said NMC had hired Moelis in relation to its ability to meet debt obligations. Britain’s Financial Conduct Authority (FCA) stated on February 27 it would investigate the finances of NMC Health, whose shares were suspended on the London Stock Exchange last week. NMC, part of the FTSE 100 index of leading shares has stated that it will cooperate with the FCA and any other relevant authorities. It had earlier stated it was focused on providing clarity to the market as to its financial position. NMC’s own review of its finances is being led by former FBI boss Louis Freeh. Standard Chartered, First Abu Dhabi Bank and HSBC are among the banks that provided debt to the company, sources said. The size of the loans could not be immediately determined. (Reuters) Abu Dhabi in talks with banks for debut loan of $2bn – The government of Abu Dhabi is in talks with banks for a $2bn loan, sources said, a move which would allow the oil-rich Emirate to tap new liquidity pools in an era of low oil prices. Abu Dhabi, the capital of the UAE, sold its latest international bonds in September last year, raising $10bn for budgetary purposes and garnering almost $20bn in demand. It is now working on a “self- arranged loan”, putting together commitments from banks for a potential $2bn debt facility which, if finalized, would be the government’s first, sources said. Rated ‘AA’ by S&P and Fitch and ‘Aa2’ by Moody’s, Abu Dhabi has one of the world’s largest sovereign net foreign asset positions and low levels of debt, but its fiscal balance depends almost entirely on revenue from hydrocarbon royalties and taxes and dividends received from Abu Dhabi National Oil Company (ADNOC), its national oil company. (Reuters) Mubadala to weigh investment in troubled NMC – Abu Dhabi wealth fund, Mubadala Investment Co. is considering a potential investment in NMC Health, a sign the Emirate is keen to address the worsening crisis at the troubled hospital operator, sources said. Mubadala has held early discussions to look at a range of options regarding the Middle East’s largest health care provider, including buying a stake and taking a board seat, sources said. While discussions are ongoing, there can be no guarantee of a transaction given the complex issues facing the company, sources added. The potential deal comes as NMC faces allegations by Carson Block’s Muddy Waters Capital that its financial statements hint at potential over payment for
- 11. Page 11 of 12 assets, inflated cash balances and understated debt. The company has said the allegations are baseless, however, in January hired former FBI Director, Louis Freeh to investigate. Mubadala is also seeking to expand into health care as part of Abu Dhabi’s efforts to diversify its economy by turning oil revenue into profitable investments. The fund is in talks to buy Jadwa Investment Co.’s health-care assets in the UAE, sources said last month. (Bloomberg) Kuwait’s January consumer prices rise 1.68% YoY and 0.09% MoM – Central Statistical Bureau in Kuwait City published Kuwait’s consumer price indices which showed that the consumer prices rose 1.68% YoY and 0.09% MoM. Food and beverages price index rose 2.51% YoY. Price index for transportation rose 3.88% YoY; communication rose 4.4% YoY. (Bloomberg) Al Ahli Bank of Kuwait reports net income of KD28.7mn – Al Ahli Bank of Kuwait reported net income of KD28.7mn for FY2019. The operating revenue came in at KD172.5mn for FY2019. The operating profit came in at KD105.5mn in FY2019. The bank has proposed dividend of 7 fils per share. The bank has attributed 32% drop in profit to higher provision for credit loss. (Bloomberg) Bahrain’s January consumer prices rise 0.1% YoY; remains unchanged MoM – Information & eGovernment Authority in Manama published Bahrain’s January consumer prices which showed that consumer prices rose 0.1% YoY; however, it remained unchanged MoM. Food and non-alcoholic beverages price index rose 0.2% YoY in January as compared to a rise of 2.7% in the previous month. (Bloomberg)
- 12. Contacts Saugata Sarkar, CFA, CAIA Shahan Keushgerian Zaid al-Nafoosi, CMT, CFTe Head of Research Senior Research Analyst Senior Research Analyst Tel: (+974) 4476 6534 Tel: (+974) 4476 6509 Tel: (+974) 4476 6535 saugata.sarkar@qnbfs.com.qa shahan.keushgerian@qnbfs.com.qa zaid.alnafoosi@qnbfs.com.qa Mehmet Aksoy, PhD QNB Financial Services Co. W.L.L. Senior Research Analyst Contact Center: (+974) 4476 6666 Tel: (+974) 4476 6589 PO Box 24025 mehmet.aksoy@qnbfs.com.qa Doha, Qatar Disclaimer and Copyright Notice: This publication has been prepared by QNB Financial Services Co. W.L.L. (“QNB FS”) a wholly-owned subsidiary of Qatar National Bank (Q.P.S.C.). QNB FS is regulated by the Qatar Financial Markets Authority and the Qatar Exchange. Qatar National Bank (Q.P.S.C.) is regulated by the Qatar Central Bank. This publication expresses the views and opinions of QNB FS at a given time only. It is not an offer, promotion or recommendation to buy or sell securities or other investments, nor is it intended to constitute legal, tax, accounting, or financial advice. QNB FS accepts no liability whatsoever for any direct or indirect losses arising from use of this report. Any investment decision should depend on the individual circumstances of the investor and be based on specifically engaged investment advice. We therefore strongly advise potential investors to seek independent professional advice before making any investment decision. Although the information in this report has been obtained from sources that QNB FS believes to be reliable, we have not independently verified such information and it may not be accurate or complete. QNB FS does not make any representations or warranties as to the accuracy and completeness of the information it may contain, and declines any liability in that respect. For reports dealing with Technical Analysis, expressed opinions and/or recommendations may be different or contrary to the opinions/recommendations of QNB FS Fundamental Research as a result of depending solely on the historical technical data (price and volume). QNB FS reserves the right to amend the views and opinions expressed in this publication at any time. It may also express viewpoints or make investment decisions that differ significantly from, or even contradict, the views and opinions included in this report. This report may not be reproduced in whole or in part without permission from QNB FS. COPYRIGHT: No part of this document may be reproduced without the explicit written permission of QNB FS. Page 12 of 12 Rebased Performance Daily Index Performance Source: Bloomberg Source: Bloomberg (* Data as of February 27, 2020) Source: Bloomberg Source: Bloomberg (*$ adjusted returns) 60.0 80.0 100.0 120.0 140.0 Feb-16 Feb-17 Feb-18 Feb-19 Feb-20 QSE Index S&P Pan Arab S&P GCC (3.7%) (0.6%) (9.2%) (3.4%) (1.2%) (3.6%) (4.5%) (12.0%) (8.0%) (4.0%) 0.0% SaudiArabia Qatar* Kuwait Bahrain Oman AbuDhabi Dubai Asset/Currency Performance Close ($) 1D% WTD% YTD% Global Indices Performance Close 1D%* WTD%* YTD%* Gold/Ounce 1,585.69 (3.6) (3.5) 4.5 MSCI World Index 2,141.12 (1.7) (10.9) (9.2) Silver/Ounce 16.67 (6.2) (9.9) (6.7) DJ Industrial 25,409.36 (1.4) (12.4) (11.0) Crude Oil (Brent)/Barrel (FM Future) 50.52 (3.2) (13.6) (23.5) S&P 500 2,954.22 (0.8) (11.5) (8.6) Crude Oil (WTI)/Barrel (FM Future) 44.76 (4.9) (16.1) (26.7) NASDAQ 100 8,567.37 0.0 (10.5) (4.5) Natural Gas (Henry Hub)/MMBtu 1.79 (1.1) (8.7) (14.4) STOXX 600 375.65 (3.4) (11.1) (11.5) LPG Propane (Arab Gulf)/Ton 39.50 0.6 (8.9) (4.2) DAX 11,890.35 (3.7) (11.3) (11.9) LPG Butane (Arab Gulf)/Ton 49.63 (1.2) (24.2) (25.2) FTSE 100 6,580.61 (4.1) (12.6) (16.1) Euro 1.10 0.2 1.7 (1.7) CAC 40 5,309.90 (3.2) (10.8) (13.0) Yen 107.89 (1.6) (3.3) (0.7) Nikkei 21,142.96 (1.9) (6.7) (10.0) GBP 1.28 (0.5) (1.1) (3.3) MSCI EM 1,005.52 (2.4) (7.3) (9.8) CHF 1.04 0.2 1.3 0.3 SHANGHAI SE Composite 2,880.30 (3.5) (4.8) (6.0) AUD 0.65 (0.8) (1.7) (7.2) HANG SENG 26,129.93 (2.4) (4.4) (7.4) USD Index 98.13 (0.4) (1.1) 1.8 BSE SENSEX 38,297.29 (4.9) (7.6) (8.8) RUB 66.89 1.3 4.4 7.9 Bovespa 104,171.60 0.6 (10.5) (19.4) BRL 0.22 0.3 (1.8) (10.1) RTS 1,299.69 (6.2) (14.8) (16.1) 127.9 117.8 99.4