
Recommended
Recommended
More Related Content
What's hot
What's hot (20)
Similar to Harmonizing phenomics and genomics for enhanced rice salt tolerance
Similar to Harmonizing phenomics and genomics for enhanced rice salt tolerance (20)
Recently uploaded
Recently uploaded (20)
Harmonizing phenomics and genomics for enhanced rice salt tolerance
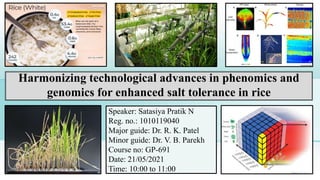
- 1. Harmonizing technological advances in phenomics and genomics for enhanced salt tolerance in rice Speaker: Satasiya Pratik N Reg. no.: 1010119040 Major guide: Dr. R. K. Patel Minor guide: Dr. V. B. Parekh Course no: GP-691 Date: 21/05/2021 Time: 10:00 to 11:00
- 2. Contents 6 5 4 7 2 1 3 Introduction Timeline for rice salt tolerance breeding Rice under saline condition Breeding for salt tolerance : Conventional and modern approaches Phenotyping approaches for salt tolerance Imaging technologies for high throughput phenotyping Genomics for salt tolerance 8 Case studies 9 Conclusion 1
- 3. 2
- 5. Saline soils: A brief account • 6 % of the global area is salt affected (20 % cultivated). • Salt affected soils, likely to increase to 16.2 million ha by 2050 in India. • Maximum salt affected soils are in Gujarat (2.22 m ha) followed by Uttar Pradesh (1.37 m ha). • It has been estimated that 50 % of the aerable land will be saline due to salt accumulation. • More than 80 Mha of irrigated land have already damaged by salt (40 % of irrigated land). Saline soils (Mha) Sodic soils (Mha) Total (Mha) World 376 434 810 India 2.956 3.771 6.727 Gujarat 1.68 0.54 2.22 Curtesy: https://www.salineagricultureworldwide.com/salinization 4 Table 1: Status of saline soils
- 6. (Arora and Sharma, 2017) Area (Mha) Production (Mt) Productivity (kg/ha) India 43.70 112.91 2432 Gujarat 0.84 1.92 2283 • Rice is very sensitive to salinity stress and is currently listed as the most salt sensitive cereal crop. • Floodwater with EC more than 2 dSm−1 leads to yield loss up to 1 t/ha. • Even at EC as low as 3.5 dSm−1, rice loses about 10% of its yield. • 50% yield loss was recorded for rice at EC 7.2 dSm−1. • Excess salt caused both ionic toxicity and osmotic stress in rice plants. • Under high salinity, rice plants show various morphological, physiological or biochemical alterations and symptoms and even may die when the salt stress becomes very high. Rice under saline condition: A brief account 5 Table 2: Status of rice cultivation FAO stat, 2018-19
- 7. Roadmap with success in salt tolerance breeding Tamimi et al. International Rice Genome Sequencing Project The map based sequence of rice genome Zhang A et al. (2019) 1969 1990s Work on genetic dissection of traits started Found additive and dominance effects and low heritability. Senadhira et al. Somaclonal variant of pokkali with improved ST Transfer of traits form donor Linkage drag is major problem 1994 1996 Anther culture for ST 8 AC derived ST lines developed in just 3 years 1990 Claes et al. First QTL for ST: salT on chromosome 1 1980s Gregorio et al. Seedling stage phenotyping for ST under phytotron Saltol : for Na/K homeostasis 1997 2005 Screened 138000 Genotypes for salt tolerance. GEU Program at IRRI mutagenesis in OsRR22 without exogenous T-DNA using CRISPR-Cas Agrisea (2020) Private start up to develop sea rice floating fields 2018 Frouin et al. Used GBS approach of GWAS for QTL mapping Use of high throughput phenotyping for ST 2019 2016 6
- 8. 7
- 9. Fight for survival under saline conditions Cl- Na+ Na+ Na+ Cl- Cl- Cl- Cl- Cl- Battle lost: Susceptibility Battle won: Tolerance Stomatal closure, Reduced TR and increased leaf temp. 1st Response: Osmotic stress High apoplastic and Symplatsic Na+ absorption Na+ K+ K+ K+ Na+Na+ K+ K+ K+ K+ Na+ K+ NaK++K+Na+ K+ K+ K+ K+ K+ High proliferation of root cap: Na+ exclusion Intracellular compartment- talization of Na+ to vacuole Accumulation of GH (ABA, JA, CK, IAA & BRs), osmolytes (Proline & GB), Sugars (Trehaloes & myoinositol) and aqaporins Accumulation of GH (ABA, JA, CK, IAA & BRs), osmolytes (Proline & GB), Sugars (Trehaloes & myoinositol) and aqaporins High Na+ accumulation to Flag leaf 2nd Response: Ionic stress Na+ Higher rate of lower leaf death Na+K+Na+Na+N a+Na+NaK++K+ Na+Na+Na+Na+ K+Na+Na+Na+K +Na+Na+Na+ Intercellular compartmentalization resrtiction of Na+ to root zone and ion exclusion Na + Exclusion Tissue tolerance 2nd Response: Ionic stress 8
- 10. Conventional breeding for salt tolerance: Dark side Salinity tolerance: A complex trait phenotype Why conventional Breeding alone is not an option ?? Large G × E interactions Early generation selection is not possible Plant population would not be sufficient if we wait Seed germination, early seedling vigour, chlorophyll content, root and shoot Na/K ratio, Salinity scoring, Leaf area, Number of productive tillers, Pollen fertility, Spikelet fertility, Chaffy panicles, leaf rolling, flag leaf length, Flag leaf Na/K ratio, Harvest index, Biomass content and ultimately yield Phenotyping accuracy is very low 9
- 11. Conventional Breeding: Bright side 1 3 2 Lorem Ipsum is simply dummy text of the printing and typesetting industry. 4 Lorem Ipsum is simply dummy text of the printing and typesetting industry. 1 Lorem Ipsum is simply dummy text of the printing and typesetting industry. Inter-specific variability • O. rufipogon (GP1) • O. nivara (GP1) • O. coarctata (GP3) • O. latifolia (GP2) • O. meridionalis (GP1) • O. australiensis (GP2) Prebreeding • FL-478 • IR 4630-22-2-5-1-3 • IR 4595-4-1-13 • IR 9884-54-3 • IR 10167-129-3-4 • IR 55179-3B-11-3 and so many Released varieties • CSR-10 • CSR-13 • BR-11 • BRRI dhan 28 • PB6 • Pusa basmati 1121 (saltol) etc. Intra-specific variability • Pokkali • Nona bokra • Cheriveruppu • SR26B • Getu • Dandi Quest for donors Genome size ~ 400 mb 10
- 12. Salt stress breeding and rice: 21st century Multi-disciplinary approach Advancement in Plant Molecular biology Advances in plant physiology Advances in breeding systems 2 Functional Genomics Transgenics, Epigenetics Genomics, Phenomics, Transcriptomics, Proteomics Metabolomics Metabolite profiling Genome editing Use of Mi-RNA Association mapping GWAS Improved Screening methods for salinity tolerance QTL mapping GBS MAS TILLING And Eco-TILLING Candidate gene MABC Genomic selection Soil metagenomics Advances in Microbiology 11
- 13. Phenomics and Genomics: Two sides of a single coin • Phenomics is systemic genome wide study of phenotypes of an organism. • Germplasm evaluation and varietal development through field evaluation and novel phenotyping protocols for target soil stress factors have not taken the expected advantage of spiraling developments in molecular and computational biology. Phenomics Genomics 2 • Genomics is an interdisciplinary field of biology focusing on the structure, function, evolution, mapping and editing of genomes. • The genomics and transgenic technologies have so far provided little success in developing successful salt tolerance rice varieties for actual field conditions. Harmonization between these two is a key to achieve history making accomplishments 12
- 14. Phenotyping to phenomics: A step towards precision breeding Phenotyping • Determination of type and level of expression of concerned trait. • As salt tolerance is an complex quantitative trait, it is challenging task to carryout accurate data. • Accurate phenotyping is far more difficult than genotyping. • Become a bottleneck for progress in basic plant science and plant breeding. Phenomics • Concerned with the measurement of phenomes where a phenome is the set of phenotypes (physical and biochemical traits). • Integrative approach of Plant biology, Mathamatics, Engineering and Computer science. • Forward phenomics: methods to screen germplam for valuble traits. • Reverse phenomics: Detailed analysis of a trait to unravel various biophysical, physiological and biochemical processes, and genes involved in that. 13
- 15. Seedling float: salinity screening at seedling stage Plastic tray: 12 L Nylon net Styrofoam sheet Materials • pH meter • EC meter • Balance • NaOH and HCI • NaCl • Reagents • Convection oven • Germinator oven • Volumetric flasks • Graduated cylinders • Plastic trays • Beaker • Styrofoam sheets • Nylon net Making of seedling floats • Rectangular Styrofoam of size 28 × 32 × 1.25 cm • Drill 100 holes (10 × 10 cm) • Fix nylon net at the bottom • Rectangular plastic tray with 12-L capacity and 4 × 30 × 35 cm size Preparation of stock solutions and salinization • Nutrient solution for hydroponics is prepared by the method suggested by Yoshida et al. (1976). • pH adjusted and maintained at 5.0 • Replace the solutions at every week • As the time arrives salinize the solution with analytical grade NaCl (SES, IRRI, 2002) 14 Fig. 1: Seedling float
- 16. Seedling float: salinity screening at seedling stage Handling of seedlings • Seeds are heat treated in oven at 50 ºC for 5 days to break seed dormancy. • Place the sterilized seeds to Petri plate with moisten germination paper. • Incubate 30 ºC for 48 hrs for germination. • Place single seed per hole in Styrofoam sheet. • Sheet is then transferred to tray having distilled water for 3 days. • After 3 days, change water with Yoshida solution. • Nutrient solution should be changed weekly. Salinization method and its modifications • If only visual observations taken, salinization cand be started from the 3rd day and continued for 14 days. • When we need tissue sample for further analysis, salinization must be delayed till 14th day. • It is essential to add sodium meta-silicate 9-hydrate to avoid the seedlings from lodging. • Sampling and salinization done when susceptible check scores 7 which is 20-25 days after salinization. • In another modification we can use green house instead of phytotron but there are many environmental factors affecting the screening.
- 17. Characters under consideration at seedling stage Physio-biochemical parameters • Chlorophyll content • Shoot Na+ content • Shoot K+ content • Root Na+ content • Root K+ content • Na+/K+ ratio for shoot • Na+ /K+ ration for root Agro-morphological parameters • Plant survival • Injury score • Shoot length • Root length • Seedling fresh weight • Shoot biomass • Root biomass Score Observation Tolerance 1 Normal growth, no leaf symptoms HT 3 Nearly normal growth but leaf tips or few leaves whitish and rolled T 5 Growth severely retarded; most leaves rolled; few are elongating MT 7 Complete cessation of growth; most leaves dry; some plants dying S 9 Almost all plants are dead or about to die. HS Modified standard evaluation score 16
- 18. Screening at reproductive stage Plastic tray Fig. 2: Set up for salinity screening at reproductive stage Plastic pot Materials • Plastic pots (15 cm height 11 cm diameter) • Plastic trays (22 cm height) • Cloth bags (cotton) • EC meter • Well ground soil from paddy field • NaCl and fertilizers Preparation of pots and cloth bags • The wall of plastic pot should be drilled with 3-4 mm diameter holes 2 cm apart. • The top most circle of holes should be at least 3 cm below the rim of plastic pot. • stitch cloth bags that fit well inside the plastic pot. Seeding and salinization • Place a cloth bag inside the pot and fill with fertilized soil. • With leveled soil place pots in the plastic tray filled with tap water. • Four to five pregerminated seeds of test entries are placed on soil surface of each pot. • Salinity treatment given to 21 days old seedling. (SES, IRRI, 2002) 17
- 19. Introduction to novel phenotyping method Curtesy: Ahmadizadeh M (2016) Materials required • Plastic pots 30 cm height • EC meter • Well ground soil from paddy field • NaCl and fertilizers • Normal water source (< 4 EC) Methodology • Test seeds have to be heat-treated for 5 d in a convection oven set at 50 ºC to break seed dormancy. • Sowing of the treated seeds in the small homogeneous patch of the field. • Transplant three healthy seedlings per pot after 21 days • Appropriate fertilizers and water level maintained in the pots. • At the time of booting stage, salinization treatment given to the pots. • At that time, prune the lower leaves leaving only flag leaf and penultimate leaf. • Salinity level of the pot is maintained daily for 10-15 days. • After the completion of the salinization period, irrigate the pots with normal water till harvesting. 18 Fig. 3: Leaf cutting experiment
- 20. 1 2 3 4 Stress susceptibility index (S) Stress tolerance index (STI) Tolerance index (TOL) Mean Productivity 𝑆 = 1 − (𝑌𝑠 𝑌𝑝) 𝐷 Ys = Mean grain yield of genotype under stress Yp = Mean grain yield of genotype under non stress Xp= Mean yield of all genotypes under non stress Higher the STI---Tolerance Lower the STI---Suceptibility Fischer and Maurer, 1978 𝑆𝑇𝐼 = (𝑌𝑝 × 𝑌𝑠)/(𝑋𝑝)2 Fernandez, 1992 Ys = Mean grain yield of genotype under stress Yp = Mean grain yield of genotype under non stress D = Stress intensity (1-(Xms-Xmp)) Xms= Mean yield of all genotypes under stress Xmp= Mean yield of all genotypes under non stress Higher the S---susceptibility Lower the S---Tolerance 𝑀𝑃 = (𝑋𝑠 + 𝑋𝑝)/2 Rosielle and Hamblin, 1981 Xs = Yield of given genotype under stress Xp = Yield of same genotype under non stress Rosielle and Hamblin, 1981 𝑇𝑂𝐿 = (𝑌𝑝 − 𝑌𝑠) Ys = Yield of given genotype under stress Yp = Yield of same genotype under non stress 19
- 21. Flag leaf area 14 12 10 7 6 3 2 Flag Na+/K+ ratio Pollen fertility (%) Panicle length (cm) Grain yield per plant (gm/plant) Plant height (cm) Spikelet sterility (%) 16 Seeds/ Panicle Traits under consideration at reproductive stage Productive tillers/ plant • Flag leaf length • Width • Area in cm2 • Ratio of unfilled grains to total number of grains • Counting papery spikelets and chaffy panicles • Number of filled seeds per panicle • Spikelet fertility by deriving ratio of filled grains to total no. of grains 1 4 5 8 9 11 13 15 ABA content TUE (%) Relative Growth Rate Transpiration rate Net photosynthesis rate Proline content Stomatal Conductance 20
- 22. • Absorbs light of given wavelength and emits light of a longer wavelength • Majorly used for chlorophyll fluorescence Fluorescence imaging 04 The imaging technologies: In respect of salinity tolerance (Hairmansis et al., 2014) RGB images Fluorescent images 01 • 400-700 nm • Quantitative estimation of leaf area, leaf senescence, rolling, yellow and green areas • Relative growth rate (Time lapse visual imaging) • Prediction of biomass production • No of chaffy and papery panicles RGB (visible image range) 03 • 8000-14000 nm • Estimation of canopy temperature which indirectly indicates stomatal conductance and relative photosyntatic ability • Assay the crop water use Infrared imaging • 800-1300 nm • Water index • Information about various pigments like chlorophyll, carotenoids and xanthophyll • Leaf color differences Near infrared imaging 02 21 Fig. 4: Different images captured with different wavelength
- 23. Genomics for salinity tolerance • Recently, the development of high quality reference genome of rice has facilitated the high density genotyping (McCouch et al., 2016) and re-sequencing of more than 3000 rice varieties made addition to it. • Therefore, genomic dissection of salt tolerance and its components can pave the way for systematic and precise gene transfer in salt sensitive cultivars through marker assisted breeding. • Though there have been numerous attempts to review work on genes/ QTLs for salt tolerance, genomic data offers insights of QTL mapping (Linkage and population mapping), Transgenic approaches, genome editing and soil metagenomics approaches for salt tolerance in rice. Fig. 5: Geographical distribution of sequenced rice genomes Ganie et al, 2019 Song et al., 2018 Fig. 6: Genomic resources related to salinity tolerance 22
- 24. 2 QTL mapping Development of mapping population • F2 (very limited scope) • DHs (recombination: 1 gen) • RILs (mostly used) • NILs (Fine mapping of QTLs) • CSSLs (Ideal for QTL mapping) • AILs (5x reduced CI then F2 ) Phenotyping of mapping population along with parents • Should be done in replicated trials over the locations and year. • High throughput phenotyping provides better accuracy. • The accuracy of phenotyping (increases heritability) determines how realistic the QTL mapping results are. Genotyping of parents to identify polymorphism and use it on individuals of mapping population • Done with molecular markers like RFLP, RAPD, SSRs, SNPs etc. or GBS approach Marker genotype and trait phenotype data are analyzed to detect association between them • QTL mapping parameters: Regression and Maximum likelihood method • Softwares: SAS, Qgene, QTL Cartographer, PLABQTL, MQTL, MapMaker/QTL Term QTL by: Gelderman 1975 A chromosomal region that contains gene(s) that affects a quantitative trait 2 1 4 3 Methods for QTL mapping : • Single Marker Analysis (SMA) • Simple Interval Mapping (SIM) • Composite Interval Mapping (CIM) • Multiple Interval Mapping (MIM) Factors affecting: • Genetic properties of QTLs • Genetic background • Size of the mapping population • Environmental effects • Experimental error LOD score: > 3 23
- 25. QTL mapping and salt tolerance in rice • To date, the best-known QTL studied for rice salt tolerance is Saltol (to maintain K+/Na+ homeostasis.). • Maximum number of salt tolerance associated QTLs are reported on chromosome 1, followed by 3, 4, 6, 7, 2 and 9. (Ganie et al., 2019) 24 Fig. 8: Chromosomal location of salt stress-related QTLs in rice Fig. 7: Different traits correlated with salt responsive QTLs of rice
- 26. Association mapping Association mapping population/ germplasm Precise phenotyping Genotyping (population structure analysis) Structure and kinship analysis Genotyping (LD analysis) AM and LD analysis 6 5 4 3 2 1 • A population-based survey used to identify trait- marker relationships based on linkage disequilibrium by exploiting historical and evolutionary recombination events. • Two types: GWAS and Candidate gene association mapping • Power of AM and statistical analysis Abdurakhmonov and Abdukarimov, 2008 1. Extent of LD in the genomic region 2. Type of gene action involved 3. Size and composition (structure) of population 4. Field design and data analysis (Genotyping and phenotyping) 5. Structured association (SA) to avoid false positives • Softwares used in AM: STRUCTURE 2.3, TASSEL, BAPS, mStruct, GenStat, JMP genomics 25
- 27. • A recent genome-wide association study has led to the identification of 20 significant SNPs for K+/Na+ ratio on four rice chromosomes (1, 4, 6 and 7), whereas 44 significant SNPs were detected for different traits such as yield per plant, filled grains, spikelet fertility, productive tillers and stress susceptibility index observed under salt stress (Kumar et al., 2015). • Most of the SNPs for Na+/K+ ratio were located on chromosome 1 near saltol locus. • During reproductive stage, the significant SNPs increased under salt stress as compared to the unstressed condition, since most of the SNPs for Na+/K+ ratio were detected in saltol (affecting salt tolerance at rice seedling stage). • Seven SNP markers associated with the salt responsive QTLs have been identified (Bimpong et al., 2014). • In this prospect, a recent genome-wide association analysis in rice has identified 20 QTNs associated with 11 salt tolerance traits using 395,553 SNP markers (Naveed et al., 2018). Association mapping and salt tolerance in rice 26
- 28. Transgenic approach • Genes are taken from other species in order to get insertion of gene(s) controlling traits without dilution of any desirable trait of a recipient elite genotype • Improve salinity tolerance in rice by various approaches like control of organic solutes, antioxidants detoxifying ROS, transport of ion, late embryogenesis proteins (LEP) and heat-shock proteins, programmed cell death (PCD), signal transduction and transcription factor (TF) etc. Antioxidants and ROS detoxification • CAT1 and GST from Suaeda salsa (Zhao and Zhang, 2006), • GlyII from Oryza sativa (Singla-Pareek et al., 2008), • GS2 from Oryza sativa (Hoshida et al., 2000), • katE from Escherichia coli (Nagamiya et al., 2007; Moriwaki et al., 2008), • Mn-SOD from Saccharomyces cerevisiae (Tanaka et al., 1999), • Sod1 dismutase - Avicennia marina (Prashanth et al., 2008) Ion homeostasis and compartmentation • nhaA from Escherichia coli (Wu et al., 2005), • AgNHX1 from Atriplex gmelini (Ohta et al., 2002), • OsNHX1 Vacuolar from Oryza sativa (Fukuda et al., 2004; Biswas et al., 2015; Chen et al., 2007), • SOS2 from Schizosaccharomyces pombe (Zhao et al., 2006), • PgNHX1 from Pennisetum glaucum (Verma et al., 2007) • OsKAT1 from Oryza sativa (Obata et al., 2007). • Recently, a salt-tolerant transgenic rice has been developed using over-expressing a gene, OsIF (Oryza sativa intermediate filament) from wild rice (Porteresia coarctata) which is native to India, Bangladesh, Sri Lanka and Myanmar (Soda et al., 2018). 28
- 29. Genome editing in rice for salinity tolerance • CRISPR/Cas has been used widely in many crops and in rice also it has shown huge success in making desirable changes against various biotic and abiotic stresses (Khang 2018). • Zhang A et al. (2019) obtained two homozygous mutant lines that harbor mutagenesis in OsRR22 without exogenous T-DNA and found salinity tolerance at the seedling stage. Fig. 10: General strategy for improving rice through genome editing Steps: • The first step is gRNA design and construct development. • After confirmation of the construct it is transferred either in Agrobacterium or coated on gold particles for biolistic bombardment. • The construct is transformed to rice callus. The plants are regenerated from this callus. • The regenerated plants are confirmed through PCR and restriction digestion, followed by sequencing. • The plants are then screened for desired characteristics and moved to the greenhouse and then to field trials. (Zafar K. et al., 2020) (curtesy: Mounadi et al., 2020) 27 Fig. 9: CRISPR-Cas9 mediated gene-editing mechanisms.
- 30. Other approaches 1 EcoTILLING • A significant method for SNP and InDel discovery of haplotypes at specific loci. • Study of 392 rice accessions has resulted in the discovery of 11 significant salinity-related SNPs from five salt- responsive genes, such as K24E (in salt), T67 K and P140A (in OsHKT1;5) (Negrão et al., 2013). Allele mining • Identifying the effective allelic forms is the prerequisite for utilizing the full potential of a gene affecting a specific trait. • 52 SSRs and 124 SNP markers linked with different salinity-related QTLs and candidate genes have been used to genotype the European Rice Core collection (ERCC) (Ahmadi et al., 2011). Whole-genome re-sequencing • Whole-genome re-sequencing has enabled the discovery of many SNPs and InDels in QTL regions, which may act as functional markers to screen the large rice germplasm for salinity tolerance (Jain et al., 2014). • 3000 rice genotypes, have been re-sequenced (Li et al., 2014), with the aim of finding valuable genomic resources in the form of allelic variations and eQTLs. Transcriptomic profiling • Global transcriptome profiling gives a snapshot of the genes involved in the different biosynthetic pathways and metabolic processes operating in a particular tissue under a specific condition. • Interestingly, transcript expression profiling has been correlated with the genetic diversity between two contrasting rice genotypes (Jiang et al., 2013). 29
- 31. Ocean Agriculture • However, despite all this progress, hopes rest on the CRISPR-based efforts of ‘Agrisea’ (a Canadian start-up company; https://www.agrisea.co.uk/), who intend to grow rice in the ocean in a practice called ‘Ocean Agriculture’ and to overcome the seawater tolerance barrier. • The company’s approach to producing genetically engineered salt-tolerant rice is based on editing a network of genes (not just one gene), having edited eight different genes that are only switched on in plants that are naturally adapted to high salinity. • The floating ocean rice farms are expected to be ready by the end of 2021. Transgene free
- 32. 31
- 33. Case study I 32 Thuwal, Saudi Arabia Al-Tamini et al. (2016)
- 34. • Two Smarthouses, north-east (NE) and north-west (NW), with conveyor systems are connected to one imaging hall with five camera stations (LemnaTec Scanalyzer 3D) for the daily non-destructive phenotyping of plants. • The imaging stations providing fluorescence imaging, near-infrared imaging, near-infrared imaging of pots (soil), red-green-blue visible imaging and far infrared (thermal) imaging. Double-pot design to enable growth of rice in controlled waterlogged conditions, to which salt could be applied. Materials and methods • Used two diversity panels composed of two major rice subpopulations, indica and aus, which contain 297 and 257 accessions, respectively. • Salt treatment was applied at 24 DAT (29 days after germination) with final concentration of 150 mM NaCl in the soil solution after drying down to 950 ml. • Daily imaging and watering were continued for 13 days after treatment until 37 DAT. Experimental design • split-plot design • No of pots: 1,056 pots (plants) • main-plot was a partially replicated, blocked, row-and- column design. 2 Plant material 1 33
- 35. RGB image capture and image analysis • Plant imaging started at 23 DAT and continued until 37 DAT (which was 13 days after treatment). • Shoot images were taken using the LemnaTec 3D Scanalyzer system (LemnaTec GmbH, Germany). • Plants were imaged daily in an imaging chamber using two 5-megapixel visible/RGB cameras. Data preparation for main traits and their derived indices • Data corresponding to the Projected Shoot Area (PSA), the weight before imaging, the weight after imaging and the weight of the evaporation cart were recorded daily between 23 and 37 DAT. Genome-wide association analysis • GWAS performed with diversity panels of indica and aus independently and also with a combined single set (INDAUS). • A 700k SNP array designed by McCouch’s laboratory at Cornell University was used for genotyping. • As a result, a total of 397,659 SNPs in the indica subpopulation, 394,785 SNPs in the aus subpopulation and 304,877 SNPs in the combined INDAUS subpopulations for GWAS. • TASSEL software (http://www.maizegenetics.net/tassel) : For response for each salt treatment in a separate model. • ASReml-R: The interaction model, combine each response for both treatments. 3 2 1 34
- 36. • RGR was lower in the salt-treated accessions than in the control plants for both rice panels. • Indica lines maintained better growth than aus lines. • As expected, RGR decreases through time to a greater extent under saline conditions than in control conditions. • More specifically, a rapid reduction in biomass production was observed immediately after salt application, suggesting that the rice plants responded to the ‘osmotic component’ of salt stress, before a build-up of salt in the leaves could impact plant growth, as occurs after several days, in the later ‘ionic phase’. 35 Fig. 11: Relative growth rate (RGR) of salinity-induced responses comparing indica and aus Results
- 37. Association analysis of salinity-induced responses • The early time interval (2-6 days after treatment) had multiple significant peaks associated with TUE under saline conditions (on chromosome 11 of indica and chromosomes 5, 9 and 11 of aus), that disappeared from later time intervals. • The interval 2-6 days after treatment represents the early response phase to salinity, while the later intervals, 6-9 and 9-13 days after treatment, appear to be affected by different processes, which may represent a shift in the relative importance of ‘osmotic’ and ‘ionic’ processes between these intervals. Fig. 12: SNPs associated with TUE are shown at the different time intervals 36
- 38. Candidate genes underlying QTLs in early salinity responses Table 3: Candidate genes and local linkage disequilibrium region underlying the most significant using the interaction model • In the indica panel, one of the most promising regions is located at 3.62-3.76 Mb on chromosome 11 (harbors several candidate genes, Os11g07230 (encoding a receptor kinase) and Os11g07240 (encoding a serine/threonine-protein kinase). • Regions significant for TUE traits in the aus panel under salt stress harbor genes related to signaling and signal transduction, such as Os03g16130 (encoding a calcium/calmodulin-dependent kinase), Os05g39870 (encoding OsCIPK28 and CAMK_KIN1, calcium/calmodulin-dependent protein kinase). • Hence, results show that candidate genes found in the early intervals, 2-6 and 2-9 days after treatment, are mainly encoding for signaling proteins, further supporting the hypothesis that the early responses to salt stress are related to signaling mechanisms. 37
- 39. Table 3: Candidate genes and local linkage disequilibrium region underlying the most significant using the interaction model (continued) 38
- 40. • Advances in image-based phenotyping that use new methods to recover the structure of a plant and build a three-dimensional (3D) model are likely to play a useful role in determining tiller number per plant, a key trait for rice yield. • High-throughput phenotyping produces multiple measurements over time, which require new methods of analyses that are flexible in their quantification of plant growth. • Relative growth rate, transpiration rate and transpiration use efficiency (TUE) are analyzed using a new association model that takes into account the interaction between treatment (control and salt) and genetic marker. • This model allows the identification of previously undetected loci affecting TUE on chromosome 11, providing insights into the early responses of rice to salinity, in particular into the effects of salinity on plant growth and transpiration. Conclusion 39
- 41. Case study II 40 LA, USA Puram et al. (2018)
- 42. Materials and methods 3 2 1 Plant Materials: Rice variety ‘Cheniere’ • Long grain • High yielding • Early maturing • semi-dwarf variety • Susceptible to salinity Rice variety ‘Nona Bokra’ • Photosensitive • Late maturing • salinity-tolerant indica landrace BC3F4 introgression lines (ILs) were generated after three back crosses followed by selfing for three generations using single seed descent method. Screening for Salinity Tolerance • 112 introgression lines along with parents were phenotyped for seedling stage salinity tolerance. • Randomized complete block design with three replications. • Pregerminated seeds transferred to nutrient solution. • Seedlings at two leaf stage were subjected to salt stress at EC of 6 dSm−1 for 2 days followed by EC of 12 dSm−1. • Phenotypic observations under both stress and control were recorded on five uniform plants. • The visual salt injury score (SIS) was recorded on 1 to 9 scale. 41
- 43. 6 5 4 Statistical Analyses • Analysis of variance (ANOVA) with IL and replication as fixed effect and random effect, respectively. • The relationship among different morpho-physiological traits by computing Pearson correlation coefficients. • The distribution pattern of the ILs visualized from the histograms constructed in Microsoft Excel 2010. Genotyping of Introgression Lines Using SSR Markers • Genotyping of ILs was done using SSR markers. QTL Mapping • CSSL finder v.0.9.7.2.2 was used to estimate the genome composition of the ILs (Lorieux 2005). • Linkage map was constructed using QTL IciMapping software v. 4.1 using common SSR markers in both ILs (Cheniere × Nona Bokra and Jupiter × Nona Bokra) (Wang et al., 2016). • Significant QTLs were detected at LOD threshold of 2.0 using interval mapping. • The candidate genes were obtained from the Rice Genome Annotation Project Database. 42
- 44. ILs developed Fig. 14: Jupiter (B) × Nona Bokra (W) Fig. 13: ILs from Cheniere (B) × Nona Bokra (W) 43
- 45. Fig. 15: Frequency distribution of ILs for eight morpho-physiological traits under salt stress (EC 12 dSm−1) and salt tolerance indices SIS: Salt injury score, Na+: Na+ concentration, K+: K+ concentration, NaK: Na+/K+ ratio, CHL: Chlorophyll content, SHL: Shoot length, RTL: Root length, DWT: Dry weight, SRI-Na+: Relative shoot sodium concentration, SRI-K+: Relative shoot potassium concentration, SRI-NaK: Relative shoot sodium to potassium ratio, SRI-SHL: Relative shoot length, SRI-RTL: Relative root length, SRI-DWT: Relative shoot dry weight 44
- 46. QTLs Fig. 16: Comparative map positions of QTLs for traits related to seedling stage salinity tolerance 45
- 47. QTLs identified • The QTLs for shoot Na+ concentration were identified on the chromosomes 2, 3, and 8 in the JN IL population, whereas only one QTL was identified on chromosome 7 in this study. • For K + concentration in the shoot, all three QTLs had favorable effect from ‘Nona Bokra’ alleles. The QTL qK1.1 was close to the QTL identified in the JN IL population, qSKC-1 and Saltol QTL. • The QTLs identified for shoot and root lengths, chlorophyll content, and shoot dry weight also contributed toward salinity tolerance. Only one QTL identified for chlorophyll content on chromosome 6 in this study was on map location different from that in the JN IL population. • In total, 18 different QTLs were identified for salt tolerance indices computed for several morphological traits. 46
- 48. Table 4: Additive QTLs detected in ILs for seedling stage salinity tolerance Table 5: Summary of QTLs co-localizing to published QTLs 47
- 49. • The results from this study suggested that Na+ and K+ homeostasis, Na+ exclusion, and Na+ compartmentation are key mechanisms for salt tolerance response in ‘Nona Bokra’ ILs developed in two genetic backgrounds. • The ILs with enhanced salt tolerance in both populations will be useful for fine mapping and positional cloning of salt tolerance QTLs. • Since the selected prebreeding lines do not possess any undesirable domestication traits such as tall plant stature, photosensitivity, red pericarp, and awn, these lines can be valuable resource for the rice breeding programs to design salt tolerant varieties in the future. 48 Conclusion
- 50. Case study III 49 Lubbock, TX, USA Pabuayon et al. (2021)
- 51. Phenotypic evaluation of the RIL Population • The RILs of IR29 (Xian/Indica; salt-sensitive) and Pokkali (Aus; salt-tolerant) consisted of 123 individuals as the core QTL mapping population. • 14 day-old seedlings were transplanted to 0.6-gallon buckets with 1 g/L Peter’s Professional 20-20-20 Fertilizer (JR Peters Inc., Allentown, PA, United States) at pH 5.8, supplemented with 0.4 g L-1 FeSO4.7H2O. • Salinity stress at tillering stage (V4 to V12) with EC = 12 dS m-1. • Samples for physiological assays, RNA extraction, and biomass measurements were collected at 0 h (control) and after 24, 48, 72, and 144 h of stress. Materials and methods 3 2 1 Aspects under consideration • Biomass, Stomatal Conductance • Standard Evaluation Score (SES) • Electrolyte Leakage Index • Peroxidase Activity Assay • Lipid Peroxidation Assay • Na+ and K + Quantification • Proline Content • Aggregate Phenotypic Scores (APS) Real-Time Plant Growth Profiling • IR29 (S), Pokkali (T), FL478 (T-RIL), FL510 (ST-RIL), FL454 (S- RIL), and FL499 (SS-RIL) subjected to digital growth profiling with the LemnaTec Scanalyzer 3D platform. • Plants were digitally imaged daily for 18 days with RGB and hyperspectral cameras. • The RGB images were analyzed using PhenoImage (Zhu et al., 2020). • Plant size was initially reported as number of pixel squares, converted into cm2 using the Fiji software (Schindelin et al., 2012). 50
- 52. Transcriptome Profiling by RNA-Seq and Transcriptional Network Modeling Statistical Analysis 2 1 • Total RNA was extracted from frozen leaves of each replicate with the miRVanaTM miRNA Isolation Kit to construct time-course (0, 24, 48, 72, and 144 h) RNA-Seq libraries. • Strand-specific 150-bp paired-end libraries were sequenced twice on Illumina HiSeq3000. • Gene expression clusters were identified and visualized using the “MBCluster.Seq” package in R. • Pearson’s correlation coefficient (PCC) matrix was established for each cluster. • Genetic networks were constructed and visualized using Cytoscape (Smoot et al., 2010). • The annotation applied to RNA-Seq dataset was based on UniProt (The UniProt Consortium, 2018). • Statistical analyses were conducted with R software. • Pearson’s correlation coefficient (PCC) matrices, gene ranks, and mutual ranks for genetic network and PCA were scripted in R-package. • The “ggplot2” package was used for data visualization (Wickham and Chang, 2008). 51
- 53. Table 6: Standard Evaluation Scores (SES) and qualitative phenotypic ranking at vegetative growth/tillering stage 52
- 54. Relatedness Among RILs Based on Physio-Morphometric Matrix 53 Fig. 17: Comparison of plant health in control (C) and stress (S) Fig. 18: Physio-morphometric scores were normalized and combined as Aggregate Phenotypic Score (APS) Fig. 19: Heat map showing the gradients of the normalized physio-morphometric scores across the comparative panel
- 55. Real-time growth profiling Variation in hyperspectral variance Fig. 19: Growth curves as a function of changes in plant area and plant height and plant area Fig. 20: Variation in hyperspectral variance at 243 wavelength bands ranging from 550 to 1,700 nm 54
- 56. Fig. 21: Parallel comparison of transcriptomes across genotype shown for 14,696 unique transcript loci. Network Rewiring in Transgressive Segregants Based on Transcriptome Profiles • The super-tolerant FL510 had the highest number of genes that did not change in expression at EC = 12 dS m-1. • Upregulation in FL510 occurred gradually but progressively compared to others. • In the super-sensitive FL499, only subtle changes occurred during the early stages of stress, but many genes were drastically upregulated or downregulated at 144 h/6-day, coinciding with severe leaf senescence and necrosis. • The tolerant FL478 and sensitive FL454 had large numbers of early, late, sustained, and transiently upregulated and downregulated genes similar to IR29 and Pokkali. 55
- 57. Comparison of transcriptional co-expression networks across parents and their RILs • The OsCML27 profile was most distinct in the super-tolerant FL510 with sustained upregulation. The parents IR29 and Pokkali did not share any cohort genes with any progeny, while only minimal overlaps at best occurred between FL510, FL478, FL499 and FL454. • These trends illustrate the non-additivity (network rewiring) of parental gene expression in the progenies, where outlier trends were evident. The OsCML27 cohorts in FL510 were enriched with salicylic acid (SA) and jasmonic acid (JA) associated genes with sustained upregulation through 144 h. Fig. 22: Comparison of transcriptional co-expression networks across parents and their RILs. 56 OsCML27 OsMT14A27 OsHKT27 OsMPS27
- 58. Hypothetical model of physiological coupling and uncoupling in transgressive segregants • Proposes that the novelties of FL510 and FL499 are due to the coupling in the progeny of the good properties coming from either parent or uncoupling of bad properties from the good properties from the same parent. • On top of the core mechanisms that contribute to a large proportion of phenotypic variance for defense potentials, each parent has their own characteristics that may or may not be beneficial under stress. • Benefit from IR29 would be its superior growth and development potentials. • Pokkali offers many stress defense mechanisms including salt exclusion. • Combining the physiological potentials of parents with the reconfigured (non-parental) properties led to positive or negative coupling and uncoupling effects in RILs. 57 Fig. 23: Hypothetical model of physiological coupling and uncoupling in transgressive segregants for salinity tolerance
- 59. • The phenomenon of transgressive segregation, where a small minority of recombinants are outliers relative to the range of parental phenotypes, is commonly observed in plant breeding populations. • By systems-level profiling of the IR29 × Pokkali recombinant inbred population of rice, the hypothesis that novel salinity tolerance phenotypes are created positive or negative coupling-uncoupling of developmental and physiological attributes of each parent. • Real-time growth and hyperspectral profiling distinguished the transgressive individuals in terms of stress penalty to growth. • Non-parental network signatures that led to either optimal or non-optimal integration of developmental with stress-related mechanisms were evident at the macro-physiological, biochemical, metabolic, and transcriptomic levels. • This study also supports a breeding paradigm rooted on genomic modeling from multi-dimensional genetic, physiological, and phenotypic profiles to create novel adaptive traits for new crop varieties of the 21st century. Conclusion 58
- 60. Seminar conclusion • Harmonizing the high throughput techniques for phenomics and genomics is both a challenge and opportunity. • There is no replacement of the conventional breeding, but its limitations in terms of speed and accuracy can be overcome by molecular breeding programmes. • The conventional phenotyping and breeding approaches are sound, the advantages and opportunities thrown open by automated phenotyping should be availed for faster gains. • Since modern genotyping protocols are well developed and high throughput in rice, phenotyping models need more consideration because capturing “right QTL” largely depends upon right phenotyping. • In molecular breeding for salinity tolerance, initial success has been made by the discovery of many QTLs and several rice salinity GWAS reports, but still there is a considerable gap between knowledge discovery and actual use of molecular breeding in realization of field oriented salt tolerant rice varieties. • Stage-specific and stress-specific QTLs may be identified for need based deployment for which, the screening methodology should be simple and high throughput, reproducible and representative of near-field conditions. 59
- 61. Thank You
Editor's Notes
- © Copyright PresentationGO.com – The free PowerPoint and Google Slides template library
- © Copyright PresentationGO.com – The free PowerPoint and Google Slides template library