Conflict-free dynamic route multi-agv using dijkstra Floyd-warshall hybrid a...
Kozey et al_2016
1. A low-cost alternative for higher capacities at four-way
signalized intersections
Peter Kozey a,⇑
, Yiguang Xuan b
, Michael J. Cassidy c
a
HNTB Corp., 1301 Fannin St, Suite 1800, Houston, TX 77002, United States
b
FactSet Research Systems Inc., 90 Park Ave, 11th Floor, New York, NY 10016, United States
c
416c McLaughlin Hall, University of California, Berkeley, CA 94720, United States
a r t i c l e i n f o
Article history:
Received 21 January 2016
Received in revised form 4 August 2016
Accepted 24 September 2016
Keywords:
Intersection capacity
Traffic signalization
Intersection design
a b s t r a c t
Protecting left-turn movements on all four approaches to a signalized intersection
conventionally requires a minimum of two extra phases per cycle. Losses in capacity often
result. Various intersection designs have been proposed to combat those losses. Perhaps
the best known of these designs is the continuous flow intersection. It features specially-
configured approach lanes and mid-block pre-signals. These enable opposing left-turn
and through-moving vehicles to proceed through the intersection free of conflicts, and
without need for additional protected-turn phases.
The present paper offers an alternative design for four-way intersections, which to our
knowledge has not previously been proposed. The design furnishes lower capacities than
do continuous flow intersections, but spares the expense of having to reconfigure approach
lanes. Pre-signals store queues and route traffic through the intersection much as in a con-
tinuous flow design. The distinguishing feature of the alternative is that it enables all four
turn movements to be served during a single protected phase. Only one additional phase is
therefore required per cycle. Numerical analysis shows that the plan regularly achieves
higher intersection capacities than do conventional designs. Capacity gains as high as
80% are predicted. The proposed design is rather mentally taxing to drivers. Hence, oppor-
tunities for deploying the design in real settings are discussed with an eye toward the more
connected and automated driving expected in the future.
Ó 2016 Elsevier Ltd. All rights reserved.
1. Introduction
Signalized intersections with sufficiently high demands often come with protected turn phases (e.g. Newell, 1989). Where
driving occurs on the right as in the US, it is the left-turns that usually require protection. This is conventionally achieved by
displaying a left-turn phase concurrently with either: the through phase for the same approach; or a protected left-turn
phase for the opposing approach (e.g. Webster, 1958; Rodegerdts et al., 2004). Either way, the signal must as a result display
more than two phases each cycle. Additional phases mean more change intervals and greater lost times (e.g. Greenshields
et al., 1947; Koonce et al., 2008). And in commonly-occurring cases in which an intersection has fewer turn lanes than
through ones, protected left-turn phases likely serve lower discharge flows; see Xuan et al., 2011. The resulting losses in
intersection capacity can create or exacerbate residual queues on high-demand approaches, with delays that may steadily
increase over time.
http://dx.doi.org/10.1016/j.trc.2016.09.012
0968-090X/Ó 2016 Elsevier Ltd. All rights reserved.
⇑ Corresponding author at: 3310 Louisiana St Apt 2124, Houston, TX 77006, United States.
E-mail addresses: pkozey989@gmail.com (P. Kozey), xuan.yiguang@gmail.com (Y. Xuan), cassidy@ce.berkeley.edu (M.J. Cassidy).
Transportation Research Part C 72 (2016) 157–167
Contents lists available at ScienceDirect
Transportation Research Part C
journal homepage: www.elsevier.com/locate/trc
2. One creative solution entails a continuous flow design (Al-Salman and Salter, 1974), as depicted for two opposing inter-
section approaches in Fig. 1. While the intersection’s signal is red for those approaches, pre-signals (upstream of the inter-
section) display greens. These pre-signals allow left-turners to enter special pockets situated on the approaches’ extreme
left-hand sides. Note from Fig. 1 how the opposing left-turns are protected from conflicts when eventually given greens
at the intersection. And since these left-turners enter the intersection together with the parallel through-moving traffic in
both directions, protection is achieved without additional phases and the attendant losses in capacity.
The design can be deployed: on only two opposing intersection approaches as in Fig. 1, when higher capacities are needed
in those directions alone; or on all four approaches, when demands are high in all directions. On the downside, the design
cannot be turned on and off to accommodate time-varying demands over a day. Once the required alternations are deployed
on opposing approaches, they must operate in the continuous flow mode all day long, day after day. And since said alter-
ations include substantial reconfigurations to the approach lanes, deployment can be expensive; see Goldblatt et al., 1994.
Moreover, the design introduces certain complications to the driving task. In addition to the unorthodox maneuvering
required of left-turners as they approach the intersection, note from Fig. 1 the zig-zag-like movements to be performed
by through-moving vehicles as they discharge. Right-turners on perpendicular approaches, moreover, must avoid the special
left-turn pocket(s) at the intersection and thereafter pursue zig-zag paths as well. Yet, these complications have not pre-
vented continuous flow intersections from being deployed in real settings (Hughes et al., 2009). This suggests that traffic
engineers (and society) are willing to tolerate unconventional designs in exchange for greater capacities at high-demand
intersections.
With the above considerations in mind, the present paper offers another alternative to protect turn movements at four-
way intersections, one not previously conceived of. Much like the continuous flow design (e.g. Al-Salman and Salter, 1974)
and other designs (e.g. Xuan et al., 2011, 2012; Guler and Cassidy, 2012), the proposed plan features mid-block pre-signals to
store queues and re-route certain movements through the intersection. The design does so in ways that enable left-turn
movements in all four directions to discharge together during a single protected phase. Because that one extra left-turn
phase is required, the plan tends to furnish lower capacities than do continuous flow intersections, particularly when all four
approaches operate in continuous flow fashion. But the proposed design does not require costly realignments of the
approach lanes, and can be turned on and off over the course of a day to suit an intersection’s time-varying needs for added
capacity.
The design is described in the following section. Capacity models are formulated thereafter and numerical analysis shows
that the proposed plan regularly outperforms conventional signal designs, often by large amounts. The paper concludes with
discussion on how the plan might be deployed to fill certain niches, particularly as advances in connected and automated
vehicle technologies may render the vehicle maneuverings required of the plan less taxing on drivers and enhance safety
to boot.
2. The plan and its workings
Where driving occurs on the right, the problem is that left-turns on one approach to a four-way intersection conflict with
their counterparts on perpendicular approaches. To wit, the dashed arrows in Fig. 2a delineate the paths of left-turners as
they negotiate an intersection. Resulting conflict areas are highlighted with cross-hatching.
Fig. 1. Continuous flow intersection on two approaches. Arrows depict the movements allowed during the (single) green phase for those approaches.
Figure taken from Xuan et al. (2011).
158 P. Kozey et al. / Transportation Research Part C 72 (2016) 157–167
3. The conventional solution entails a signal design like the one in Fig. 2b. The solution never allows more than two distinct
left-turn movements to occur at any one time, and this only for left-turns on opposing approaches to avoid conflict.
The plan now proposed is to shorten the radii of those left-turn paths in Fig. 2a in the manner delineated by the dashed
arrows in Fig. 3a. Note the resulting absence of conflicts. Further note how this adjusting of paths facilitates the signal design
illustrated in Fig. 3b. Its unorthodox phase, labeled phase 1 in the figure, simultaneously serves all left-turns in protected (i.e.
non-conflicted) fashion. Discharge flows served during that phase would be higher than (possibly double) the discharge rates
in each conventional turn phase in Fig. 2b; i.e. phases (1) and (4). And since all lefts are served in a single phase, the proposed
plan enjoys one less phase per cycle than does the conventional design.
Complications occur because left-turn paths are adjusted by focusing those vehicles onto lanes that are also used by con-
flicting through movements; see again Fig. 3a. The choreography required of vehicles is rather intricate and is orchestrated
primarily by pre-signals. Operations over a single cycle are described below with the aid of Fig. 4.
Phase i = (1) (2
(a)
(b) ) (3) (4)
Fig. 2. Conventional intersection design. (a) left-turn paths; (b) example signal plan.
P. Kozey et al. / Transportation Research Part C 72 (2016) 157–167 159
4. 2.1. Details
Prior to the display of the intersection’s 4-way left-turn phase, pre-signals display reds, such that queues of through- and
left-turning vehicles form separately upstream; note the white boxes with accompanying labels in Fig. 4.1
Pre-signals
Phhase i = (1)
(a)
(b)
(2) (3)
Fig. 3. Proposed plan. (a) altered left-turn paths; (b) proposed signal plan.
1
Further note from the figure how queues of left-turn vehicles can be stored upstream of the pre-signals when the streets come with medians. Readying
those medians for the proposed plan would require modest cost when the medians are elevated, landscaped or otherwise unpaved. The plan also requires that
road space be available upstream of the pre-signals to store the vehicle queues that form there. When that space is limited, the plan can often still be deployed,
but with upper bounds on cycle lengths to keep the pre-signals’ queues to manageable lengths. The matter has already been addressed for a distinct use of pre-
signals in Xuan et al., 2011.
160 P. Kozey et al. / Transportation Research Part C 72 (2016) 157–167
5. thereafter award greens to the queued left-turn vehicles, thus enabling them to fill the turn pockets downstream. The other
pre-signals direct through-moving traffic. Those in the median lanes remain for a time red, so that the downstream portions
of those lanes are temporarily kept empty. Call these empty lane portions ‘‘chambers”.
When the intersection’s 4-way left-turn phase is eventually displayed, turning vehicles are directed into the chambers, as
previously shown in Fig. 3a.2
Note from Fig. 4 that vehicles traversing a chamber are flanked to the right by a queue of left-
turners discharging toward the intersection. Those left-turners therefore discharge in opposing directions to the chambered
ones.
Chambered vehicles ultimately exit the chamber by maneuvering around the tail of the adjacent discharging queue of
left-turners, and merging into suitable travel lanes to the right; see the arrows labeled ‘‘chamber ends” in Fig. 4. The tail
of a discharging left-turn queue recedes toward the intersection over time. Hence, successive exit maneuvers from a cham-
ber can take place at locations that reside closer and closer to the intersection. Those vehicles served near the end of the turn
phase can therefore exit a chamber soon after having entered it. A chamber can as a result, be cleared promptly of left-turn
traffic in anticipation of the next signal phase. Illuminated pavement markings and other technologies could help guide left-
turners into and out of their chamber, as will be discussed in Section 5.
Recall that next phase serves through-moving vehicles in two opposing directions; see again Fig. 3b. Those green times
are initiated at the same time as those of the pre-signals that control through-moving and left-turning traffic on all
approaches. A sizable lost time is incurred during the second phase’s change interval because at least some through-
moving vehicles must traverse the chambers before discharging into the intersection. The cycle’s third and final phase serves
the remaining through movements in conventional fashion because pre-signals allow vehicles to form queues at the inter-
section during the previous phase. Offsets between the signal’s phases at the intersection and those of the upstream pre-
signals will be further discussed in the following section.
2
Also note from Fig. 4 how pre-signals can hold through-moving queues in shoulder lanes a short distance upstream of the intersection. This can make it
easier for large-sized left-turn vehicles (e.g. trucks) in conflicting lanes to execute their maneuvers. The modest extra lost time thusly created in the shoulder
lanes is neglected. As a separate aside, right turns can also be served during phase 1, geometry permitting, also as shown in Fig. 4.
Phase 1
Pre-signals
Chamber ends
Le -turn and through-
moving queues
Fig. 4. Depiction of left- (and any right-) turn movements during phase 1 of proposed plan.
P. Kozey et al. / Transportation Research Part C 72 (2016) 157–167 161
6. 3. Capacity formulas
We start with some well-known capacity equations for conventionally-designed intersections. From these we derive
more elaborate formulas that apply to the proposed plan. Signals are assumed to operate in pre-timed fashion with phase
sequences, green times and cycle lengths known. The assumption of pre-timed operation is conservative, since vehicle-
actuated control could be deployed in ways that diminish lost times, including some relatively large losses incurred by
the proposed plan; see Newell (1989).
Our interest lies in estimating capacities, as opposed to delays or levels of service for example. This makes sense since the
real value of the proposed design is to increase capacity at busy intersections. It will therefore be assumed that all signal
phases are fully saturated; i.e. that no queue in any lane dissipates in the midst of its green time. Reasonably assume as well
that a conversion from a conventional design to the proposed one does not alter the number of lanes available to serve
through and left-turning movements. To limit dimensionality, assume that average discharge (i.e. saturation) headway
per lane, denoted hs, is the same for all movements and phases. Assume too that vehicle speed in a discharging queue, vs,
is similarly invariant. One or two other modest assumptions will be adopted in due course.
3.1. Conventional designs
Denote as mi the maximum number of vehicles that can, on average, be served per lane during phase i. That number is
(Gi À Li)/hs, where Gi is the duration of phase i, Li is the attendant lost time, and the difference between the two is commonly
referred to as the effective green time; e.g. see Newell (1989).
Denote as E(M) the expected maximum number that can be served during a 4-phase cycle as in Fig. 2b. It is:
EðMÞ ¼
X4
i¼1
Ni Á mið Þ ð1Þ
where Ni is the number of lanes available to discharging vehicles during phase i. Intersection capacity, Q, can be expressed as
E(M) divided by the signal’s cycle length.
3.2. Proposed plan
We now derive capacity equations given the proposed phase design in Fig. 3b. Recall that protected left-turns are served
in phase 1, such that m1 is the maximum number that can, on average, discharge from a left-turn pocket during that first
signal phase. Assume that the turn pocket on each approach shares the same physical length, DL. (In this way, phase 1
can be fully saturated, as per the earlier stipulation.)
Recall that pre-signals control entries to these turn pockets downstream; see again Fig. 4. The green times of those pre-
signals terminate each cycle prior to the start of signal phase 1. Consequently, length DL should be the product of m1 and the
jam vehicle spacing. The expected time required to traverse the turn pocket, T, is therefore DL/vs.
Note from Fig. 4 that each chamber has that same physical length, DL. Also recall that pre-signals allow through-moving
vehicles to fill each chamber. The greens displayed by those pre-signals may terminate after the start of through-movement
greens at the intersection; i.e. during phases 2 and 3.
Consider now the offset, denoted d, and defined to be the difference between the times of green terminations for through-
moving vehicles as displayed by the intersection’s signal, ts, and by the pre-signal upstream, tp; i.e. d ¼ ts À tp. This d should
be sufficiently large to flush all through-moving vehicles from their chambers by the ends of phases 2 and 3. This is because a
residual queue in any one chamber would block the left-turn movements targeted for that chamber during ensuing phase 1,
as evident in Fig. 4. Since discharge headways vary across drivers, we look for a suitable d > T in an effort to accommodate
through-moving drivers who discharge a chamber sluggishly, but seek to do so without creating added lost times that are
unduly large.
To this end, denote as pðd) the probability of a residual queue forming in a chamber. Assume that discharge headways are
independent and normally-distributed, such that:
pðdÞ ¼ Pr Á ðhf mf dÞ ¼ Pr: hf
d
mf
¼ U
hs À d
mf
rffiffiffiffiffimf
p
!
ð2Þ
where
hf = average discharge headway observed of through vehicles as they are flushed from a chamber subsequent to a time tp;
i.e. the average headway of those vehicles that exit the chamber during an offset period.
mf = expected number of those vehicles, T/hs; and
r = standard deviation of discharge headways.
The d is obtained by balancing two expected added lost times per cycle. One occurs in a fully-flushed chamber as a result
of setting d T; and the other in a left-turn lane when its target chamber is not flushed of all its through vehicles. The former
162 P. Kozey et al. / Transportation Research Part C 72 (2016) 157–167
7. is ½1 À pðdÞŠ Á ½d À TŠ. The latter is pðdÞ Á ½GL À LŠ which occurs because a residual queue that forms inside a chamber would
block a left-turn movement for all of phase 1.
The expected sum of both added lost times per cycle for each chamber is denoted as F, and the d is obtained via a gradient
search to minimize that F; i.e.:
min
d
F ¼ FÃ
¼ ½1 À pðdÞŠ Á ½d À TŠ þ pðdÞ Á ½GL À LŠ ð3Þ
Now consider the expected maximum number of vehicles served each cycle under the proposed plan, denoted E(MP
). The
proposed design would presumably be deployed at an intersection by converting it from a conventionally-designed one. In
light of this, a formula for E(MP
) is obtained by suitably adjusting the E(M) given in (1). To keep the formulation simple, sup-
pose that the original (i.e. conventional) intersection has the phase design shown in Fig. 2b. For the proposed design, the
phase sequence in Fig. 3b will continue to be used. Further suppose for the sake of simplicity that all phase durations for
left-turns are identical under the conventional and proposed plans; i.e. that G1 = G4 = G1
P
.
The change in the maximum number of vehicles served under the proposed plan can therefore be expressed as
NiÁ(Gi
P
À Gi)/hs during phase i = 2 and 3 minus the lost times including what has been denoted F⁄
and due to some
through-moving vehicles traversing an empty chamber before entering the intersection during phase 2. Consideration shows
that:
E MP
¼ EðMÞ þ
X3
i¼2
Ni Á GP
i À Gi
À ni Á FÃ
h i
À n2 Á T
( )
=hs ð4Þ
where ni is the number of chambers used to discharge through-moving vehicles during phase i = 2, 3, and n2 is the number of
chambers used in phase 2. Intersection capacity under the proposed plan, QP
, can therefore be expressed as E(MP
) divided by
cycle length.
4. Numerical analysis
We will now compare the capacities for a set of conventionally-designed intersections, and their conversions to the pro-
posed plan. The intent is to give the reader some sense of the proposed design’s capacity-improving potential via the para-
metric analyses of certain narrowly-focused settings. Thus, continue to assume that (i) all phases are fully saturated with the
length of the left-turn pocket determined to achieve this; and (ii) a conversion to the proposed plan does not alter the num-
ber of lanes available to each movement.
It is further assumed that all cases entail a single left-turn lane on each approach. Multiple left-turn lanes are possible
with the plan (i) provided that there are sufficient through-moving lanes on conflicting approaches to serve as chambers;
and (ii) require additional maneuvering of vehicles to exit a chamber; see Fig. 3a. The number of through lanes per approach
will be varied from 1 to 3. To limit dimensionality, it will be assumed that all approaches to an intersection share the same
number of through-moving lanes.
All conventionally-designed intersections will continue to take the phase sequence of Fig. 2b, and conversions the
sequence of Fig. 3b. In all cases, we continue to assume that G1 = G4 = G1
P
and will now denote that phase duration as GL. Cer-
tain symmetries will also be assumed of the green times for through movements, namely that G2 = G3 (now denoted GT) and
that G2
P
= G3
P
(henceforth denoted GT
P
). Cycle lengths for the conventional and proposed schemes, C and CP
, respectively, are
therefore given by:
C ¼ 2GL þ 2GT ð5Þ
CP
¼ GL þ 2GP
T ð6Þ
It will further be assumed that in all cases CP
6 C, since CP
is advantageously composed of one less phase than is C.
Through-moving phases under the proposed plan, phases 2 and 3, will reap any phase extensions, subject to the limit that
GT
P
6 GT + GL/2.
Parameter values used in the analyses were obtained from Newell (1989) and Li and Prevedouros (2002). They are sum-
marized in Table 1.
As regards F⁄
, Eq. (3) reveals that this lost time increases with increasing allocation of green time to turning traffic. This is
reasonable: longer left-turn greens mean, among other things, greater lost times when residual queues form in a chamber. In
Table 1
Selected parameter values.
Variable Symbol Assumed value
Conventional lost time per phase L 5.0 s
Vehicle jam spacing sj 7.6 m/veh
Average saturation headway hs 2.0 s
Vehicle discharge speed vs 11 m/s
Headway standard deviation r 0.5 s
P. Kozey et al. / Transportation Research Part C 72 (2016) 157–167 163
8. light of this, the optimal offset is solved for as a function of GL via a gradient search to numerically estimate discrete values of
F⁄
at 1-s intervals.
Outcomes are shown by the square-shaped data points in Fig. 5. A best-fit linear approximation, also shown in the figure,
will be used to estimate the F⁄
in the analyses to come.
F* = 0.06GL + 0.60
R² = 0.99
0
1
2
3
4
15 20 25 30 35 40
LostƟme,F*(sec)
LeŌ-turn phase, GL (sec)
Fig. 5. Estimates of F⁄
as a function of GL and linear approximation.
(a)
(b)
(c)
15
20
25
30
35
40
15 20 25 30 35 40 45 50 55 60 65 70
GL (sec)
GT (sec)
15
20
25
30
35
40
15 20 25 30 35 40 45 50 55 60 65 70
GL (sec)
GT (sec)
1.1 – 1.2
1.2 – 1.3
1.0 – 1.1
15
20
25
30
35
40
15 20 25 30 35 40 45 50 55 60 65 70
GL (sec)
GT (sec)
1.2 – 1.3
1.1 – 1.2
1.0 – 1.1
1.3 – 1.4
1.1 – 1.2
1.0 – 1.1
1.2 – 1.3
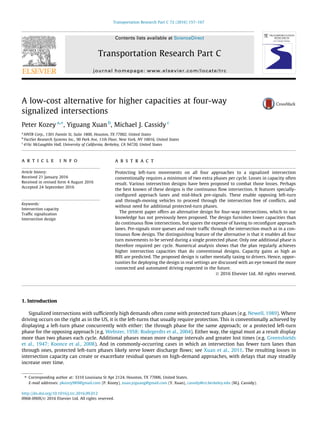
Fig. 6. Predicted R when GT ¼ GP
T. (a) NT = 4; (b) NT = 8; (c) NT = 12.
164 P. Kozey et al. / Transportation Research Part C 72 (2016) 157–167
9. 4.1. Case 1: GT = GT
P
The first round of comparisons will be drawn for a set of intersections in which the phases for through movements are the
same for each original, conventionally-designed intersection (e.g. see again Fig. 2a) and its converted counterpart (e.g.
Fig. 3a). Since GL is also the same across both design schemes, then C À GL ¼ CP
in this case.
Fig. 6a presents outcomes for ranges of GT and GL, and where each intersection approach has only a single lane for through
traffic; i.e. NT = 4. The numeric values annotated in the figure denote R, the ratio of the capacity under the proposed plan to
the conventional one; i.e. R = QP
/Q. Fig. 6b and c present outcomes where NT = 8 (2 through lanes per approach) and where
NT = 12 (3 lanes per approach).
Note from all three figures how R increases as the ratio of GL/GT increases. This pattern unveils how the elimination of one
turn phase can become especially beneficial when turning demand is relatively large; i.e. simultaneously serving these large
demands in all four directions trumps serving them two directions at a time. Further notice how R can be especially large
when NT is large. This is because the lost times created by a chamber have lesser impact when the number of through lanes
without chambers is large.
4.2. Case 2: C = CP
Final comparisons are drawn for intersections in which GT
P
= GT + GL/2, such that C = CP
. Fig. 7a–c present outcomes of
parametric analysis where NT = 4, 8 and 12, respectively.
Visual comparison across these figures reveals that for given GT, the R increases as GL increases. This makes sense, since
greater GL means in this case greater GT
P
and CP
. The longer cycle diminishes the negative impact of lost times, which renders
the added losses of the proposed plan less damaging. Notice too how capacity gains become greater as NT grows large; i.e.
(a)
(b)
(c)
15
20
25
30
35
40
15 20 25 30 35 40 45 50 55 60 65 70
GL (sec)
GT (sec)
1.0 – 1.1
15
20
25
30
35
40
15 20 25 30 35 40 45 50 55 60 65 70
GL (sec)
GT (sec)
1.0 – 1.1
1.5 – 1.6
15
20
25
30
35
40
15 20 25 30 35 40 45 50 55 60 65 70
GL (sec)
GT (sec)
1.1 – 1.2
1.7 – 1.8
1.0 – 1.1
Fig. 7. Predicted R when C = CP
. (a) NT = 4; (b) NT = 8; (c) NT = 12.
P. Kozey et al. / Transportation Research Part C 72 (2016) 157–167 165
10. allocating more GT
P
can be especially productive when through traffic can discharge via many lanes. Thus we see from Fig. 7c
that conversions to the proposed plan can improve capacities by as much as 80% when NT = 12.
4.3. Summary
The following summary of findings is offered for the reader’s convenience.
1. The proposed design furnishes higher capacities for all cases studied.
2. Capacity gains are greater when the duration of the left-turn phases increase relative to those of the through-moving
phases. This underscores the benefit of eliminating a left-turn phase when turning demands are high.
3. Capacity gains are also higher when the intersection has a larger number of through-moving lanes. This is because the lost
times that occur due to the design’s unorthodox way of processing left-turn movements (see again Sections 2.1 and 3.2)
are diluted when more through lanes are present.
4. The proposed design can furnish particularly large capacity gains when cycle lengths and green times are large. This comes
as no surprise; i.e. the longer durations dilute the effects of lost time, just as they do for conventional signal designs.
5. Conclusions
The proposed plan’s key innovation lies in serving the left-turns on all four approaches to an intersection during a single
protected phase. Because that extra phase is required of the plan, its added capacity is typically less than what can be
achieved by a continuous flow design. Yet by avoiding extensive reconfigurations of the approach lanes, the plan can often
be deployed at lower costs. Caveats are in order here, in that intersections best suited for conversion would come with cer-
tain amenities, including usable medians and space for storing the vehicle queues that would form upstream of pre-signals.
These issues notwithstanding, we suspect that the proposed plan could be made to fit the street geometries at a good many
intersections.
This is encouraging, given that the present analyses indicate that conversions would often bring appreciably higher inter-
section capacities. Gains as high as 80% were predicted within a range of selected signal phasing constraints. These analyses
were idealized in that they assumed fully-saturated green phases and other symmetries. In this sense, the analyses borrowed
a page from Xuan et al. (2011) in its approach to predict the added intersection capacities brought by a use of pre-signals.
(The pre-signals in the above-cited reference were used in distinctly different ways than presently proposed.) Few, if any, of
these idealizations occur in real settings. Still, the present analyses offer upper bounds to illustrate the plan’s possible ben-
efits. Whatever complications might arise from non-symmetries in street geometry would, in most cases, be of modest con-
cern. Directionally-imbalanced demands might require attention under the proposed plan, much as they do under
conventional designs. In both cases, signalization can resort to so-called overlapping or protected-permitted signal phasing
(e.g. Newell, 1989; Koonce et al., 2008). The difference is that with the proposed plan, these signal adaptations would further
complicate what are already complicated driver requirements.
To be sure, intersections operating under the proposed plan should be replete with roadway lighting systems, electronic
signing and possibly other technologies to guide drivers through their required maneuvers. And making the plan work would
require resolution of a good many details, including those involving driver compliance with a host of new rules; e.g. to seg-
regate themselves by maneuver-type in advance of an intersection, and to refrain from changing lanes on the portion of an
approach residing between the pre-signals and the intersection itself. Gracefully turning the plan on and off over the course
of a day would require attention to detail as well.
In light of all these considerations, perhaps the plan will not be seen as a promising solution for present-day roadways.
Yet the plan is less a proposal for the current state of affairs than an idea for the future, a future in which connected
and automated driving appears close on the horizon (e.g. Siva, 2013; Litman, 2016). Vehicle-to-vehicle and
vehicle-to-infrastructure communications would surely lesson the mental burden on drivers as they negotiate intersections
operating under the proposed plan, as would more automated (e.g. driverless) cars. And given that these vehicle technologies
promise to bring higher road capacities in their own right, why not complement these technologies with infrastructure
systems that are better designed to suit them? After all, a suitable matching of infrastructure to emerging vehicle type could
bring about huge gains in intersection capacities, to diminish traveler delays and their attendant externalities as well.
Acknowledgements
Partial funding for the present work came from UCCONNECT, the University Transportation Center for region 9.
References
Al-Salman, H.S.T., Salter, R.J., 1974. The control of right turning vehicles at signal controlled intersections. Traffic Eng. Control 15 (15), 683–686.
Goldblatt, R., Mier, F., Friedman, J., 1994. Continuous flow intersection. Inst. Transport. Eng. J. 64 (7), 35–42.
Greenshields, B.D., Shapiro, D., Ericksen, E.L., 1947. Traffic Performance at Urban Intersections, Technical Report No. 1. Bureau of Highway Traffic, Yale
University.
Guler, S.I., Cassidy, M.J., 2012. Strategies for sharing bottleneck capacity among buses and cars. Transp. Res. Part B 46, 1334–1345.
166 P. Kozey et al. / Transportation Research Part C 72 (2016) 157–167
11. Hughes, W., Jagannathan, R., Bared, J., 2009. Displaced Left-Turn Intersection. Federal Highway Administration, Washington, DC. Report FHWA-HRT-09-055.
Koonce, P., Rodegerdts, L.A., Lee, K, Quayle, S., Beaird, S., Braud, C., Bonneson, J., Tarnoff, P., Urbanik, T., 2008. Traffic Signal Timing Manual. Federal Highway
Administration, Washington, DC. Report FHWA-HOP-08-024.
Li, H., Prevedouros, P.D., 2002. Detailed observations of saturation headways and start-up lost times. Transp. Res. Rec. 1802, 44–53.
Litman, T., 2016. Autonomous Vehicle Implementation Predictions: Implications for Transport Planning. Victoria Transport Policy Institute, Victoria, British
Columbia.
Newell, G.F., 1989. Theory of Highway Traffic Signals. Course Notes. University of California at Berkeley Institute of Transportation Studies. UCB-ITS-CN-89-
1, 442p.
Rodegerdts, L.A., Nevers, B., Robinson, B., Ringert, J., Koonce, P., Bansen, J., Nguyen, T., McGill, J., Stewart, D., Suggett, J., Neuman, T., Antonucci, N., Hardy, K.,
Courage, K., 2004. Signalized Intersections: Informational Guide. Federal Highway Administration, Washington, DC. Report FHWA-HRT-04-091.
Siva, R.K. Narla, 2013. The evolution of connected vehicle technology: from smart drivers to smart cars to. . . self-driving cars. ITE J., 21–26
Webster, F.V., 1958. Traffic Signal Settings. Road Research Lab Technical Paper No. 39.
Xuan, Y., Li, Y., Daganzo, C.F., Cassidy, M.J., 2011. Increasing the capacity of signalized intersections with separate left turn phases. Transp. Res. Part B 45
(2011), 769–781.
Xuan, Y., Gayah, V., Cassidy, M.J., Daganzo, C.F., 2012. Pre-signal used to increase bus- and car-carrying capacity at intersections: theory and experiment.
Transp. Res. Rec. 2315, 191–196.
P. Kozey et al. / Transportation Research Part C 72 (2016) 157–167 167