More Related Content
Similar to Portfolio 0216 q3 20 (20)
Portfolio 0216 q3 20
- 1. 0
50
100
150
200
250
300
350
400
0
20
40
60
80
100
120
140
160
180
200
2/1/2016 8/1/2016 2/1/2017 8/1/2017 2/1/2018 8/1/2018 2/1/2019 8/1/2019 2/1/2020 8/1/2020
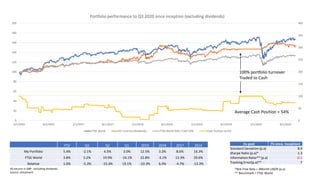
Portfolio performance to Q3 2020 since inception (excluding dividends)
FTSE World PC Fund (ex-dividends) FTSE World 50% / Cash 50% Cash Position as (%)
100% portfolio turnover
Traded to Cash
Ex-post (% since. Inception)
Standard Deviation (p.a) 8.9
Sharpe Ratio (p.a)* 1.3
Information Ratio** (p.a) -0.1
Tracking Error(p.a)** 7
Average Cash Position = 54%
All returns in GBP, excluding dividends
Source: eVestment
*Risk Free Rate = 3Month LIBOR (p.a)
** Benchmark = FTSE World
YTD Q3 Q2 Q1 2019 2018 2017 2016
My Portfolio 5.4% -2.1% 4.5% 3.0% 12.5% 3.3% 8.6% 16.3%
FTSE World 3.8% 3.2% 19.9% -16.1% 22.8% -3.1% 13.3% 29.6%
Relative 1.6% -5.3% -15.4% 19.1% -10.3% 6.4% -4.7% -13.3%
- 2. Current Holdings
MICROSOFT (~£ )
FACEBOOK CLASS A (~£ )
BOOKING HOLDINGS (~£ )
VOLKSWAGEN (~£ )
MCDONALDS (~£ )
PEARSON (~£ )
ANHEUSER-BUSCH INBEV (~£ )
ETSY (~£ )
IRON MOUNTAIN (~£ )
CISCO SYSTEMS (~£ )
MONGODB A (~£ )
-10%
-5%
0%
5%
10%
15%
20%
25%
30%
35%
40%
45%
Current Stocks Holding Period Return to Q32020
- 3. -40%
-20%
0%
20%
40%
60%
80%
100%
Historic Holdings Holding Period Return (excluding dividends)
Average holding period return = 21%
Renishaw
Sirius
minerals Match Wells Fargo Facebook Volkswagen Shell
Seeing
Machines Microsoft Paypal Disney Linkedin
Revolution
Bars Twitter Barrick Gold Carnival
Gilead
Sciences CVS Health Tilray
Entry 01/11/2018 01/08/2016 01/02/2018 01/03/2016 01/08/2018 01/03/2016 01/02/2016 01/08/2016 01/09/2017 01/06/2016 01/08/2018 01/06/2016 01/07/2017 01/10/2017 01/03/2020 01/03/2020 01/04/2020 01/03/2020 01/03/2020
Sold 01/10/2019 01/04/2018 01/05/2018 01/07/2019 01/10/2019 01/12/2016 01/08/2016 01/10/2019 01/06/2018 01/03/2017 01/07/2019 01/06/2016 01/08/2017 01/08/2018 01/06/2020 01/06/2020 01/06/2020 01/08/2020 01/08/2020
Months Held 28 51 7 101 36 23 15 96 23 23 28 0 3 25 8 8 5 13 13
Holding Period Return (excluding
dividends) -20.95% -2.99% -2.02% 8.14% 14.38% 5.30% 4.76% 10.02% 32.17% 14.30% 30.35% 2.98% 65.18% 77.50% 48.97% 73.10% -0.29% 15.99% 73.22%