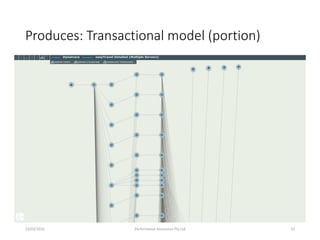
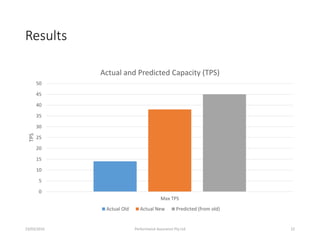
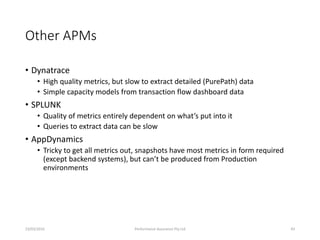
2. A local (Delft train station bike parking) SLA!
What happens if it is violated??
23/03/2016 Performance Assurance Pty Ltd 2
3. Performance modelling background
• My background is analysis of distributed systems, middleware, GRID,
architecture, performance, benchmarking (e.g. SPECjAppServer),
sensor web performance, etc
• Since 2007 project in NICTA to develop tools to assist systems of
systems to perform better in advance
• Service Oriented Performance Modelling tool
• Model driven (SOA performance meta model)
• GUI
• Simulation for metric prediction
• Enables modelling at level of workloads, composite and simple services,
servers.
• Used during early, middle, later lifecycle for lots of real systems
23/03/2016 Performance Assurance Pty Ltd 3
4. Performance modelling background
• BUT Manual model building (structure, parameterisation, calibration) is
• Time consuming
• Expensive
• Error prone
• Limited to model complexity that can be built manually
• Not easily repeatable or maintainable
• Not accurate enough for some problems (need high quality and quantity of
performance data)
• Not fast enough for agile development
• Last 3 years we have been a start up company, have to make $$$$$$
• Most customers have APM products
• Solution is to use automatic model building from APM data
• Cheaper and faster and more accurate
• Solves new problems, e.g. DevOps
23/03/2016 Performance Assurance Pty Ltd 4
5. Automatic performance modelling from APM
data
• Only use APM data
• Use automatable (or potentially automatable) ways of getting the
data from the APM into our Service Oriented Performance Modelling
(SOPM) modelling/simulation tool (SaaS)
• Automatically build and parameterise the performance data from the
APM data
• Multiple model types with various trade-offs, accuracy for
capacity/response times, and model complexity/ability to change
model aspects
• Currently different model types are produced as part of the APM ->
modelling tool transformation phase
23/03/2016 Performance Assurance Pty Ltd 5
20. Goal
• For each application can we predict the performance, scalability, and
resource requirements
• Before moving to virtualised servers
• With only APM data from normal use of the application on physical servers
• Taking into account possible changes including workloads, architecture,
deployment
• Tried with one application first
23/03/2016 Performance Assurance Pty Ltd 20
21. Process
• Take 1st application
• Install APM on old servers (single server)
• Run load tests, determine maximum capacity
• Build model, compare results with load tests
• Repeat for new virtualised platform (single VM)
• Calibrate models from load test results
• Compare with reality
23/03/2016 Performance Assurance Pty Ltd 21
23. Simple in theory, complications:
• Metric breakdowns (user CPU, system CPU/IO, wait, sync,
suspension)
• Simplification in calibration (average vs transactional)
• Tuning/configuration of application & database
• Virtual machine resources
23/03/2016 Performance Assurance Pty Ltd 23
24. Project 2
• Large mission critical application
• Migration to Web-based
• Migration to in-house virtualised servers
• Testing (functional only) done on Amazon EC2
• Tight/hard deadline for capacity planning to ensure adequate but not too
many servers available for switch on date
• Couldn’t run load tests
23/03/2016 Performance Assurance Pty Ltd 24
26. Production on in-house servers
23/03/2016 Performance Assurance Pty Ltd 26
http://www.instalacja.oksir.eu/
Cool 3d animation of a “house”
made out of obsolete PC parts
27. Process
• Testing on EC2
• Installed APM product
• Collected data during functional testing
• But
• Transaction mix not representative of production
• Load <<< target load
• Only a subset of application tested in time so model incomplete
• Lots of exceptions
• 50% of time was in Synchronization (something wrong)
• Initial model predicted 240 cores at target load!
23/03/2016 Performance Assurance Pty Ltd 27
28. Deployment to production accelerated
• Using only a few days data:
• Synchronization time < 1%
• Less errors
• Model predicted 74 minimum cores at target load
• Using several weeks data:
• Model predicted 72 cores
• A more pessimistic version including load dependence predicted 134 cores.
• Actual number of cores in production was 152
23/03/2016 Performance Assurance Pty Ltd 28
30. Project 3
• DevOps
• Focus on response time SLAs
• Deployment/resources
• Faster cycle time
• Challenge
• In-house APM tool
• “Profile point” times only
• Required pre-processing (using Hive)
23/03/2016 Performance Assurance Pty Ltd 31
31. Focus
• Risk service
• Heavily used
• Multiple services
• New services added all the time
• Services had different time and memory profiles
• Would a new service break the SLA?
• Baseline model accurate to 10% response time
23/03/2016 Performance Assurance Pty Ltd 32
32. Alternatives modelled
• Changing transaction mix
• Changing arrival rates
• Making some services asynchronous, concurrent
• Adding new risk assessment services
• More complex
• Optimising deployment of services to multiple servers taking into account
memory and CPU usage, and response time
• A type of box/bin packing problem
• 4 services out of 30 used 50% of CPU
23/03/2016 Performance Assurance Pty Ltd 33
33. Challenges
• Pre-processing APM data “profile points”
• Low load for APM data sample c.f. target load
• Used calibration from load tests on pre-production to improve accuracy
• No CPU time breakdown from APM data
• But GC had a profile point (and was significant)
• Transaction types not in APM data
• Had to infer them, either too few or too many
23/03/2016 Performance Assurance Pty Ltd 34
37. DevOps
• Goal is to shift left and shift right
• Shift right
• Build and continuously maintain performance model of production to accurately model
response times, scalability, capacity and resource requirements under target production
loads
• Shift left
• Calibrate production performance model for development
• Enable developers to make code changes, explore impact with unit tests and
development APM to incrementally rebuild performance models
• To understand likely performance and scalability impact
• Speed up development cycle as no longer have to wait (weeks) for performance testing
23/03/2016 Performance Assurance Pty Ltd 38
38. DevOps
23/03/2016 Performance Assurance Pty Ltd 39
Dev Test Prod
Deploy to test Deploy to prod
APM APM APM
Early Feedback
Base
Model
Dev
Model
Incremental updates to
Base model with dev changes
Baseline model buildDev Model Update
Calibrate prod model for dev
39. An aside: Zipf’s Law: rank vs value, on
log10/log10 graph slope = -1
23/03/2016 Performance Assurance Pty Ltd 40
40. Zipf’s law and Service Demand
• Applies for Service Demand for components in at least 5 examples we
had extensive APM data for
• A few components use the most resources
• Are there sufficient resources?
• Target them for splitting/optimisation efforts
• If you know the biggest service demand, and approx. how many
components, you can estimate the total service demand.
• Daniel Tertilt’s presentation at Large Scale Testing Workshop
• Follows from SOA
• A few coarse grained services (resource intensive)
• Get used lots of times (in each Business process and by other services)
23/03/2016 Performance Assurance Pty Ltd 41
41. Observations about automatic modelling
from APM data
• APM vendors collect different/same metrics, and at different levels of
aggregation (e.g. averaged, transactional, per call/total per server, etc).
• Semantics, names, structure not consistent
• Metric detail is critical, response time alone isn’t usually sufficient, also need
breakdown of user/system CPU time, etc
• Still not sure how to measure and model I/O times
• Getting the data out is non-trivial and requires some/lots of pre-processing
• Often too much data, not all of it is relevant
• Very slow to get all the data, ideally only want the subset of metrics of
relevance
• Experimenting with incremental model building using increasing numbers of
transaction samples
• Depending on what data is available, and what the problem is, some or all
model types are possible
• Most useful/accurate models are built from transactional data, with detailed time
breakdowns per server
• But, being able to build different types of models is useful for research
23/03/2016 Performance Assurance Pty Ltd 42
42. Other APMs
• Dynatrace
• High quality metrics, but slow to extract detailed (PurePath) data
• Simple capacity models from transaction flow dashboard data
• SPLUNK
• Quality of metrics entirely dependent on what’s put into it
• Queries to extract data can be slow
• AppDynamics
• Tricky to get all metrics out, snapshots have most metrics in form required
(except backend systems), but can’t be produced from Production
environments
23/03/2016 Performance Assurance Pty Ltd 43
43. Send us your data
• Free trial of simple Dynatrace capacity models
• http://www.performance-assurance.com.au/send-us-your-data/
• http://www.performance-assurance.com.au/introduction-to-
automatic-model-building/
• Send us a sample Dyntrace session file and we’ll send you a link to a
demo capacity model
• Particularly interested in trending technologies and use cases, e.g.
Micro-services, Containers, Big Data, IoT, etc
• Free Personal Dynatrace license: http://bit.ly/dtpersonal
23/03/2016 Performance Assurance Pty Ltd 44