20190527_Helena Cousijn _ FREYA
•
1 like•215 views

Presented by Helena Cousijn (FREYA) during the OpenAIRE workshop "Research policy monitoring in the era of Open Science and Big Data" taking place in Ghent, Belgium on May 27th and 28th 2019 Day 1: Monitoring and Infrastructure for Open Science https://www.openaire.eu/research-policy-monitoring-in-the-era-of-open-science-and-big-data-the-what-indicators-and-the-how-infrastructures

Recommended
Recommended
More Related Content
What's hot
What's hot (20)
Similar to 20190527_Helena Cousijn _ FREYA
Similar to 20190527_Helena Cousijn _ FREYA (20)
More from OpenAIRE
More from OpenAIRE (20)
Recently uploaded
Recently uploaded (20)
20190527_Helena Cousijn _ FREYA
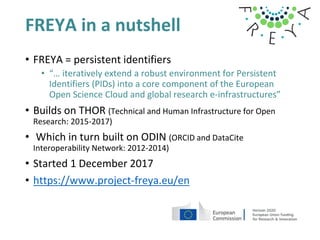
- 1. FREYA in a nutshell • FREYA = persistent identifiers • “… iteratively extend a robust environment for Persistent Identifiers (PIDs) into a core component of the European Open Science Cloud and global research e-infrastructures” • Builds on THOR (Technical and Human Infrastructure for Open Research: 2015-2017) • Which in turn built on ODIN (ORCID and DataCite Interoperability Network: 2012-2014) • Started 1 December 2017 • https://www.project-freya.eu/en
- 3. PID Graph The PID Graph is a network of connections between PIDs based on a collection of user stories. PID PIDPID PID PID PID https://doi.org/10.5438/jwvf-8a66More about PID graph: InstitutionsFunders Data and Software Publications Researchers Grants and Projects
- 4. What can we ask the PID Graph? • Open science practices: - Show how many researchers in a country have an ORCID - Show how many publications from a particular funder have an open access license - Show the number of non-traditional research outputs for an institution • To move towards indicators, we want to enable queries about: - Changes over time - Different disciplines - Different actors and countries • Thinking about impact: - The PID graph also contains information about usage, citations and social media mentions - E.g. Show all datasets created by a particular researcher and their usage stats
- 5. Any questions following this panel discussion? Post them to PIDforum.org!