SlideShare a Scribd company logo
1 of 22
Download to read offline
Exploring dietary diversity, nutritional status of adolescents among farm households in
1
Nigeria: do higher commercialization levels translate to better nutrition?
2
3
4
AuthorAcceptedManuscript (AAM) from Nutrition and Food Science: 25 June 2022
5
DOI: https://doi.org/10.1108/NFS-03-2022-0104
6
7
8
Abstract
9
Purpose:
10
This study explored dietary diversity and nutritional status of adolescents among rural farm households in
11
Southwestern Nigeria. It analyses if higher commercialization levels of farm households translate to better
12
nutrition.
13
Design/methodology/approach: The study was conducted in Ogun and Oyo States of Southwestern
14
Nigeria, utilizing primary data from 352 farm households with a total of 160 adolescent members. The
15
individual version of dietary diversity score (DDS) of nine (9) food groups was used to calculate
16
adolescent DDS over a 24-h recall period, World Health Organization (WHO) AnthroPlus software was
17
used in analyzing adolescents’ anthropometric data (height-for-age z-score and BMI-for-age z-score)
18
while household crop commercialization index (CCI) was estimated for each farm household. Separate
19
logit models were used to examine the drivers of adolescents’ dietary diversity and malnutrition.
20
Findings: The study findings indicated that 100% of the adolescents consumed starchy staples while 0%,
21
3.1% and 12.5% consumed organ meat, milk/milk poducts, and eggs respectively. Results revealed that
22
74.1% and 21.2% of boys were stunted and thin while the prevalence in adolescent girls was 50.7% and
23
9.3% respectively. Prevalence of stunting was found to be very high (60-83%) in all the four CCI levels’
24
households indicating that belonging to highly commercialized households (CCI 3-4) may not necessarily
25
translate to better nutrition of adolescent members. Food expenditure (p< 0.01) and access to piped water
26
(p< 0.01) negatively influenced adolescents’ stunting mainly due to lower expediture on food items and
27
lower percent of household having access to piped water respectively while education (p< 0.01) had
28
positive effect on adolescents’ dietary diversity.
29
Originality/value: Previous studies have contributed to the body of knowledge concerning the link
30
between agricultural commercialization and nutrition using under-five children of the households.
31
However, this is the first study that investigated the influence of CCI on DDS and nutritional status of
32
adolescent members of farm households in Nigeria. Our study fills this existing knowledge gap in
33
investigating adolescents’ dietary diversity and malnutrition among smallholder farm households.
34
35
Keywords: Farm households; Crop Commercialization Index (CCI); malnutrition; stunting; WHO
36
AnthroPlus; dietary diversity score.
37
38
1. Introduction
39
Adolescence is a unique phase of human life with major developmental experiences ushering the
40
much anticipated transition from childhood to adulthood. The health and wellbeing of the children and
41
adolescents (10-19 y old) is of utmost importance to every nation as they are regarded as one of the
42
critical determinants of future economic and societal development (WHO, 2021). In 2020, adolescent (10-
43
19 y old) population reached 1.25 billion, with 16% share of the world’s population. Among countries
44
with highest number of adolescents in the world, India was ranked 1st
(252.2 million), followed by China
45
(166.6 million) and Nigeria was 3rd
(47.7 million) in 2020 (UNICEF, 2021). However, more than 50% of
46
all adolescents globally reside in Asia, with South Asia having the highest number (306.04 million)
47
among all regions while Sub-Saharan Africa (SSA) is the region with the highest population proportion
48
(23%) of adolescents (10-19 y old) in 2020 (UNICEF, 2021).
49
Globally, the prevalence of overweight among children and adolescent has gone up, from 9.5% to
50
12.5% among boys (5-9 y old) and 10.0% to 12.6% among girls (5-9 y old) from 2010 to 2019 while
51
among adolescents aged 10-19 y (male), it increased from 8.1% in 2010 to 12.5% in 2019 and among
52
female adolesecents (10-19 y old), it went up from 10.3% in 2010 to 12.9% in 2019. However, children
53
and adolescents’prevalence of thinness has witnessed a little decline since 2010 with -1.9% (boys) and -
54
0.7% (girls) reduction among 5-9 y childen and -1.1% (male) and -0.2% (girls) decrease among
55
adolescents (10-19 y old) from 2010-2019 (GNR, 2021). The young children and adolescents (5-19 y old)
56
are among the most vulnerable groups of the population usually burdened by unhealthy diets and
57
carbohydrate-dense foods in both developed and low-and middle-income countries (Global Panel, 2016;
58
IFPRI, 2017; GNR, 2021; Otekunrin et al., 2022; Otekunrin, 2022).
59
Healthy and diversified dietary composition of young children and adolescents are pivotal to their
60
growth and developent. The consumption of lose-lose diets predispose this group to different forms of
61
malnutrition (stunting, overweight, micronutrient deficiency) while the adolescent girls of child-bearing
62
age are exposed to burdens of malnutrition (Global Panel, 2016; Garnett, 2016; Willet et al., 2019;
63
Otekunrin et al., 2022). However, other members of the households also need to consume healthy and
64
diversified diets for good nutrition and healthy living. Likewise, diverse diet is viewed as a health guage
65
that indicates the worth of the diets consumed and regarded as very crucial in estimating food and
66
nutrition security of individuals or households (Mirmiran et al., 2006; Azadbahkt and Esmailzader, 2012;
67
Obayelu and Osho, 2020; Otekunrin et al., 2022). However, the challenge of hunger and food insecurity
68
was experienced by almost every country in 2020. Globally, it was estimated that 161 million more
69
people experienced hunger in 2020 more than that of 2019 while about 2.4 billion of the population did
70
not have access to quality and sufficient food in 2020, reflecting an unprecedented increase of 320 million
71
in 12 months period (FAO et al., 2021).
72
Moreover, high-quality diets was far from the reach of about 3 billion people in 2019, owing to
73
the soaring cost of healthy diets, ever-increasing poverty levels in developing nations, and income
74
inequality in all regions of the world. More so, high prevalence of food insecurity was related to the rising
75
unaffordable healthy diets.The emergence of COVID-19 has really aggravated hunger and food insecurity
76
in all regions of the world, putting so much pressure on the food systems and health sector in every
77
country (FAO et al., 2021). With 282 million malnourished population (1/3 of global population) found
78
in Africa in 2020, malnutrition remained a serious challenge in the region (FAO et al., 2021). However, a
79
study revealed that many of the malnourished population are high among smallholder farm households in
80
poor nations who depend mostly on agriculture as means of livelihood (IFPRI 2017; Otekunrin et al.,
81
2022). Good health of members of farm households mostly adolescent members (future head of
82
households) are pivotal to their agricultural productivity, produce marketing and that of the nation’s food
83
security strategy.
84
Agricultural commercialization occurs when agricultural operations depend largely on the market
85
for the sale of produce and for the purchase of production inputs, and labour (APRA, 2018). More so,
86
Agricultural commercialization refers to increased market transactions in a position of enjoying gains
87
from specialization (Carletto et al., 2017; Opondo et al., 2017; Otekunrin, 2022; Otekunrin et al., 2022).
88
The estimaion of the extent of commercialization of smallholder agriculture from the output side of
89
production gives us the opportunity to take advantage of marketing behaviour from (small-scale to full
90
commercialization) of individual households (Carletto et al. 2017; Opondo et al. 2017; Otekunrin et al.,
91
2022).
92
Previous studies in Africa, such as Northern Ethiopia found high level of stunting (26.5%) and
93
thinness (58.3%) among adolescent students (Melaku et al., 2015). More so, a study in Northwest
94
Ethiopia also reported 21.8% stunting and 16.9% thinness among school-aged adolescents (Kebede et al.,
95
2021). However, some studies also reported nutrition outcomes and dietary diversity (DD) of both under-
96
five children and women of rural farm households in Nigeria (Lawal and Samuel, 2010; Babatunde et al.,
97
2011; Ukegbu and Ogu, 2017; Ogunnaike et al., 2020; Otekunrin et al., 2022). Likewise, few works have
98
described the relationships that existed between agricultural commercialization and nutritional status of
99
under-five children (Okezie and Nwosu, 2007; Carletto et al., 2017) while Otekunrin et al (2022)
100
investigated DD of young children of farm households in Southwestern Nigeria. From literature, studies
101
on agricultural commercialization, dietary diversity, and nutrition outcomes nexus among adolescent
102
members of farm households have not yet received research priority.
103
However, from our knowledge, this study is the first that focuses on the effect of agricultural
104
commercialization on dietary diversity and nutrition outcomes of adolescent members of rural farm
105
households. This study is set to fill knowledge gap concerning the dietary pattterns and nutrition
106
outcomes of adolescent members of smallholder farm households. The study employed primary data and
107
used individual dietary diversity score (IDDS) module to calculate the DDS of the adolescent members of
108
the cassava farm households while WHO AnthroPlus software was used to determine the nutrition
109
outcomes (stunting and thinness) of the adolescents (boys and girls). The result of the study is crucial to
110
the stakeholders in prioritizing the implementation of nutrition-sensitive policy interventions that will
111
improve the health and standard of living of adolescents as well as other members of the households.
112
2. Methodology
113
2.1. The study area
114
This study was conducted in Southwestern Nigeria. The country is one of the West African
115
countries with land mass of 923,768 square kilometer (Maps of World 2021; Otekunrin et al., 2022). The
116
region has six (6) states namely; Lagos, Ekiti, Ogun, Ondo, Osun and Oyo. However, majority of the
117
people in this part of the country speak Yoruba fluently but not without diverse dialects within and across
118
the states. The study was carried out in Ogun and Oyo states, Southwestern Nigeria. Agriculture is the
119
major occupation of the rural people in this region (Lawal and Samuel 2010; Otekunrin, 2022).
120
2.1. Sampling and data collection procedure
121
This study utilized primary data which was collected through multi-stage sampling procedure. In
122
the first stage, two (Ogun and Oyo states) out of six (6) cassava producing states in the Southwestern
123
Nigeria was randomly selected. The stage two included the selection of 5 Local Government areas
124
(LGAs) from Oyo state and 3 LGAs from Ogun state giving a total of eight (8) LGAs in the two states.
125
The third stage included the selection of 24 villages from the 8 LGAs while stage four included selection
126
of 16 smallholder cassava farm households resulting in 384 farm households. The data were collected
127
with the help of structured questionnaire which include; the household socioeconomic factors,
128
adolescents’ DDS, expenditure on food and other germane household and adolescent-related issues.
129
Thirty-two (32) of the questionnaires were unusable after data cleaning. In the 352 farm households, there
130
were 160 adolescent members. However, anthropometric measurements such as age of adolescents,
131
gender, height and weight were measured and recorded. The number of food groups consumed by the
132
adolescents were recorded and used in calculating their DDS while measurement details were used in
133
obtaining malnutrition indices such stunting-height-for-age z-score (HAZ) and thinness-body mass index
134
z-score (BAZ).
135
136
2.2. Data Analysis
137
2.2.1. Evaluating the levels of agricultural commercialization
138
The commercialization levels of smallholder cassava farming households in the study areas were
139
estimated, adapting the Crop Commercialization Index (CCI) by Strasberg et al., 1999, Carletto et al.,
140
2017; Otekunrin et al., 2022 which is expressed as:
141
142
𝐶𝐶𝐼𝑖 =
𝐺𝑟𝑜𝑠𝑠 𝑣𝑎𝑙𝑢𝑒 𝑜𝑓 𝑐𝑟𝑜𝑝 𝑠𝑎𝑙𝑒ℎℎ𝑖, 𝑦𝑒𝑎𝑟𝑗
𝐺𝑟𝑜𝑠𝑠 𝑣𝑎𝑙𝑢𝑒 𝑜𝑓 𝑎𝑙𝑙 𝑐𝑟𝑜𝑝 𝑝𝑟𝑜𝑑𝑢𝑐𝑡𝑖𝑜𝑛ℎℎ𝑖,𝑦𝑒𝑎𝑟𝑗
× 100 (1)
143
We have ℎℎ𝑖 as the 𝑖𝑡ℎ
household in year j.
144
Using this method, agricultural commercialization is represented by a continuum from real
145
subsistence (𝐶𝐶𝐼𝑖 = 0) to full commercialization (𝐶𝐶𝐼𝑖 = 100). Using this method, cassava farm
146
households were categorized on their commercialization levels. Farm households that did not participate
147
in the sale of cassava roots were grouped as (i) zero level households (CCI 1 = 0%) while participants
148
were classified into; (ii) low level (CCI 2 =1-49%) (iii) medium-high level (CCI 3 = 50-75%) and (iv)
149
very- high level (CCI 4 = >75%) of commercialization (Otekunrin, 2022; Otekunrin et al., 2022).
150
151
2.2.2. Measuring individual dietary diversity score (IDDS) for adolescents
152
The IDDS for adolescents helps in detemining the individual member of the household dietary
153
pattern in a particular period of time such as 30-d, 7-d, and 24-h recall period. Nine (9) food groups (FG)
154
was adapted for adolescents aged 10-19 y old. However, the minimum of 4 food groups or more out of 9
155
was used (Kennedy et al., 2010a, b; Steyn et al., 2014; Otekunrin et al., 2022). It is worthy of note that
156
IDDS capured all foods consumed by specific individual irespective of how the foods were prepared
157
whether at home or outside. The food groups are: (i) Starchy Staples, (ii) Dark green leafy vegetables, (iii)
158
Other vitamin A rich fruits and vegetables (a combination of vitamin A rich vegetables and tubers and
159
vitamin A rich fruit), (iv) Other fruits and vegetables (a combination of other fruit and other vegetables),
160
(v) Organ meat (offals), (vi) Meat and fish, (vii) Eggs, (viii) Legumes, nuts and seeds, (ix) Milk and milk
161
products used (Kennedy et al., 2010; Steyn et al., 2014; Uzosike et al., 2020; Otekunrin et al., 2022).
162
The DDS of adolescents was determined by summing the number of different food groups
163
consumed over 24-h recall period while a score of 1 was assigned to each food group resulting in a total
164
of 9 points. The percentage of adolesents meeting up the minimum of 4 food groups out of 9 was
165
calculated. This means an adolescent having DDS less than 4 is regarded as having low DDS.
166
167
2.2.3. Anthropometric measurements of adolescents
168
Anthropometry is a human body measurements which is commonly used to obtain crucial
169
nutrition details about a sample or population (Babatunde et al., 2011). Previous rural farm household
170
studies have applied anthropometric data to under-five children (Babatunde et al., 2011; Ogunnaike et al.,
171
2020). Empirical studies on anthropometric measurements of adolescent members of households
172
especially rural farm households are scare. The anthropometric measurements for adolescents (10-19 y
173
old) were measured using stunting (HAZ) and thinness (BAZ). The anthropometric indices of adolescent
174
members of cassava farm households were obtained for this study. These are stunting and thinness.
175
However, adolescents having HAZ < -2 Standard Deviation (SD) and < -3SD compared to the 2007
176
WHO reference were classified as stunting and severe stunting while BAZ < -2SD and < -3SD referred to
177
as thinness and severe thinness respectively (de Onis et al., 2007; Bhargava et al., 2020). The
178
anthropometric analysis for 160 sampled adolescents of cassava farm households was analyzed using the
179
WHO AnthroPlus software (WHO, 2009; Bhargava et al. 2020).
180
2.2.4. Modelling the drivers of adolescents’ dietary diversity and malnutrition
181
The determinants of dietary diversity (DD) among adolescent members of cassava farm
182
households were analyzed using logit regression model (Otekunrin et al., 2022). The choice of this model
183
was appropriate based on the fact that the regressand (adolescents DDS) is binary in nature and
184
categorized as 1 if an adolescent obtains 4 or more food groups out of 9, and zero otherwise, given as a
185
function of a vector of regressors (explanatory variables) assumed to affect DD of adolescents of cassava
186
farm households. The explanatory variables used in the model are; adolescent age, gender, household
187
head year of schooling, farm size, household size, farm income, non-farm income, food expenditure,
188
household primary occupation, transport cost, access to healthcare, access to electricity, access to toilet,
189
access to nutrition training and crop sold ratio (commercialization levels). Following Gujarati and Porter
190
(2009), Otekunrin et al (2022) the logit regression is expressed as:
191
𝐿𝑜𝑔𝑖𝑡 (𝑝) = 𝑙𝑛 (
𝑝
1−𝑝
) = 𝛽0 + 𝛽𝑖𝑋𝑖 + 𝑈𝑖 (2)
192
where 𝑝 denotes the probability of having DD of 4 or more food groups out of 9, the 𝛽𝑖′𝑠 are the
193
parameter estimates of the regressors, the 𝑋𝑖′𝑠 represent the regressors and 𝑈𝑖′𝑠 are the random error
194
terms (Gujarati and Porter, 2009; Otekunrin et al., 2022).
195
Furthermore, the drivers of adolescents’ malnutrition (stunting and thinness) of farm households
196
were also analyzed using logit regression model, as expressed in equation (2) above. Here, the dependent
197
variables are the malnutrition status (stunting and thinness) of the adolescent members of the farm
198
households were presented in separate regression models. In each case (dummy variable), one (1) is for
199
malnourished adolescent and zero (0) otherwise (i.e. stunted =1, 0 otherwise; thinness = 1, 0 otherwise)
200
expressed as a function of a vector of explanatory variables assumed to affect the malnutrition of
201
adolescent members of cassava farm households. This indicated that in each case, the parameter estimate
202
shows the likelihood that an adolescent will be malnourished. Here, the positive sign on the parameters
203
reveals increased level of malnutrition while negative sign indicates low level of malnutrition (Babatunde
204
et al., 2011).
205
The regressors included in the model are; adolescent age, household head gender, household head
206
year of schooling, farm size, household size, farm income, non-farm income, food expenditure, distance
207
to market, transport cost, access to healthcare, access to electricity, access to toilet, access to piped water,
208
access to nutrition training and crop sold ratio.
209
𝐿𝑜𝑔𝑖𝑡 (𝑝) = 𝑙𝑛 (
𝑝
1−𝑝
) = 𝛽0 + 𝛽𝑖𝑍𝑖 + 𝑈𝑖 (3)
210
The 𝑍𝑖′𝑠, as the only parameter that is different from equation (2) represents the regressors in the model
211
(Gujarati and Porter, 2009; Otekunrin et al. 2022).
212
213
Ethical approval and consent to participate:
214
The Department of Agricultural Economics and Farm Management Review Board of Federal University
215
of Agriculture, Abeokuta (FUNAAB), Nigeria approved this study. In addition, Oyo State Ethics Review
216
Committee of the Ministry of Health also approved this study (Ref No: AD13/479/4420A
). However,
217
informed consent was received from the respondents before data collection while respondents’ data are
218
completely anonymized.
219
220
221
3. Results and Discussion
222
3.1. Socioeconomic description of adolescents’ farm households
223
The results of the socioeconomic description of adolescents’ farm households of this study is
224
revealed in Table I. The results indicated that, from the 160 adolescents of farm households, 53% were
225
male while 47% were female. The mean age of the adolescents was 13.6 y old. However, 63% of the
226
household heads were men while the rest were women. The mean household farm size was about 7
227
persons while household head year of schooling was 7. More so, Table I also showed that mean
228
household farm size was 1.46 hectare, while farrm income and non-farm income wee at N122, 281 (388
229
US $) and N71, 500 (221 US $) respectively. The mean household food expenditure (monthly) was N25,
230
006 (77 US $). The mean household head (HH) farm expeience was 14 years while mean household head
231
cassava farming experience was about 11 y. The mean household transport cost, distance to market and
232
crop share ratio was N3, 673 (11 US $), 9.3 hectare and 0.62 respectively. The adolescents’ mean DDS
233
was 4.7 while mean HAZ and BAZ was -2.6 and -0.88 respectively.
234
235
<Table 1>
236
237
Furthermore, the results of the food groups consumed by adolescent members of cassava farm
238
households in the previous 24-h recall period indicated that 100% of the adolescents consumed starchy
239
staples (i.e. rice, “eba”, “amala”, yam etc) in the two states while about 30% and 65% consumed green
240
leafy vegetables in Ogun and Oyo states respectively. However, the results also indicated that 60% of the
241
adolescents consumed legumes, nuts and seeds in the two states. More so, it is interesting to note that only
242
9.3% and 16.2% of the adolescents consumed eggs in previous 24-h in Ogun and Oyo states respectively.
243
Only 3.1% adolescents in the two states (Ogun, 1.2%; Oyo, 5.4%) consumed milk and milk products
244
while no adolescents consumed organ meat in the two states in 24-h recall period. However, 47% and
245
10.8% of the adolescents did not meet the minimum 4 food groups in Ogun and Oyo states respectively.
246
The adolescents have DDS mean score of 4.5 and 4.85 in Ogun and Oyo states respectively.
247
248
3.2. The cassava commercialization levels
249
The commercialization levels of households in the study areas indicated the extent of their
250
cassava commercialization. The commercialization level is calculated using the CCI of each cassava farm
251
household (equation 1). The results revealed that 9.2% and 16.1% of cassava farm households are non-
252
participants in the sales of cassava roots in the market (zero level) in Ogun and Oyo states respectively.
253
About fifty percent of the households had above 75% CCI in Ogun while 33.7% were in Oyo state.
254
However, about 40% of the households were categorized as very-high commercialization households
255
(CCI 4).
256
257
3.3. Exploring adolescents’ DDS across farm households’ CCI levels
258
This section explores the adolescents’ DDS in all the four CCI levels (CCI 1-4) of farm
259
households. However, results in Table 2 indicated that less than twenty-five percent (21.1%) of the
260
adolescents of zero level (CCI 1) households in the two states (Ogun, 28.6%; Oyo, 16.7%) did not meet
261
the minimum 4 food groups out of 9 within 24-h recall period. Also, in Ogun state, the results revealed
262
that farm households in higher CCI levels (CCI 3-4) recorded higher percent of adolescents consuming
263
less than minimum DDS of 4 food groups, with medium-high level farm households (CCI 3) recording
264
more than fifty percent (53.7%) while very-high level (CCI 4) recorded 43.2% of the adolescents failing
265
to meet up with the minimum DDS in 24-h recall period. Contrariwise, Oyo state recorded less than
266
fifteen percent (CCI 3 = 11.5%; CCI 4 = 8.0%) of the adolescent members of farm households consuming
267
less than 4 food groups in the previous 24-h. However, the scatter plot showing the association between
268
adolescents DDS and CCI revealed the existence of very weak negative relationship between the two
269
variables with Correlation Coefficient (r) = -0.03. Similarly, in Table 2, the relationships between
270
adolescents’ DDS and farm households’ CCI in the two states are not statistically significant (Ogun, p =
271
0.45; Oyo, p = 0.91).
272
273
<Table II>
274
275
3.4. Nutritional status of adolescent members of farm households
276
The results of the study in Table 3 presents the nutrition outcomes of adolescent members of
277
smallholder farm households in the study areas. The results revealed that 85 were boys while 75 were
278
girls. Also, among the adolescent boys, fifty-four (54) were in the age-group 10-14 y old while thirty-one
279
(31) were in the age bracket 15-19 y old. There were forty-nine (49) adolescent girls in the age-group 10-
280
14 y old while twenty-six (26) fall within 15-19 y old age bracket. The results also showed the mean and
281
standard deviation of adolescents’ HAZ and BAZ as -2.58 ± 1.3 and -0.88 ± 1.9 respectively. The results
282
further revealed that 74% of the boys were found to be stunted (having HAZ < -2SD) while about 44% of
283
them were severely stunted (having HAZ < -3SD). Interestingly, stunting prevalence in adolescent girls
284
are lower when compared to that of boys. About 57% and 39% of girls were found to be stunted in 10-14
285
and 15-19 y of age respectively. However, thinness (BAZ < -2SD) among adolescent boys (10-19 y old)
286
of cassava farm households was found to be 21.1% while 9.4% of them were severely thin (BAZ < -3SD).
287
The prevalence of thinness is lower in adolescent girls with 9.3% thinness and 1.3% severe thinness.
288
However, Figure 1-2 (A and B) revealed the nutrition outcomes (HAZ and BAZ) curves of adolescents of
289
all cassava farm households and gender distribution (boys and girls ) in rural Ogun and Oyo states
290
compaed to the WHO reference. The results revealed a conspicuous shift of the curves to the left
291
(negatively skewed distribution).
292
293
<Table III>
294
295
<Figure I>
296
297
<Figure II>
298
299
3.5. The Prevalence of adolescents’ undernutrition across farm households’ CCI levels
300
This section invesigated the link between cassava commercialization and nutrition outcomes
301
(HAZ and BAZ) of adolescent members of the farm households. It further revealed the relationship
302
between cassava commercialization and nutrition indices of adolescent members. Anthropometric indices
303
were used to measure adolescents’ nutritional status (stunting and thinness). The results in Table 4
304
indicated that all (4) cassava farm households’ CCI levels (CCI 1-4) recorded very high stunting
305
prevalence of about 60% while low level households (CCI 2) recorded the highest percent (83.3%) of
306
stunting in the study areas. Furthemore, among total sampled adolescents, 63% (101 adolescents) were
307
found to be stunted. Futhermore, thinness is lower when compared to that of stunting among adolescents
308
in the study areas. The prevalence of thinness was was found to be about 16% and 17% of the adolescents
309
belonging to zero (CCI 1) and low level (CCI 2) households in the study areas. However, medium-high
310
level (CCI 3) households recorded the highest adolescent thinness percent (20.9%) while the lowest
311
percent thinness (9.7%) in adolescents was found in the very-high level (CCI 4) households.
312
However, in Table 4, the relationships between cassava commercialization and nutrition indices
313
of adolescent members of farm households (stunting and thinness) are not statistically significant
314
(stunting prevalence: χ2
= 3.67, p-value = 0.30; thinnnes prevalence: χ2
= 3.09, p-value = 0.38).
315
Furthermore, the scatter plots showing the relationships between adolescents’ nutrition outcomes (HAZ
316
and BAZ) and CCI revealed the existence of weak negative relationship between HAZ and CCI
317
(Correlation Coefficient (r) = -0.26) while there existed a very weak positive relationship between BAZ
318
and CCI (Correlation Coefficient (r) = <0.01).
319
320
<Table IV>
321
322
3.6. Determinants of adolescents’ dietary diversity and malnutrition
323
This section presents the results of logit regression of drivers of adolescents dietary diversity and
324
nutritional status (stunting and thinness) of farm households (Table 5 & 6). As specified above, logit
325
regressions were used to regress dietary , stunting, and thinness against some sets of household and
326
adolescent-centred variables (as regressors). The regressand (dependent variable) in each case is a
327
dummy, 1 if adolescent meet the minmum 4 food groups and 0 otherwise; 1 if adolescent is malnourished
328
and 0 otherwise (i.e. stunted = 1, 0 otherwise; and thinness = 1, 0 otherwise). The resulting parameter
329
estimates from the logit regressions indicate the likelihood of the adolescents meeting the recommeded
330
DDS and the probability of the adolescents being malnourished.
331
The results in Table 5 revealed the factors influencing adolescents’ dietary diversity of cassava
332
farm households. The results revealed that household size (p< 0.03) is negatively related to the probability
333
of meeting the recommeded DDS while household head year of schooling (p< 0.01) is positively related
334
to the likelihood of meeting the recommended adolescedents DDS in the study areas. However, household
335
toilet (p< 0.03) and nurition training access (p< 0.01 negatively influenced the dietary diversity of the
336
adolescents. It is noteworthy that commercialization level of farm households (crop sold ratio) was not
337
significant (p< 0.42) in the model but was positively related to the dietary diversity of adolescent
338
members of cassava farm households.
339
From Table 6, the first part of the results (stunting) showed some of the significant drivers of
340
stunting among adolescent members of cassava farm households such as household size (p< 0.01), farm
341
income (p< 0.01) and nonfarm income (p< 0.02) positively influenced the incidence of stunting while age
342
of adolescent (p< 0.01), food expenditure (p< 0.01), access to electricity (p< 0.01), access to piped water
343
(p< 0.01), and commercialisation level (p< 0.01) negatively influenced stunting of adolescents in the
344
study areas. However, the second part of the results (thinness) in Table 6 revealed some of the significant
345
determinants of thinness among adolescents of cassava farm households which include; adolescent gender
346
(p< 0.02), household head year of schooling (p< 0.08), and commercialization level (p< 0.01) positively
347
affect adolescent thinness while access to nutrition training negatively influenced adolescent thinness in
348
the study areas.
349
350
<Table V>
351
352
<Table VI>
353
354
3.2. Discussion
355
The dietary diversity of adolescent members of farm households in the study areas revealed a
356
100% consumption of starchy staples in the two states. This indicated the 100% inclusion of
357
carbohydrate-dense food in the diet of all the adolescents in the last 24-h recall period. This result was
358
similar to the study among school-aged children (6-11 years old) in Port Harcourt metropolis, Nigeria
359
(Uzosike et al., 2020). Previous studies have also revealed that starchy foods top most of the diets in
360
Nigeria and in most low-and middle-income countries (Garnett, 2016; Ochieng et al., 2017; Willet et al.,
361
2019; Uzosike et al., 2020; Otekunrin et al., 2021; Otekunrin, 2022). The DDS of the adolescents in the
362
two states further showed that eggs and milk/milk products were consumed by only 12% (20/160) and
363
3.1% (5/160) respectively while no adolescents consumed organ meat in the last 24-h recall period. This
364
result was contrary to the study of Uzosike et al (2020) who reported that 11.7% (99/847) of school-aged
365
children (6-11 y old) in Port Harcourt metropolis consumed organ meat in the last 24-h recall period.
366
More so, the low proportion of the adolescents consuming dark green leafy vegetables (Ogun,
367
30.2%) and eggs (Ogun, 9.3%; Oyo, 16.2%) is a source of concern because of the importance of such
368
food groups in the diets of children and adolescents in the households. However, this kind of dietary
369
pattern among adolescent members of the farm households may be a reflection of the one that existed
370
among children and their mothers. Few empirical studies reported similar dietary patterns among
371
children, adolescents and women of child bearing age in Nigeria and other parts of the world with most of
372
the foods consumed being carbohydrate-dense (Ochieng et al., 2017; Nithya and Bhavani, 2018; Keats et
373
al., 2018; Rammohan et al., 2018; Otekunrin, 2022; Otekunrin et al., 2022).
374
Assessing the dietary diversity of the adolescents across farm households’ CCI levels (Table 2) in
375
rural Ogun and Oyo states, 53.7% of adolescents in medium-high level households (CCI 3) in Ogun did
376
not meet the minmum DDS while about 43% (consuming < 4 food groups) were found in very-high level
377
(CCI 4) households in Ogun state. This may be associated with the fact that rural farm households in
378
Ogun states that are members of highly commercialized cassava households (CCI 3-4) had more of their
379
adolescents consuming low DDS (< 4 food groups) which may be as a result of household heads’ decision
380
to plough back most of the income received from sales of their produce (cassava roots) to the cassava
381
farming enterprise and do not prioritize the consumption of high-quality diets in the households which
382
may result in low-quality diets and high prevalence of malnutrition among household members especially
383
women and children (Otekunrin, 2022; Otekunrin et al., 2022). This results was corroborated by previous
384
studies that reported overdependence of young children and women on starchy staples and other
385
carbohydrate-dense foods especially in low-and middle-income countries (Savy et al., 2005; Keding et al.,
386
2012; Herrador et al,. 2015; Ochieng et al., 2017; Otekunrin et al., 2022).
387
Furthermore, findings from the scatter plot between adolescents DDS and CCI indicated the
388
existence of very weak negative association (r = -0.03) between adolescents DDS and CCI and showing
389
that as CCI increases, adolescents DDS may go down. This corroborates the results of adolescents DDS
390
in Ogun states (Table 2) where highly commercialized households (CCI 3-4) recorded high percent of
391
adolescents (CCI 3 = 53.7%; CCI 4 = 43.2%) consuming less than 4 food groups and affirming that
392
belonging to highly commercialized households (CCI 3-4) does not guarantee high-quality diets among
393
adolescent members of cassava farm households. Similarly, the relationships between adolescents’ DDS
394
and farm households’ CCI in the two states (Table 2) are not statistically significant (Ogun, p = 0.45;
395
Oyo, p = 0.91) indicating that belonging to either low or high-level CCI may not translate to adolescent
396
members’ consumption of diverse diets in the two states (Ogun and Oyo). This result was similar to that
397
of under-five children dietary diversity score (CDDS) and CCI levels of farm households in Nigeria
398
(Otekunrin et al., 2022).
399
However, this study also showed higher level of undernutrition among adolescents (10-19 y old)
400
of farm households in the study areas. The prevalence of stunting among adolescents (boys and girls) was
401
63.1%. The results of the nutritional status of adolescents indicated that more adolescent boys are stunted
402
and severely stunted than their female counterparts (Table 3). About 74% boys were stunted while
403
adolescent girls recorded 50.7% stunting prevalence. This finding was contrary to the study conducted in
404
Ethiopia which reported seemingly high stunting prevalence (23.8%) among girls than adolescent boys
405
(21.9%) (Jikamo and Samuel, 2019). The adolescents’ stunting prevalence in this study is higher than
406
other studies reported in Northern and Northwest Ethiopia among adolescent students with 37.7% and
407
20.5% stunting prevalence among boys and 21.2% and 26.8% stunting among adolescent girls
408
respectively (Melaku et al., 2015; Kebede et al., 2021). Other studies with lower (medium level; <20%)
409
stunting prevalence include; Dabone et al (2013), Gebreyohannes (2014) and Woday et al (2017). This
410
results was higher than the study in Ethiopia with stunting of 28.5% and severe stunting of 8.1% (Melaku
411
et al., 2015).
412
More so, in this study, the prevalence of thinness was 15.6% while prevalence of thinness among
413
adolescent boys (21.2%) was significantly higher than that of girls (9.3%). In contrary, Melaku et al
414
(2015) reported that prevalence of thinness among girls was higher than that of adolescent boys. This
415
results was lower than other studies in Ethiopia (26.1%) (Melaku et al., 2015), Seychelles (27.7%) (Bovet
416
et al. 2011), and Bangladesh (32%) (Alam et al., 2010).
417
Furthermore, among all adolescents in the study areas, the results revealed that about 63% were
418
stunted (alarming level) while about 16% experienced thinness. It is quite alarming that in all the four
419
CCI levels of the cassava farm households, the lowest stunting percent among adolescent members was
420
59.7% while the highest percent (73.7%) of stunting was recorded among the zero level (CCI 1) farm
421
households. This indicated that stunting is of grave concern among adolescent members of farm
422
households in the study areas. With Nigeria ranked among the top 5 countries with highest population of
423
adolescents in the world (UNICEF, 2021), high prevalence of undernutrition will portend great challenge
424
to healthy living of adolescent population.
425
However, the scatter plot revealing the relationship between HAZ and CCI showed the existence
426
of a negative association between adolescents HAZ and CCI (r = -0.26) indicating that as CCI increases,
427
adolescents’ height-for-age z-score (HAZ) may go down.
428
The result in Table 4 gave more insights to this finding by indicating that, being a member of
429
higher CCI households (CCI 3-4) may not translate to better nutrition for the adolescents and other
430
members of the farm households in the study areas. This result is different from that of the findings by
431
Carletto et al (2017) who found no clear trends between CCI and HAZ even though with under-five
432
children data from three African countries.
433
The logit regression results of the drivers of adolescents’ DD (Table 5) indicated that household
434
head year of schooling was positive and significantly affect the DD of the adolescents while household
435
size, household primary occupation, access to toilet, and access to nutrition training was negative and
436
significantly influence adolescents’ dietary diversity. The marginal effect coefficient of household year of
437
schooling indicated that a unit increase in year of schooling of household head is expected to lead to 0.01
438
rise in the likelihood of adolescent meeting up with the minimum recommended DDS. This implies that
439
as the household head become more educated, the diets of the adolescent members and other members
440
may become more diverse, all other factors held constant. Previous studies results from Tanzania posited
441
that education of household heads may have positive influence on household dietary quality (Ochieng et
442
al., 2017; Rajendran et al., 2017). More so, the household size is significant at 5% level. A unit rise in
443
household size will reduce the probability of the adolescents meeting up with the recommended DDS by
444
1.5%. This result is quite in line with a priori expectation that farm households with larger family size
445
may find it difficult to consume diverse diets (especially young children) because household members
446
will have to manage the available food and this may be connected to the fact that larger percent of rural
447
smallholder farm households are prone to increased levels of food insecurity (Ayinde et al., 2020;
448
Otekunrin et al., 2021; Otekunrin, 2022).
449
However, access to improved toilet negatively influenced adolescents’ dietary diversity in the
450
study areas. A unit increase in access to improved toilet facilities reduces the likelihood of adolescent
451
members meeting the recommended DDS by 0.08. This finding is contrary to a priori expectation in that
452
more access to toilet facilities is expected to improve the nutrition and healthy living of the adolescents
453
and other household members. This may be connected to the fact that most farm households in the study
454
areas did not have access to improved toilet and thereby defecate in the nearby bush, revealing that most
455
households live in an unhygienic environment. This result was corroborated by the report of Nigeria
456
Demographic and Household Survey 2018 which stated that 59.9% rural households in Nigeria did not
457
have access to improved toilet facilities (NPC and ICF, 2019; Otekunrin et al., 2021; Otekunrin et al.,
458
2022; Otekunrin, 2022). Also, household access to nutrition training negatively influenced adolescents’
459
dietary diversity. The marginal effect coefficient indicated that a unit increase in access to household
460
nutrition training is expected to result in 16% decrease in the likelihood of adolescent member of the
461
household meeting the recommended DDS in 24-h recall period. This may be connected to low level of
462
nutrition knowledge occasioned by large percent of households with no formal education in the study
463
areas. This is contrary to previous findings that access to nutrition education enhanced households’ high-
464
quality diets (Pillai et al., 2016; Ochieng et al., 2017; Rajendran et al., 2017).
465
More so, the results indicated crop sold ratio did not significantly influence adolescent DD in the
466
study areas. This revealed that CCI 1-4 of farm households may not necessarily influence diet quality of
467
the adolescents and other members of the farm households. This showed that belonging to higher CCI
468
households does not translate to high-quality diets for the adolescents and other members of the
469
households. This may be connected to the fact that household heads may decide to plough back most of
470
their income received from sales of their produce (cassava roots) to the cassava farming enterprise and did
471
not prioritize the consumption of high-quality diets in the households (Otekunrin, 2022; Otekunrin et al.,
472
2022).
473
Furthermore, the logit regression results of the drivers of adolescents’ nutritional status (stunting
474
= HAZ < -2SD; thinness = BAZ < -2SD) as shown in Table 6 revealed that adolescent age, gender,
475
household size, household farm income, non-farm income, food expenditure, access to electricity, access
476
to piped water, and commercialization level (crop sold ratio) significantly influenced adolescents’
477
nutritional status of farm households in the study areas. However, a unit increase in age is expected to
478
reduce the likelihood of the adolescent being stunted by 81%. This implies that older adolescents are less
479
likely to be stunted. However, a unit increase in household size of farm household will make the
480
probability of stunted adolescent go up by 9.3%. This implies that as cassava farm household member
481
increases, stunting prevalence among adolescent members increases. Due to the prevalence of food
482
insecurity marked with lack of access to nutritious food (food deprivation) among rural smallholder farm
483
households, increase in household member may increase the prevalence of malnutrition (stunting) among
484
adolescents and other young children in the households (Otekunrin et al., 2021; Otekunrin, 2022).
485
Further, considering adolescent gender, a unit increase in adolescent boy is expected to increase the
486
likelihood of thinness by 11.8% when other factors are held constant. This result corroborated the
487
findings in Table 4 where thinness in adolescent boys was found to be higher (21.2%) than that of
488
adolescent girls (9.3%) of cassava farming households. Other studies also reported higher prevalence of
489
thinness in adolescent boys than that of girls (Gebreyohannes et al., 2014; Melaku et al., 2015; Kebede et
490
al., 2021).
491
Moreover, a unit rise in cassava household’s farm income and non-farm income increases the
492
probability of stunted adolescents. This may be due to the fact that most of the income generated from the
493
farm business was ploughed back to the farm business with little consideration for the provision and
494
consumption of nutritious and high-quality diets for household members (especially young children and
495
adolescents). This result is contrary to the previous study that reported that increased household income is
496
more likely to result in higher purchasing power for high-quality food for the adolescents (Darmon and
497
Drewnowski, 2008; Kebede et al., 2021). From the results of the analysis in Table 7, a unit increase in
498
household food expenditure reduces the likelihood of stunted adolescents among cassava farm households
499
by <0.01. This indicated that as household’s expenditure on food go up, more food items will likely be
500
available in the households leading to lower level of undernutrition (especially stunting) among
501
adolescents and other members of the household. Access to rural infrastructure (piped water and
502
electricity among others) are crucial to the well-being of rural households. However, a unit increase in
503
access to both electricity and piped water reduces the likelihood of having stunted adolescents belonging
504
to cassava farming households by 28.1% and 29.6% respectively. The results amplified the importance of
505
rural electrification and access to improved drinking water facilities which have capacity of reducing the
506
prevalence of undernutrition among young children, adolescents, and other members of the farm
507
households (Omotayo et al., 2021; Adeyonu et al., 2022).
508
The marginal effects of commercialisation level (crop sold ratio) revealed that a unit increase in
509
commercialisation level reduces the likelihood of stunted adolescents by 70.5%. This revealed that higher
510
cassava commercialisation level households (CCI 3-4) may likely achieve a reduction in stunting
511
prevalence among adolescent members of farm households. This result is corroborated by the assessment
512
of undernutrition (stunting) of adolescent members across CCI levels (Table 5). Here, stunting among
513
adolescents was higher in both zero level (73.7%) and low level (83.3%) households when compared with
514
that of highly commercialized households (medium-high level, 59.7%; very-high level, 59.7%).
515
Although, all the four commercializattion levels (CCI 1-4) recorded very high percent (60-83%) of
516
stunting among adolescent members of households in the study areas.
517
518
Conclusion and Recommendations
519
Previous empirical works have analyzed the prevalence and determinants of adolescents’ dietary
520
diversity and some on adolescents’ malnutrition but, studies on the links between commercialization
521
levels and adolescents’ dietary diversity, and malnutrition among farming households are scarce
522
especially in Nigeria. This study showed that the dietary pattern of the adolescent members in the study
523
areas (especially in Ogun state) was rather monotonous with 100% consumption of starchy staples while
524
food groups such as organ meat, milk/milk products and eggs were consumed by 0%, 5% and 20%
525
adolescents within 24-h recall period respectively. About 47% of the adolescents in Ogun state achieved
526
less diverse diets (< 4 food groups) by failing to meet up with the minimum dietary diversity. This study
527
found very weak negative relationship between adolescents’ DDS and CCI, indicating that belonging to
528
higher CCI households may not guarantee access to diverse diets (especially in Ogun state).
529
However, more adolescent boys were found to be stunted and thin when compared to the
530
adolescent girls while very high (≥ 60%) adolescent stunting prevalence was recorded in all the four CCI
531
levels’ households in the study areas. In addition, there existed a negative association between HAZ and
532
CCI indicating that as CCI increases, adolescents’ height-for-age (HAZ) may go down. However,
533
belonging to a higher commercialization level households (CCI 3-4) may not necessarily translate to
534
lower prevalence of adolescent stunting as indicated in Figure 5 where CCI 3&4 recorded about 60%
535
stunting prevalence in the study areas. Cassava farm household heads should not be concerned about
536
increasing the extent of cassava commercialization alone but should make concerted effort in prioritizing
537
the provision and consumption of high-quality diets among household members which can enhance
538
diverse dietary pattern and help in reducing undernutrition (stunting and thinness) especially among
539
young children and adolescent members of farm households in the study areas.
540
This study stressed the need to support nutrition-sensitive intervention programs to provide
541
nutrition knowledge/information on preparation and consumption of nutrient-dense diets that will
542
improve the nutritional status of household members. Also, stakeholders should facilitate the provision of
543
rural infrastructure development such as the provision of piped water, rural electrification and functional
544
healthcare facilities that will enhance agricultural productivity and improve healthy living of the farm
545
households.
546
547
References
548
Adeyonu, G.A., Adams, S.O., Kehinde, M.O., Akerele, D., and Otekunrin, O.A. (2022). “Spatial Pofiles
549
and Determinants of Multidimensional Poverty in rural Nigeria” International Journal of Energy
550
Economics and Policy 12 (3), pp. 373-384.
551
Agricultural Policy Research in Africa (2018). “What is Agricultural Commercialization: who benefits
552
and how do we measure it?” Issue 1, pp. 1-6.
553
Alam, N., Roy S.K., Ahmed, T., and Ahmed, A.M.S. (2010). “Nutritional Status, Dietary Intake, and
554
Relevant Knowledge of Adolescent Girls in Rural Bangladesh” Journal of Health Population and
555
Nutrition, 28(1), pp. 86–94.
556
Ayinde I.A., Otekunrin, O.A., Akinbode, S.O., and Otekunrin, O.A. (2020). “Food Security in Nigeria:
557
Impetus for growth and Development” Journal of agricultural. Econonomics and Rural
558
Development. 6(2), pp. 808-820.
559
Azadbahkt, L., and Esmailzader, A. (2012). “Dietary patterns and attention deficit hyperactivity disorder
560
among Iranian children” Nutrition 28(3), pp. 242–249.
561
Babatunde, R.O., Olagunju, F.I., Fakayode, S.B., and Sola-Ojo, F.E. (2011). “Prevalence and
562
Determinants of Malnutrition among Under Five Children of Farming Households in Kwara State,
563
Nigeria” Journal of Agricultural Science 3 (3), pp. 173-181.
564
Bhargava, M., Bhargava, A., Ghate, S.D., and Rao, R.S.P. (2020). “Nutritional status of Indian
565
adolescents (15-19 years) from National Family Health Surveys 3 and 4: Revised estimates using
566
WHO 2007 Growth reference” PLOS ONE, 15(6), pp. 1-24.
567
Bovet, P., Kizirian, N., Madeleine, G., Blössner, M., and Chiolero, A. (2011). “Prevalence of thinness in
568
children and adolescents in the Seychelles: comparison of two international growth references”
569
Nutrition Journal, 10:65.
570
Carletto, C., Corral, P., and Guelfi, A. (2017). “Agricultural commercialization and nutrition revisited:
571
Empirical evidence from three African countries” Food Policy 67, pp. 106-118.
572
Daboné, C., Delisle, H., and Receveur, O. (2013). “Predisposing, facilitating and reinforcing factors of
573
healthy and unhealthy food consumption in schoolchildren: a study in Ouagadougou. Burkina
574
Faso” Global health promotion, 20(1), pp. 68–77.
575
Darmon, N., and Drewnowski, A. (2008). “Does social class predict diet quality?” American Journal of
576
Clinical Nutrition, 87(5), pp. 1107–17.
577
de Onis, M., Garza, C., Onyango, A.W., and Borghi, E. (2007). “Comparison of the WHO child growth
578
standards and the CDC 2000 growth charts” Journal of Nutrition 137, pp. 144–148.
579
FAO, IFAD, UNICEF, WFP, and WHO. (2021). The State of Food Security and Nutrition in the World
580
2021. Transforming food systems for food security, improved nutrition and affordable healthy diets
581
for all. Rome, FAO. Rome.
582
Garnett, T. (2016). “Plating up solutions” Science 353(6305), pp. 1202–1204.
583
Gebreyohannes, Y., Shiferaw, S., Demtsu, B., and Bugssa, G. (2014). “Nutritional Status of Adolescents
584
in Selected Government and Private Secondary Schools of Addis Ababa, Ethiopia” International
585
Journal of Nutrition and Food Science, 3 (6), pp. 504–14.
586
Global Nutrition Report (2021). “2021 Global Nutrition Report: The state of global nutrition” Bristol,
587
UK: Development Initiatives.
588
Global Panel (Global Panel on Agriculture and Food Systems for Nutrition) (2016). “Food systems and
589
diets: Facing the challenges of the 21st century” Foresight Report, London.
590
Gujarati, DN., and Porter, D.C. (2009). “Basic Econometrics” Fifth edition.
591
Herrador, Z., Jesus, P., Sordo, L, et al (2015). Low Dietary Diversity and Intake of Animal Source Foods
592
among School Aged Children in Libo Kemkem and Fogera Districts, Ethiopia. PLoS ONE;
593
10(7):e0133435.
594
International Food Policy Research Institute (IFPRI) (2017). “Global Food Policy Report” Washington,
595
DC: International Food Policy Research Institute.
596
Jikamo, B., and Samuel, M. (2019). “Does dietary diversity predict the nutritional status of adolescents in
597
Jimma Zone, Souhwest Ethiopia?” BMC Research Notes, 12:402.
598
Keats, E., Rappaport, A., Shah, S, et al. (2018). “The dietary intake and practices of adolescent girls in
599
low- and middle-income countries: a systematic review” Nutrients 10(12): 1978.
600
Kebede, D., Prasad, R.P.C.J., Asres, D.T., Aragaw, H., and Worku, E. (2021). “Prevalence and associated
601
factors of stunting and thinness among adolescent students in Finote Selam Town, Nothwest
602
Ethiopia” Journal of Health, Population and Nutrition, 40: 44.
603
Keding, G.B., Msuya, J.M., Maass, B.L., and Krawinkel, M.B. (2012). “Relating dietary diversity and
604
food variety scores to vegetable production and socio-economic status of women in rural Tanzania”
605
Food Security; 4 (1), pp. 129-40.
606
Kennedy, G., Berado, A., Papavero, C., Horjus, P., Ballard, T, Dop, M. (2010a). “Proxy measures of
607
household food consumption for food security assessment and surveillance, comparison of the
608
household dietary diversity and food consumption scores” Journal of Public Health Nutrition. 13
609
(12), pp. 2010–2018.
610
Kennedy, G., Ballard, T., Dop, M. (2010b). “Guidelines for measuring Houdehold and Individual Dietary
611
Diversity” Nutrition and Consumer Protection Division, Food and Agriculture Organization of the
612
United Nations. Accessed from: https://www.fao.org/3/i1983e/i1983e.pdf
613
Lawal, B.O., and Samuel, F.O. (2010). “Determinant of Nutritional Status of Children in Farming
614
Households in Oyo State, Nigeria” African Journal of Food, Agriculture, Nutrition and
615
Development 10 (10), pp. 4235-4253.
616
Melaku, YA., Zello, G.A., Gill, T.K., Adams, R.J., and Shi, Z. (2015). “Prevalence and factors associated
617
with stunting and thinness among adolescent students in Northern Ethiopia: a comparison to World
618
Health Organization standards” Archives of Public Health, 73: 44.
619
Maps of World (2021). Accessed from: https://wwww.mapsofworld.com/lat_long/nigeria-lat-long.html
620
Mirmiran, P., Azadbaht, L., and Azizi, F. (2006). “Dietary diversity within food groups: an indicator of
621
specific nutrient adequacy in Tehranian women” Journal of the American College of Nutrition,
622
25(4), pp. 354–361.
623
National Population Commission (NPC) [Nigeria], ICF (2019). Nigeria Demographic and Health Survey
624
2018. Abuja, Nigeria and Rockville, Maryland, USA: NPC and ICF.
625
Nithya, D.J., and Bhavani, R.V. (2017). “Dietary Diversity and its Relationship with Nutritional Status
626
among Adolescents and Adults in Rural India” Journal of Biosocial Sciences 50, pp. 397-413.
627
Obayelu, O.A., and Osho, F.O. (2020). “How diverse are the diets of low-income urban households in
628
Nigeria?” Journal of Agriculture and Food Research, 2, pp. 1–8.
629
Ochieng, J., Afari-Sefa, V., Lukumay, P.J., and Dubois, T. (2017). “Determinants of dietary diversity and
630
the potential role of men in improving household nutrition in Tanzania” PLoS ONE 12(12),
631
e0189022.
632
Ogunnaike, M.G., Kehinde, M.O., and Olabode, O.J. (2020). “Determinants of malnutrition among
633
children in rural farm households in Ogun State, Nigeria” FUDMA Journal of Science, 4 (4), pp.
634
90-95.
635
Okezie, C.A., and Nwosu, A. (2007). “The Effect of Agricultural Commercialization on the Nutritional
636
Status of Cocoa Growing Households in Ikwuano LGA of Abia State Nigeria” International
637
Journal of Agriculture and Rural Development, 9, pp. 12-15.
638
Omotayo, A.O., Olagunju, K.O., Omotoso, A.B., Ogunniyi, A.I., Otekunrin, O.A., and Daud, A.S. (2021).
639
“Clean water, sanitation and under-five children diarrhea incidence: Empirical evidence from South
640
Africa’s General Household Survey” Environmental Science and Pollution Science, 28 (44), pp.
641
63150-63162.
642
Opondo, F.A., Dannenberg, P., and Willkomm, M. (2017). “Characterization of the levels of cassava
643
commercialization among smallholder farmers in Kenya: A multinomial regression approach”
644
African Journal of Agricultural Research, 12(41), pp. 3024-3036.
645
Otekunrin, O.A, Otekunrin, O.A, Sawicka, B., and Pszczółkowski, P. (2021). “Assessing Food Insecurity
646
and Its Drivers among Smallholder Farming Households in Rural Oyo State, Nigeria: The HFIAS
647
Approach” Agriculture, 11:1189.
648
Otekunrin, O.A. (2022). “Investigating food insecurity, health and environment-relatd factors, and
649
agricultural commercialization in Southwestern Nigeria: evidence from smallholder farming
650
households”. Environmenal Science and Pollution. Research 1-20. https://doi.org/10.1007/s11356-
651
022-19544-w
652
Otekunrin, O.A., Otekunrin, O.A., Ayinde, I.A, Sanusi, R.A., Onabanjo, O.O, and Ariyo, O. (2022).
653
“Dietary diversity, environment and health-related factors of under-five children: Evidence from
654
cassava commercialization households in rural South-West Nigeria” Environmental Science and
655
Pollution. Research, 29(13), pp. 19432-19446.
656
Pillai, A., Kinabo, J., and Krawinkel, M.B. (2016). “Effect of nutrition education on the knowledge scores
657
of urban households with home gardens in Morogoro, Tanzania” Agriculture & Food Security,
658
5(1), 22.
659
Rajendran, S., Afari-Sefa, V., Shee, A., et al. (2017). “Does crop diversity contribute to dietary diversity?
660
Evidence from integration of vegetables into maize-based farming systems” Agriculture & Food
661
Security, 6(1):50.
662
Rammohan, A., Goli, S., Singh, D., Ganguly, D., and Singh, U. (2018). “Maternal dietary diversity and
663
odds of low birth weight: empirical findings from India” Women and Health 59(4), pp. 375–390.
664
Savy, M., Martin-Prevel, Y., Sawadogo, P., Kameli, Y., and Delpeuch, F. (2005). “Use of
665
variety/diversity scores for diet quality measurement: relation with nutritional status of women in a
666
rural area in Burkina Faso” European Journal of Clinical Nutrition, 59(3), pp. 703-716.
667
Strasberg, P., Jayne, T., Yamano, T., et al. (1999). “Effects of Agricultural Commercialization on Food
668
Crop Input Use and Productivity in Kenya” Policy Synthesis for USAID – Africa Bureau Office of
669
Sustainable Development 41, East Lansing MI: Michigan State University 1999.
670
Steyn, N.P., Nel, J., Labadarios, D., Maunder, E.M.W., and Kruger, H.S. (2014). “Which dietary diversity
671
indicator is best to assess micronutrient adequacy in children 1 to 9 y?” Nutrition 30(1), pp. 55-60.
672
United Nations Children’s Fund (2021). “The State of the World’s Children 2021: On My Mind –
673
Promoting, protecting and caring for children’s mental health” UNICEF, New York, October 2021.
674
Ukegbu, P.O., and Ogu, V.C. (2017). “Assessment of Dietary Diversity Score, Nutritional Status and
675
Socio-demograhic Characteristics of Under-five Children in Some Rural Areas of Imo State,
676
Nigeria” Malaysian Journal of Nutrition 23(3), pp. 425-435.
677
Uzosike, T.C.J., Okeafor, I., and Mezie-Okoye, M. (2020). “Dietary Diversity, Nutritional status and
678
Academic performance of pupils in public primary schools in Port Harcourt Metropolis” Journal of
679
Community Medicine and Primary Health Care, 32 (2), pp. 42-56.
680
Willett, W., Rockström, J., Loken, B., et al. (2019). “Food in the Anthropocene: The EAT–lancet
681
commission on healthy diets from sustainable food systems” The Lancet 393(10170):447–492.
682
Woday, A., Menber, Y., and Tsegaye, D. (2017). “Prevalence of and associated factors of stunting among
683
adolescents in Tehuledere District, North East Ethiopia” Journal of Clinical Cell Immunology,
684
9(2): 546.
685
WHO (2009). WHO AnthroPlus for personal computers: Software for assessing growth of the world’s
686
children and adolescents. Geneva.
687
World Health Organization (2021). Working for a brighter, healthier future: how WHO improves health
688
and promotes well-being for the world’s adolescents. Geneva: World Health Organization; 2021.
689
Licence: CC BY-NC-SA 3.0 IGO.
690
691
692
693
694
695
696
697
698
699
Table I Desciption of farm household and adolescent-centred factors
700
Variables Description Mean ± SD
Age Adolescent’s age (years) 13.6 ± 2.7
Household size Persons living in the household 6.6 ± 2.5
Gender Gender of the adolescent 0.47 ± 0.50
HH gender Head of household gender 0.37 ± 0.48
HH education Household head year of schooling 6.6 ± 3.5
F Size Household cassava farmland size (ha) 1.5 ± 1.0
FarmInc Household farm income (naira) N122,281 ± N82,102
Non-farmInc Household non-farm income (naira) N71,500 ± N28,708
FarmExp Household head farming experience (year) 14.4 ± 9.5
cassfarmExp Household head cassava farming experience 10.5 ± 8.6
Food Expenditure Household food expenditure (naira) N25,006 ± N8,820
DistMarket Distance to market (Km) 9.3 ± 3.6
Transport cost Monthly Transport cost (naira) N3,673 ± N1,720
CropShare CCI level 0.62 ± 0.28
Adolescent Ht Adolescent height (Metre) 1.4 ± 0.13
Adoelscent Wt Adolescent weight (Kg) 33.4 ± 9.1
Adolescent DDS DDS of adolescents (0-9) 4.7 ± 1.0
Adolescent HAZ Height-for-age-z-score -2.6 ± 1.3
Adolescent BAZ Body mass index z-score -0.88 ± 1.2
Source: underlying survey data 2020. SD means Standard Deviation
701
702
Table II. Exploring adolescents DDS across cassava farm households’ CCI levels
703
CCI Levels
Adolescent DDS (10-19 y old)
State
Ogun (n=86) Oyo (n=74)
Zero Level
(CCI 1)
n (%) n (%)
Food groups <4 2 (28.6) 2 (16.7)
Food groups ≥4 5 (71.4) 10 (83.3)
Total 7 (100) 12 (100)
Low Level
(CCI 2)
Food groups <4 - 1 (9.1)
Food groups ≥4 1 (100) 10 (90.9)
Total 1 (100) 11 (100)
Medium-high
Level (CCI 3)
Food groups <4 22 (53.7) 3 (11.5)
Food groups ≥4 19 (46.3) 23 (88.5)
Total 41 (100) 26 (100)
Very-High
Level (CCI 4)
Food groups <4 16 (43.2) 2 (8.0)
Food groups ≥4 21 (56.8) 23 (92.0)
Total 37 (100) 25 (100)
Total Food groups <4 40 (46.5) 8 (10.8)
Food groups ≥4 46 (53.5) 66 (89.2)
Total 86 (100) 74 (100)
Fisher’s exact, p-value -, 0.45 -, 0.91
Source: underlying survey data 2020.
704
This shows the number (frequency) and percent of adolescents DDS food groups in all the four CCI levels of farm
705
households in rural Ogun and Oyo states of Nigeria. This equally explored both of the adolescents that met and
706
those that failed to meet the recommmended food groups.
707
708
709
Table III. Nutrition outcomes of adolescent members of farm households
710
Source: underlying survey data 2020.
711
Note: Stunting and severe stunting is HAZ < -2SD; < -3SD respectively
712
Thinness and severe thinness is BAZ < -2SD; < -3SD respectively; SD means Standard Deviation. This Table
713
revealed the nutrition outcomes (HAZ and BAZ) of the adolescents members (10-19 years old) of the cassava
714
farm households in Ogun and Oyo states of Nigeria.
715
Table IV. Adolescents’ nuritional status over farm households’ CCI levels
716
Zero Level (No
Seller)
Low Level Medium-High
Level
Very High Level Chi-square, p-value
Nutritional Status n (%) n (%) n (%) n (%)
Stunted < - 2 SD 14 (73.7) 10 (83.3) 40 (59.7) 37 (59.7) χ2
= 3.67,
p-value = 0.30
Not stunted > -2 SD 5 (26.3) 2 (16.7) 27 (40.3) 25 (40.3)
Total 19 (100) 12 (100) 67 (100) 62 (100)
BAZ (Thinness) < - 2 SD 3 (15.8) 2 (16.7) 14 (20.9) 6 (9.7) χ2
= 3.09,
p-value = 0.38
BAZ (Not Thin) > -2 SD 16 (84.2) 10 (83.3) 53 (79.1) 56 (90.3)
Total 19 (100) 12 (100) 67 (100) 62 (100)
Source: underlying survey data 2020.
717
Note: Stunting is HAZ < -2SD; Thinness is BAZ < -2SD. This table indicated adolescents’ nutritional status across
718
the four commercialization levels (Zero level – very-high levels). It showed the number (frequency) of adolescents
719
experiencing malnutrion and those not suffering from it across the CCI levels of cassava farm households in the
720
study areas
721
722
723
724
725
726
Age Group
(year)
Height-for-age z-score (HAZ) (%) BMI-for-age z-score (BAZ) (%)
Boys (n=85) n % <-3SD % <-2SD Mean ± SD % <-3SD % <-2SD Mean ± SD
10-14 54 42.6 70.4 -2.8 ± 1.2 9.3 18.5 -0.79 ± 1.4
15-19 31 45.2 80.6 -2.8 ± 0.88 9.7 25.8 -1.4 ± 1.1
10-19 85 43.5 74.1 -2.8 ± 1.1 9.4 21.2 -1.0 ± 1.3
Girls (n=75)
10-14 49 34.7 57.1 -2.5 ± 1.4 0 4.1 -0.64 ± 0.91
15-19 26 30.8 38.5 -2.1 ± 1.4 3.8 19.2 -0.91 ± 1.1
10-19 75 33.3 50.7 -2.4 ± 1.4 1.3 9.3 -0.73 ± 0.98
Pooled (n=160)
10-14 103 38.8 64.1 -2.7 ± 1.3 4.9 11.7 -0.72 ± 1.2
15-19 57 38.6 61.4 -2.5 ± 1.2 7 22.8 -1.2 ± 1.1
10-19 160 38.8 63.1 -2.6 ± 1.3 5.6 15.6 -0.88 ± 1.2
727
728
729
730
731
Table V. Determinants of adolescents’ dietary diversity
732
Variables 𝜷 ± RSE ME (P-values)
Adolescent Age (years) 0.03 ± 0.10 <0.01 (0.79)
+Adolescent Gender -0.50 ± 0.62 -0.02 (0.42)
Household Size (Number) -0.51* ± 0.24 -0.02 (0.03)
Farm Size (Ha) 0.43 ± 0.94 0.01 (0.65)
HH year of schooling 0.33* ± 0.11 0.01 (<0.01)
Farm Income (Naira) 0.00 ± 0.00 <0.01 (0.89)
Nonfarm Income (Naira) -0.00 ± 0.00 -<0.01 (0.47)
Food Expenditure (Naira) 0.00 ± 0.00 <0.01 (0.42)
+HH Primary Occupation -3.6* ± 1.3 -0.06 (0.01)
Transport cost (Naira) 0.00 ± 0.00 <0.01 (0.30)
+Healthcare access -1.0 ± 1.2 -0.03 (0.39)
+ Electricity access -0.55 ± 0.93 -0.02 (0.56)
+Toilet access -1.9* ± 0.84 -0.08 (0.03)
+Access to Nutrition Training -2.5* ± 0.90 -0.16 (0.01)
Crop sold ratio 2.3 ± 2.8 0.07 (0.42)
Constant 6.0* ± 2.5 (0.02)
(+) represent dummy variable (0 or 1). *Significance at p<0.05 levels.
733
ME means Marginal Effects, RSE means Robust Standard Error
734
Number of observation = 160
735
Wald chi2
(15) = 34.1
736
Prob > chi2
= 0.00
737
Log pseudo likelihood = -33.4
738
Pseudo R2
= 0.41
739
Note: Marginal effects measures the association between a change in the predictor
740
S and a change in the outcome. It is an effect, not a prediction. It is a change and
741
not a level. It is the percentage change on the probability associated with a unit
742
change in the independent variable. They tell the effect on the probability of not
743
attainig the recommended dietary diversity score.
744
745
Table VI. Determinants of adolescents’ malnutrition
746
Nutrition outcomes
Stunting (1) Thinness (2)
Variables 𝜷 ± SE ME (p-values) 𝜷 ± RSE ME (p-values)
Age (years) -5.6* ± 1.4 -0.81 (<0.01) -0.12 ± 0.11 -0.01 (0.26)
Age squared (years) 0.20* ± 0.05 0.03 (<0.01) - -
+Gender -0.21± 0.60 -0.03 (0.73) 1.2* ± 0.54 0.12 (0.02)
+Household Head gender -1.3* ± 0.73 -0.17 (0.08) 1.3* ± 0.70 0.12 (0.06)
Household Size (n) 0.64*± 0.19 -0.09 (<0.01) -0.10 ± 0.12 -0.09 (0.42)
Farm Size (Ha) -0.48 ± 0.60 -0.07 (0.43) -0.35 ± 0.68 -0.03 (0.61)
HH year of schooling 0.02 ± 0.10 <0.01 (0.84) 0.12* ± 0.07 0.01 (0.08)
Farm Income (Naira) <0.01* ± <0.01 <0.01 (0.01) -<0.01 ± <0.01 -<0.01 (0.83)
Nonfarm Income (Naira) <0.01* ± <0.01 0.09 (0.02) <0.01 ± <0.01 <0.01 (0.11)
Food expenditure (Naira) <0.01* ± <0.01 <0.01 (<0.01) <0.01 ± <0.01 <0.01 (0.87)
Distance to market (Km) - - -0.04 ± 0.08 -<0.01 (0.60)
Transport cost (Naira) <0.01 ± <0.01 <0.01 (0.66) - -
+Access to Nutrition Training 0.48 ± 0.66 0.08 (0.47) -1.2* ± 0.68 -0.14 (0.09)
+Access to Electricity -1.9* ± 0.76 -0.28 (0.01) -0.44 ± 0.67 -0.04 (0.51)
+Access to Piped water -3.3* ± 1.11 -0.30 (0.00) 0.57 ± 0.83 0.05 (0.50)
+Access to Healthcare 0.55 ± 0.65 0.08 (0.39) -0.13 ± 0.68 -0.01 (0.84)
+Access to Toilet - - -1.05 ± 0.75 -0.11 (0.16)
Crop sold ratio -4.9* ± 1.4 -0.71 (<0.01) 3.0* ± 1.2 0.29 (0.01)
Constant 38.6* ± 9.4 (<0.01) 1.2 ± 2.0 (0.56)
Number of observations 160 160
Wald chi2
(16) 34.9 27.1
Prob > chi2
0.00 0.04
Log pseudo likelihood -46.9 -58.1
Pseudo R2
0.56 0.16
(+) represent dummy variable (0 or 1). *Significance at p<0.05 level. SE means Standard Error;
747
RSE means Robust Standard Error. ME means Marginal Effects
748
The p-values are in parenthesis on Marginal Effects and p-values column.
749
Note: Marginal effects measures the association between a change in the predictors and a change in the
750
outcome. It is an effect, not a prediction. It is a change and not a level. They tell the effect on the probability
751
of being malnourished (stunting and thinnes) in a specific group for change in the regressors. It is the
752
percentage change on the probability associated with a unit change in the independent variable.
753
754
755
756
Figure I. A. Height for-age- z-score of all cassava farm households’ adolescents (10-19 y)
757
in rural Ogun and Oyo States. B. Height for-age- z-score of gender (boys and girls) of
758
cassava farm households’ adolescents (10-19 y old) in rural Ogun and Oyo States.
759
Note: The red line is the all children (n =160), blue line is the male (n = 85), pink line is the
760
female (n = 75) while the red line is the WHO 2007 child growth standards.
761
Height for-age- z-score are compared with the WHO 2007 child growth reference population
762
763
764
Fig. 1A
Fig. 1B
765
766
Figure II. A. BMI-for-age z-score of all cassava farm households’ adolescents (10-19 y)
767
in rural Ogun and Oyo States. B. BMI-for-age z-score of gender (boys and girls) of
768
cassava farm households’ adolescents (10-19 y old) in rural Ogun and Oyo States.
769
Note: The red line is the all children (n =160), blue line is the male (n = 85), pink line is the
770
female (n = 75) while the red line is the WHO 2007 child growth standards.
771
BMI-for-age z-score are compared with the WHO 2007 child growth reference population.
772
773
Fig. IIA
Fig. IIB

More Related Content

Similar to Exploring dietary diversity, nutritional status of adolescents among farm households in Nigeria: do higher commercialization levels translate to better nutrition?

Exploring dietary diversity, nutritional status of adolescents among farm hou...
Exploring dietary diversity, nutritional status of adolescents among farm hou...Exploring dietary diversity, nutritional status of adolescents among farm hou...
Exploring dietary diversity, nutritional status of adolescents among farm hou...Olutosin Ademola Otekunrin
 
Association Between Bio-fortification and Child Nutrition Among Smallholder H...
Association Between Bio-fortification and Child Nutrition Among Smallholder H...Association Between Bio-fortification and Child Nutrition Among Smallholder H...
Association Between Bio-fortification and Child Nutrition Among Smallholder H...Premier Publishers
 
Dietary Diversity Choices of Women: Evidence from Cassava Farming Households ...
Dietary Diversity Choices of Women: Evidence from Cassava Farming Households ...Dietary Diversity Choices of Women: Evidence from Cassava Farming Households ...
Dietary Diversity Choices of Women: Evidence from Cassava Farming Households ...Olutosin Ademola Otekunrin
 
Addressing Extreme Poverty - Nutrition Security
Addressing Extreme Poverty - Nutrition SecurityAddressing Extreme Poverty - Nutrition Security
Addressing Extreme Poverty - Nutrition Securityarafathraihan
 
Analysis of Rural Households Food Security Status in Dibatie District, Wester...
Analysis of Rural Households Food Security Status in Dibatie District, Wester...Analysis of Rural Households Food Security Status in Dibatie District, Wester...
Analysis of Rural Households Food Security Status in Dibatie District, Wester...Premier Publishers
 
Assessing Food Insecurity and Its Drivers among Smallholder Farming Household...
Assessing Food Insecurity and Its Drivers among Smallholder Farming Household...Assessing Food Insecurity and Its Drivers among Smallholder Farming Household...
Assessing Food Insecurity and Its Drivers among Smallholder Farming Household...Olutosin Ademola Otekunrin
 
Mohieldin et al. - Unknown - The impact of feeding practices on prevalence of...
Mohieldin et al. - Unknown - The impact of feeding practices on prevalence of...Mohieldin et al. - Unknown - The impact of feeding practices on prevalence of...
Mohieldin et al. - Unknown - The impact of feeding practices on prevalence of...Moawia Alshiek
 
Regional overview of diets and nutrition in South Asia
Regional overview of diets and nutrition in South AsiaRegional overview of diets and nutrition in South Asia
Regional overview of diets and nutrition in South AsiaGlo_PAN
 
https://www.jescae.com/index.php/gssr/article/view/440
https://www.jescae.com/index.php/gssr/article/view/440https://www.jescae.com/index.php/gssr/article/view/440
https://www.jescae.com/index.php/gssr/article/view/440Abdi Hassen Habib
 
Factors influencing the practice of exclusive breast feeding in rural communi...
Factors influencing the practice of exclusive breast feeding in rural communi...Factors influencing the practice of exclusive breast feeding in rural communi...
Factors influencing the practice of exclusive breast feeding in rural communi...Alexander Decker
 
Prevalence of stunting and associated factors of children among 6 59 months a...
Prevalence of stunting and associated factors of children among 6 59 months a...Prevalence of stunting and associated factors of children among 6 59 months a...
Prevalence of stunting and associated factors of children among 6 59 months a...Alexander Decker
 
Assess the Knowledge on Hazards of Junk Foods among Adolescents
Assess the Knowledge on Hazards of Junk Foods among AdolescentsAssess the Knowledge on Hazards of Junk Foods among Adolescents
Assess the Knowledge on Hazards of Junk Foods among Adolescentsijtsrd
 
Implications for Policy and Programming: Reflections from the RENEWAL Study,...
Implications for Policy and Programming: Reflections from the RENEWAL Study,...Implications for Policy and Programming: Reflections from the RENEWAL Study,...
Implications for Policy and Programming: Reflections from the RENEWAL Study,...Jo Vearey
 
Influence of Mothers’ Participation in Intra-Household Decision Making on Nut...
Influence of Mothers’ Participation in Intra-Household Decision Making on Nut...Influence of Mothers’ Participation in Intra-Household Decision Making on Nut...
Influence of Mothers’ Participation in Intra-Household Decision Making on Nut...Hudu Zakaria
 
Family income among small scale farmers a panacea for household food security...
Family income among small scale farmers a panacea for household food security...Family income among small scale farmers a panacea for household food security...
Family income among small scale farmers a panacea for household food security...Alexander Decker
 

Similar to Exploring dietary diversity, nutritional status of adolescents among farm households in Nigeria: do higher commercialization levels translate to better nutrition? (20)

Food security and nigeria’s agricultural promotion policy empirical and cros...
Food security and nigeria’s agricultural promotion policy  empirical and cros...Food security and nigeria’s agricultural promotion policy  empirical and cros...
Food security and nigeria’s agricultural promotion policy empirical and cros...
 
Exploring dietary diversity, nutritional status of adolescents among farm hou...
Exploring dietary diversity, nutritional status of adolescents among farm hou...Exploring dietary diversity, nutritional status of adolescents among farm hou...
Exploring dietary diversity, nutritional status of adolescents among farm hou...
 
Association Between Bio-fortification and Child Nutrition Among Smallholder H...
Association Between Bio-fortification and Child Nutrition Among Smallholder H...Association Between Bio-fortification and Child Nutrition Among Smallholder H...
Association Between Bio-fortification and Child Nutrition Among Smallholder H...
 
Gihan Fouad (National Nutrition Institute)• 2018 IFPRI Egypt Seminar: “Advanc...
Gihan Fouad (National Nutrition Institute)• 2018 IFPRI Egypt Seminar: “Advanc...Gihan Fouad (National Nutrition Institute)• 2018 IFPRI Egypt Seminar: “Advanc...
Gihan Fouad (National Nutrition Institute)• 2018 IFPRI Egypt Seminar: “Advanc...
 
Dietary Diversity Choices of Women: Evidence from Cassava Farming Households ...
Dietary Diversity Choices of Women: Evidence from Cassava Farming Households ...Dietary Diversity Choices of Women: Evidence from Cassava Farming Households ...
Dietary Diversity Choices of Women: Evidence from Cassava Farming Households ...
 
Addressing Extreme Poverty - Nutrition Security
Addressing Extreme Poverty - Nutrition SecurityAddressing Extreme Poverty - Nutrition Security
Addressing Extreme Poverty - Nutrition Security
 
Analysis of Rural Households Food Security Status in Dibatie District, Wester...
Analysis of Rural Households Food Security Status in Dibatie District, Wester...Analysis of Rural Households Food Security Status in Dibatie District, Wester...
Analysis of Rural Households Food Security Status in Dibatie District, Wester...
 
Khan21530.pdf
Khan21530.pdfKhan21530.pdf
Khan21530.pdf
 
Assessing Food Insecurity and Its Drivers among Smallholder Farming Household...
Assessing Food Insecurity and Its Drivers among Smallholder Farming Household...Assessing Food Insecurity and Its Drivers among Smallholder Farming Household...
Assessing Food Insecurity and Its Drivers among Smallholder Farming Household...
 
Mohieldin et al. - Unknown - The impact of feeding practices on prevalence of...
Mohieldin et al. - Unknown - The impact of feeding practices on prevalence of...Mohieldin et al. - Unknown - The impact of feeding practices on prevalence of...
Mohieldin et al. - Unknown - The impact of feeding practices on prevalence of...
 
Original article
Original articleOriginal article
Original article
 
Regional overview of diets and nutrition in South Asia
Regional overview of diets and nutrition in South AsiaRegional overview of diets and nutrition in South Asia
Regional overview of diets and nutrition in South Asia
 
https://www.jescae.com/index.php/gssr/article/view/440
https://www.jescae.com/index.php/gssr/article/view/440https://www.jescae.com/index.php/gssr/article/view/440
https://www.jescae.com/index.php/gssr/article/view/440
 
kgpians12
kgpians12kgpians12
kgpians12
 
Factors influencing the practice of exclusive breast feeding in rural communi...
Factors influencing the practice of exclusive breast feeding in rural communi...Factors influencing the practice of exclusive breast feeding in rural communi...
Factors influencing the practice of exclusive breast feeding in rural communi...
 
Prevalence of stunting and associated factors of children among 6 59 months a...
Prevalence of stunting and associated factors of children among 6 59 months a...Prevalence of stunting and associated factors of children among 6 59 months a...
Prevalence of stunting and associated factors of children among 6 59 months a...
 
Assess the Knowledge on Hazards of Junk Foods among Adolescents
Assess the Knowledge on Hazards of Junk Foods among AdolescentsAssess the Knowledge on Hazards of Junk Foods among Adolescents
Assess the Knowledge on Hazards of Junk Foods among Adolescents
 
Implications for Policy and Programming: Reflections from the RENEWAL Study,...
Implications for Policy and Programming: Reflections from the RENEWAL Study,...Implications for Policy and Programming: Reflections from the RENEWAL Study,...
Implications for Policy and Programming: Reflections from the RENEWAL Study,...
 
Influence of Mothers’ Participation in Intra-Household Decision Making on Nut...
Influence of Mothers’ Participation in Intra-Household Decision Making on Nut...Influence of Mothers’ Participation in Intra-Household Decision Making on Nut...
Influence of Mothers’ Participation in Intra-Household Decision Making on Nut...
 
Family income among small scale farmers a panacea for household food security...
Family income among small scale farmers a panacea for household food security...Family income among small scale farmers a panacea for household food security...
Family income among small scale farmers a panacea for household food security...
 

More from Olutosin Ademola Otekunrin

Countdown to the 2030 Global Goals: A Bibliometric Analysis of the Research T...
Countdown to the 2030 Global Goals: A Bibliometric Analysis of the Research T...Countdown to the 2030 Global Goals: A Bibliometric Analysis of the Research T...
Countdown to the 2030 Global Goals: A Bibliometric Analysis of the Research T...Olutosin Ademola Otekunrin
 
Investigating and Quantifying Food Insecurity in Nigeria: A Systematic Review
Investigating and Quantifying Food Insecurity in Nigeria: A Systematic Review Investigating and Quantifying Food Insecurity in Nigeria: A Systematic Review
Investigating and Quantifying Food Insecurity in Nigeria: A Systematic Review Olutosin Ademola Otekunrin
 
Measuring the economic performance of smallholder organic maize farms; Implic...
Measuring the economic performance of smallholder organic maize farms; Implic...Measuring the economic performance of smallholder organic maize farms; Implic...
Measuring the economic performance of smallholder organic maize farms; Implic...Olutosin Ademola Otekunrin
 
Prospects for using pesticides in agriculture
Prospects for using pesticides in agriculture Prospects for using pesticides in agriculture
Prospects for using pesticides in agriculture Olutosin Ademola Otekunrin
 
COVID-19 Pandemic impacted food security and caused psychosocial stress in so...
COVID-19 Pandemic impacted food security and caused psychosocial stress in so...COVID-19 Pandemic impacted food security and caused psychosocial stress in so...
COVID-19 Pandemic impacted food security and caused psychosocial stress in so...Olutosin Ademola Otekunrin
 
Assessing agricultural commercialization and rural infrastructure development...
Assessing agricultural commercialization and rural infrastructure development...Assessing agricultural commercialization and rural infrastructure development...
Assessing agricultural commercialization and rural infrastructure development...Olutosin Ademola Otekunrin
 
Exploring women's preferences for attributes of long-acting reversible contr...
Exploring women's preferences for attributes of long-acting  reversible contr...Exploring women's preferences for attributes of long-acting  reversible contr...
Exploring women's preferences for attributes of long-acting reversible contr...Olutosin Ademola Otekunrin
 
Assessing agricultural commercialization and rural infrastructure development...
Assessing agricultural commercialization and rural infrastructure development...Assessing agricultural commercialization and rural infrastructure development...
Assessing agricultural commercialization and rural infrastructure development...Olutosin Ademola Otekunrin
 
How far has Africa gone in achieving zero hunger target? evidence from Nigeria
How far has Africa gone in achieving zero hunger target? evidence from Nigeria How far has Africa gone in achieving zero hunger target? evidence from Nigeria
How far has Africa gone in achieving zero hunger target? evidence from Nigeria Olutosin Ademola Otekunrin
 
Assessing the determinants of agricultural commercialization and challenges c...
Assessing the determinants of agricultural commercialization and challenges c...Assessing the determinants of agricultural commercialization and challenges c...
Assessing the determinants of agricultural commercialization and challenges c...Olutosin Ademola Otekunrin
 
Biological properties and polyphenols content of Algerian Cistus salviifolius...
Biological properties and polyphenols content of Algerian Cistus salviifolius...Biological properties and polyphenols content of Algerian Cistus salviifolius...
Biological properties and polyphenols content of Algerian Cistus salviifolius...Olutosin Ademola Otekunrin
 
Plant-derived stimulants and psychoactive substances – social and economic as...
Plant-derived stimulants and psychoactive substances – social and economic as...Plant-derived stimulants and psychoactive substances – social and economic as...
Plant-derived stimulants and psychoactive substances – social and economic as...Olutosin Ademola Otekunrin
 
How far has Africa gone in achieving sustainable development goals? Exploring...
How far has Africa gone in achieving sustainable development goals? Exploring...How far has Africa gone in achieving sustainable development goals? Exploring...
How far has Africa gone in achieving sustainable development goals? Exploring...Olutosin Ademola Otekunrin
 
COVID-19 in Nigeria: Why continuous spike in cases?
COVID-19 in Nigeria: Why continuous spike in cases?COVID-19 in Nigeria: Why continuous spike in cases?
COVID-19 in Nigeria: Why continuous spike in cases?Olutosin Ademola Otekunrin
 
STUDENTS’ ATTITUDE AND ACADEMIC PERFORMANCE IN AGRICULTURAL SCIENCE: A CASE S...
STUDENTS’ ATTITUDE AND ACADEMIC PERFORMANCE IN AGRICULTURAL SCIENCE: A CASE S...STUDENTS’ ATTITUDE AND ACADEMIC PERFORMANCE IN AGRICULTURAL SCIENCE: A CASE S...
STUDENTS’ ATTITUDE AND ACADEMIC PERFORMANCE IN AGRICULTURAL SCIENCE: A CASE S...Olutosin Ademola Otekunrin
 
Agricultural Science Education in Secondary Schools of Ibadan, Nigeria: An An...
Agricultural Science Education in Secondary Schools of Ibadan, Nigeria: An An...Agricultural Science Education in Secondary Schools of Ibadan, Nigeria: An An...
Agricultural Science Education in Secondary Schools of Ibadan, Nigeria: An An...Olutosin Ademola Otekunrin
 
Investigating Academic Performance in Practical Agriculture: Evidence from Si...
Investigating Academic Performance in Practical Agriculture: Evidence from Si...Investigating Academic Performance in Practical Agriculture: Evidence from Si...
Investigating Academic Performance in Practical Agriculture: Evidence from Si...Olutosin Ademola Otekunrin
 
Is Africa Ready for the SDG 2 (Zero Hunger) Target by 2030?
Is Africa Ready for the SDG 2 (Zero Hunger) Target by 2030?Is Africa Ready for the SDG 2 (Zero Hunger) Target by 2030?
Is Africa Ready for the SDG 2 (Zero Hunger) Target by 2030?Olutosin Ademola Otekunrin
 
Test positivity – Evaluation of a new metric to assess epidemic dispersal med...
Test positivity – Evaluation of a new metric to assess epidemic dispersal med...Test positivity – Evaluation of a new metric to assess epidemic dispersal med...
Test positivity – Evaluation of a new metric to assess epidemic dispersal med...Olutosin Ademola Otekunrin
 
Farmers’ Preferences for Farming Enclaves in Forest Reserves of South-West, N...
Farmers’ Preferences for Farming Enclaves in Forest Reserves of South-West, N...Farmers’ Preferences for Farming Enclaves in Forest Reserves of South-West, N...
Farmers’ Preferences for Farming Enclaves in Forest Reserves of South-West, N...Olutosin Ademola Otekunrin
 

More from Olutosin Ademola Otekunrin (20)

Countdown to the 2030 Global Goals: A Bibliometric Analysis of the Research T...
Countdown to the 2030 Global Goals: A Bibliometric Analysis of the Research T...Countdown to the 2030 Global Goals: A Bibliometric Analysis of the Research T...
Countdown to the 2030 Global Goals: A Bibliometric Analysis of the Research T...
 
Investigating and Quantifying Food Insecurity in Nigeria: A Systematic Review
Investigating and Quantifying Food Insecurity in Nigeria: A Systematic Review Investigating and Quantifying Food Insecurity in Nigeria: A Systematic Review
Investigating and Quantifying Food Insecurity in Nigeria: A Systematic Review
 
Measuring the economic performance of smallholder organic maize farms; Implic...
Measuring the economic performance of smallholder organic maize farms; Implic...Measuring the economic performance of smallholder organic maize farms; Implic...
Measuring the economic performance of smallholder organic maize farms; Implic...
 
Prospects for using pesticides in agriculture
Prospects for using pesticides in agriculture Prospects for using pesticides in agriculture
Prospects for using pesticides in agriculture
 
COVID-19 Pandemic impacted food security and caused psychosocial stress in so...
COVID-19 Pandemic impacted food security and caused psychosocial stress in so...COVID-19 Pandemic impacted food security and caused psychosocial stress in so...
COVID-19 Pandemic impacted food security and caused psychosocial stress in so...
 
Assessing agricultural commercialization and rural infrastructure development...
Assessing agricultural commercialization and rural infrastructure development...Assessing agricultural commercialization and rural infrastructure development...
Assessing agricultural commercialization and rural infrastructure development...
 
Exploring women's preferences for attributes of long-acting reversible contr...
Exploring women's preferences for attributes of long-acting  reversible contr...Exploring women's preferences for attributes of long-acting  reversible contr...
Exploring women's preferences for attributes of long-acting reversible contr...
 
Assessing agricultural commercialization and rural infrastructure development...
Assessing agricultural commercialization and rural infrastructure development...Assessing agricultural commercialization and rural infrastructure development...
Assessing agricultural commercialization and rural infrastructure development...
 
How far has Africa gone in achieving zero hunger target? evidence from Nigeria
How far has Africa gone in achieving zero hunger target? evidence from Nigeria How far has Africa gone in achieving zero hunger target? evidence from Nigeria
How far has Africa gone in achieving zero hunger target? evidence from Nigeria
 
Assessing the determinants of agricultural commercialization and challenges c...
Assessing the determinants of agricultural commercialization and challenges c...Assessing the determinants of agricultural commercialization and challenges c...
Assessing the determinants of agricultural commercialization and challenges c...
 
Biological properties and polyphenols content of Algerian Cistus salviifolius...
Biological properties and polyphenols content of Algerian Cistus salviifolius...Biological properties and polyphenols content of Algerian Cistus salviifolius...
Biological properties and polyphenols content of Algerian Cistus salviifolius...
 
Plant-derived stimulants and psychoactive substances – social and economic as...
Plant-derived stimulants and psychoactive substances – social and economic as...Plant-derived stimulants and psychoactive substances – social and economic as...
Plant-derived stimulants and psychoactive substances – social and economic as...
 
How far has Africa gone in achieving sustainable development goals? Exploring...
How far has Africa gone in achieving sustainable development goals? Exploring...How far has Africa gone in achieving sustainable development goals? Exploring...
How far has Africa gone in achieving sustainable development goals? Exploring...
 
COVID-19 in Nigeria: Why continuous spike in cases?
COVID-19 in Nigeria: Why continuous spike in cases?COVID-19 in Nigeria: Why continuous spike in cases?
COVID-19 in Nigeria: Why continuous spike in cases?
 
STUDENTS’ ATTITUDE AND ACADEMIC PERFORMANCE IN AGRICULTURAL SCIENCE: A CASE S...
STUDENTS’ ATTITUDE AND ACADEMIC PERFORMANCE IN AGRICULTURAL SCIENCE: A CASE S...STUDENTS’ ATTITUDE AND ACADEMIC PERFORMANCE IN AGRICULTURAL SCIENCE: A CASE S...
STUDENTS’ ATTITUDE AND ACADEMIC PERFORMANCE IN AGRICULTURAL SCIENCE: A CASE S...
 
Agricultural Science Education in Secondary Schools of Ibadan, Nigeria: An An...
Agricultural Science Education in Secondary Schools of Ibadan, Nigeria: An An...Agricultural Science Education in Secondary Schools of Ibadan, Nigeria: An An...
Agricultural Science Education in Secondary Schools of Ibadan, Nigeria: An An...
 
Investigating Academic Performance in Practical Agriculture: Evidence from Si...
Investigating Academic Performance in Practical Agriculture: Evidence from Si...Investigating Academic Performance in Practical Agriculture: Evidence from Si...
Investigating Academic Performance in Practical Agriculture: Evidence from Si...
 
Is Africa Ready for the SDG 2 (Zero Hunger) Target by 2030?
Is Africa Ready for the SDG 2 (Zero Hunger) Target by 2030?Is Africa Ready for the SDG 2 (Zero Hunger) Target by 2030?
Is Africa Ready for the SDG 2 (Zero Hunger) Target by 2030?
 
Test positivity – Evaluation of a new metric to assess epidemic dispersal med...
Test positivity – Evaluation of a new metric to assess epidemic dispersal med...Test positivity – Evaluation of a new metric to assess epidemic dispersal med...
Test positivity – Evaluation of a new metric to assess epidemic dispersal med...
 
Farmers’ Preferences for Farming Enclaves in Forest Reserves of South-West, N...
Farmers’ Preferences for Farming Enclaves in Forest Reserves of South-West, N...Farmers’ Preferences for Farming Enclaves in Forest Reserves of South-West, N...
Farmers’ Preferences for Farming Enclaves in Forest Reserves of South-West, N...
 

Recently uploaded

_Math 4-Q4 Week 5.pptx Steps in Collecting Data
_Math 4-Q4 Week 5.pptx Steps in Collecting Data_Math 4-Q4 Week 5.pptx Steps in Collecting Data
_Math 4-Q4 Week 5.pptx Steps in Collecting DataJhengPantaleon
 
Solving Puzzles Benefits Everyone (English).pptx
Solving Puzzles Benefits Everyone (English).pptxSolving Puzzles Benefits Everyone (English).pptx
Solving Puzzles Benefits Everyone (English).pptxOH TEIK BIN
 
Sanyam Choudhary Chemistry practical.pdf
Sanyam Choudhary Chemistry practical.pdfSanyam Choudhary Chemistry practical.pdf
Sanyam Choudhary Chemistry practical.pdfsanyamsingh5019
 
Measures of Central Tendency: Mean, Median and Mode
Measures of Central Tendency: Mean, Median and ModeMeasures of Central Tendency: Mean, Median and Mode
Measures of Central Tendency: Mean, Median and ModeThiyagu K
 
Arihant handbook biology for class 11 .pdf
Arihant handbook biology for class 11 .pdfArihant handbook biology for class 11 .pdf
Arihant handbook biology for class 11 .pdfchloefrazer622
 
Hybridoma Technology ( Production , Purification , and Application )
Hybridoma Technology  ( Production , Purification , and Application  ) Hybridoma Technology  ( Production , Purification , and Application  )
Hybridoma Technology ( Production , Purification , and Application ) Sakshi Ghasle
 
BASLIQ CURRENT LOOKBOOK LOOKBOOK(1) (1).pdf
BASLIQ CURRENT LOOKBOOK  LOOKBOOK(1) (1).pdfBASLIQ CURRENT LOOKBOOK  LOOKBOOK(1) (1).pdf
BASLIQ CURRENT LOOKBOOK LOOKBOOK(1) (1).pdfSoniaTolstoy
 
Accessible design: Minimum effort, maximum impact
Accessible design: Minimum effort, maximum impactAccessible design: Minimum effort, maximum impact
Accessible design: Minimum effort, maximum impactdawncurless
 
The Most Excellent Way | 1 Corinthians 13
The Most Excellent Way | 1 Corinthians 13The Most Excellent Way | 1 Corinthians 13
The Most Excellent Way | 1 Corinthians 13Steve Thomason
 
Software Engineering Methodologies (overview)
Software Engineering Methodologies (overview)Software Engineering Methodologies (overview)
Software Engineering Methodologies (overview)eniolaolutunde
 
Incoming and Outgoing Shipments in 1 STEP Using Odoo 17
Incoming and Outgoing Shipments in 1 STEP Using Odoo 17Incoming and Outgoing Shipments in 1 STEP Using Odoo 17
Incoming and Outgoing Shipments in 1 STEP Using Odoo 17Celine George
 
Crayon Activity Handout For the Crayon A
Crayon Activity Handout For the Crayon ACrayon Activity Handout For the Crayon A
Crayon Activity Handout For the Crayon AUnboundStockton
 
Presiding Officer Training module 2024 lok sabha elections
Presiding Officer Training module 2024 lok sabha electionsPresiding Officer Training module 2024 lok sabha elections
Presiding Officer Training module 2024 lok sabha electionsanshu789521
 
Kisan Call Centre - To harness potential of ICT in Agriculture by answer farm...
Kisan Call Centre - To harness potential of ICT in Agriculture by answer farm...Kisan Call Centre - To harness potential of ICT in Agriculture by answer farm...
Kisan Call Centre - To harness potential of ICT in Agriculture by answer farm...Krashi Coaching
 
Grant Readiness 101 TechSoup and Remy Consulting
Grant Readiness 101 TechSoup and Remy ConsultingGrant Readiness 101 TechSoup and Remy Consulting
Grant Readiness 101 TechSoup and Remy ConsultingTechSoup
 
SOCIAL AND HISTORICAL CONTEXT - LFTVD.pptx
SOCIAL AND HISTORICAL CONTEXT - LFTVD.pptxSOCIAL AND HISTORICAL CONTEXT - LFTVD.pptx
SOCIAL AND HISTORICAL CONTEXT - LFTVD.pptxiammrhaywood
 
18-04-UA_REPORT_MEDIALITERAСY_INDEX-DM_23-1-final-eng.pdf
18-04-UA_REPORT_MEDIALITERAСY_INDEX-DM_23-1-final-eng.pdf18-04-UA_REPORT_MEDIALITERAСY_INDEX-DM_23-1-final-eng.pdf
18-04-UA_REPORT_MEDIALITERAСY_INDEX-DM_23-1-final-eng.pdfssuser54595a
 
A Critique of the Proposed National Education Policy Reform
A Critique of the Proposed National Education Policy ReformA Critique of the Proposed National Education Policy Reform
A Critique of the Proposed National Education Policy ReformChameera Dedduwage
 
Concept of Vouching. B.Com(Hons) /B.Compdf
Concept of Vouching. B.Com(Hons) /B.CompdfConcept of Vouching. B.Com(Hons) /B.Compdf
Concept of Vouching. B.Com(Hons) /B.CompdfUmakantAnnand
 

Recently uploaded (20)

_Math 4-Q4 Week 5.pptx Steps in Collecting Data
_Math 4-Q4 Week 5.pptx Steps in Collecting Data_Math 4-Q4 Week 5.pptx Steps in Collecting Data
_Math 4-Q4 Week 5.pptx Steps in Collecting Data
 
Solving Puzzles Benefits Everyone (English).pptx
Solving Puzzles Benefits Everyone (English).pptxSolving Puzzles Benefits Everyone (English).pptx
Solving Puzzles Benefits Everyone (English).pptx
 
Sanyam Choudhary Chemistry practical.pdf
Sanyam Choudhary Chemistry practical.pdfSanyam Choudhary Chemistry practical.pdf
Sanyam Choudhary Chemistry practical.pdf
 
Measures of Central Tendency: Mean, Median and Mode
Measures of Central Tendency: Mean, Median and ModeMeasures of Central Tendency: Mean, Median and Mode
Measures of Central Tendency: Mean, Median and Mode
 
Arihant handbook biology for class 11 .pdf
Arihant handbook biology for class 11 .pdfArihant handbook biology for class 11 .pdf
Arihant handbook biology for class 11 .pdf
 
Hybridoma Technology ( Production , Purification , and Application )
Hybridoma Technology  ( Production , Purification , and Application  ) Hybridoma Technology  ( Production , Purification , and Application  )
Hybridoma Technology ( Production , Purification , and Application )
 
BASLIQ CURRENT LOOKBOOK LOOKBOOK(1) (1).pdf
BASLIQ CURRENT LOOKBOOK  LOOKBOOK(1) (1).pdfBASLIQ CURRENT LOOKBOOK  LOOKBOOK(1) (1).pdf
BASLIQ CURRENT LOOKBOOK LOOKBOOK(1) (1).pdf
 
Accessible design: Minimum effort, maximum impact
Accessible design: Minimum effort, maximum impactAccessible design: Minimum effort, maximum impact
Accessible design: Minimum effort, maximum impact
 
The Most Excellent Way | 1 Corinthians 13
The Most Excellent Way | 1 Corinthians 13The Most Excellent Way | 1 Corinthians 13
The Most Excellent Way | 1 Corinthians 13
 
Software Engineering Methodologies (overview)
Software Engineering Methodologies (overview)Software Engineering Methodologies (overview)
Software Engineering Methodologies (overview)
 
Incoming and Outgoing Shipments in 1 STEP Using Odoo 17
Incoming and Outgoing Shipments in 1 STEP Using Odoo 17Incoming and Outgoing Shipments in 1 STEP Using Odoo 17
Incoming and Outgoing Shipments in 1 STEP Using Odoo 17
 
Crayon Activity Handout For the Crayon A
Crayon Activity Handout For the Crayon ACrayon Activity Handout For the Crayon A
Crayon Activity Handout For the Crayon A
 
Model Call Girl in Bikash Puri Delhi reach out to us at 🔝9953056974🔝
Model Call Girl in Bikash Puri  Delhi reach out to us at 🔝9953056974🔝Model Call Girl in Bikash Puri  Delhi reach out to us at 🔝9953056974🔝
Model Call Girl in Bikash Puri Delhi reach out to us at 🔝9953056974🔝
 
Presiding Officer Training module 2024 lok sabha elections
Presiding Officer Training module 2024 lok sabha electionsPresiding Officer Training module 2024 lok sabha elections
Presiding Officer Training module 2024 lok sabha elections
 
Kisan Call Centre - To harness potential of ICT in Agriculture by answer farm...
Kisan Call Centre - To harness potential of ICT in Agriculture by answer farm...Kisan Call Centre - To harness potential of ICT in Agriculture by answer farm...
Kisan Call Centre - To harness potential of ICT in Agriculture by answer farm...
 
Grant Readiness 101 TechSoup and Remy Consulting
Grant Readiness 101 TechSoup and Remy ConsultingGrant Readiness 101 TechSoup and Remy Consulting
Grant Readiness 101 TechSoup and Remy Consulting
 
SOCIAL AND HISTORICAL CONTEXT - LFTVD.pptx
SOCIAL AND HISTORICAL CONTEXT - LFTVD.pptxSOCIAL AND HISTORICAL CONTEXT - LFTVD.pptx
SOCIAL AND HISTORICAL CONTEXT - LFTVD.pptx
 
18-04-UA_REPORT_MEDIALITERAСY_INDEX-DM_23-1-final-eng.pdf
18-04-UA_REPORT_MEDIALITERAСY_INDEX-DM_23-1-final-eng.pdf18-04-UA_REPORT_MEDIALITERAСY_INDEX-DM_23-1-final-eng.pdf
18-04-UA_REPORT_MEDIALITERAСY_INDEX-DM_23-1-final-eng.pdf
 
A Critique of the Proposed National Education Policy Reform
A Critique of the Proposed National Education Policy ReformA Critique of the Proposed National Education Policy Reform
A Critique of the Proposed National Education Policy Reform
 
Concept of Vouching. B.Com(Hons) /B.Compdf
Concept of Vouching. B.Com(Hons) /B.CompdfConcept of Vouching. B.Com(Hons) /B.Compdf
Concept of Vouching. B.Com(Hons) /B.Compdf
 

Exploring dietary diversity, nutritional status of adolescents among farm households in Nigeria: do higher commercialization levels translate to better nutrition?

  • 1. Exploring dietary diversity, nutritional status of adolescents among farm households in 1 Nigeria: do higher commercialization levels translate to better nutrition? 2 3 4 AuthorAcceptedManuscript (AAM) from Nutrition and Food Science: 25 June 2022 5 DOI: https://doi.org/10.1108/NFS-03-2022-0104 6 7 8 Abstract 9 Purpose: 10 This study explored dietary diversity and nutritional status of adolescents among rural farm households in 11 Southwestern Nigeria. It analyses if higher commercialization levels of farm households translate to better 12 nutrition. 13 Design/methodology/approach: The study was conducted in Ogun and Oyo States of Southwestern 14 Nigeria, utilizing primary data from 352 farm households with a total of 160 adolescent members. The 15 individual version of dietary diversity score (DDS) of nine (9) food groups was used to calculate 16 adolescent DDS over a 24-h recall period, World Health Organization (WHO) AnthroPlus software was 17 used in analyzing adolescents’ anthropometric data (height-for-age z-score and BMI-for-age z-score) 18 while household crop commercialization index (CCI) was estimated for each farm household. Separate 19 logit models were used to examine the drivers of adolescents’ dietary diversity and malnutrition. 20 Findings: The study findings indicated that 100% of the adolescents consumed starchy staples while 0%, 21 3.1% and 12.5% consumed organ meat, milk/milk poducts, and eggs respectively. Results revealed that 22 74.1% and 21.2% of boys were stunted and thin while the prevalence in adolescent girls was 50.7% and 23 9.3% respectively. Prevalence of stunting was found to be very high (60-83%) in all the four CCI levels’ 24 households indicating that belonging to highly commercialized households (CCI 3-4) may not necessarily 25 translate to better nutrition of adolescent members. Food expenditure (p< 0.01) and access to piped water 26 (p< 0.01) negatively influenced adolescents’ stunting mainly due to lower expediture on food items and 27 lower percent of household having access to piped water respectively while education (p< 0.01) had 28 positive effect on adolescents’ dietary diversity. 29 Originality/value: Previous studies have contributed to the body of knowledge concerning the link 30 between agricultural commercialization and nutrition using under-five children of the households. 31 However, this is the first study that investigated the influence of CCI on DDS and nutritional status of 32 adolescent members of farm households in Nigeria. Our study fills this existing knowledge gap in 33 investigating adolescents’ dietary diversity and malnutrition among smallholder farm households. 34 35 Keywords: Farm households; Crop Commercialization Index (CCI); malnutrition; stunting; WHO 36 AnthroPlus; dietary diversity score. 37 38 1. Introduction 39 Adolescence is a unique phase of human life with major developmental experiences ushering the 40 much anticipated transition from childhood to adulthood. The health and wellbeing of the children and 41
  • 2. adolescents (10-19 y old) is of utmost importance to every nation as they are regarded as one of the 42 critical determinants of future economic and societal development (WHO, 2021). In 2020, adolescent (10- 43 19 y old) population reached 1.25 billion, with 16% share of the world’s population. Among countries 44 with highest number of adolescents in the world, India was ranked 1st (252.2 million), followed by China 45 (166.6 million) and Nigeria was 3rd (47.7 million) in 2020 (UNICEF, 2021). However, more than 50% of 46 all adolescents globally reside in Asia, with South Asia having the highest number (306.04 million) 47 among all regions while Sub-Saharan Africa (SSA) is the region with the highest population proportion 48 (23%) of adolescents (10-19 y old) in 2020 (UNICEF, 2021). 49 Globally, the prevalence of overweight among children and adolescent has gone up, from 9.5% to 50 12.5% among boys (5-9 y old) and 10.0% to 12.6% among girls (5-9 y old) from 2010 to 2019 while 51 among adolescents aged 10-19 y (male), it increased from 8.1% in 2010 to 12.5% in 2019 and among 52 female adolesecents (10-19 y old), it went up from 10.3% in 2010 to 12.9% in 2019. However, children 53 and adolescents’prevalence of thinness has witnessed a little decline since 2010 with -1.9% (boys) and - 54 0.7% (girls) reduction among 5-9 y childen and -1.1% (male) and -0.2% (girls) decrease among 55 adolescents (10-19 y old) from 2010-2019 (GNR, 2021). The young children and adolescents (5-19 y old) 56 are among the most vulnerable groups of the population usually burdened by unhealthy diets and 57 carbohydrate-dense foods in both developed and low-and middle-income countries (Global Panel, 2016; 58 IFPRI, 2017; GNR, 2021; Otekunrin et al., 2022; Otekunrin, 2022). 59 Healthy and diversified dietary composition of young children and adolescents are pivotal to their 60 growth and developent. The consumption of lose-lose diets predispose this group to different forms of 61 malnutrition (stunting, overweight, micronutrient deficiency) while the adolescent girls of child-bearing 62 age are exposed to burdens of malnutrition (Global Panel, 2016; Garnett, 2016; Willet et al., 2019; 63 Otekunrin et al., 2022). However, other members of the households also need to consume healthy and 64 diversified diets for good nutrition and healthy living. Likewise, diverse diet is viewed as a health guage 65 that indicates the worth of the diets consumed and regarded as very crucial in estimating food and 66 nutrition security of individuals or households (Mirmiran et al., 2006; Azadbahkt and Esmailzader, 2012; 67 Obayelu and Osho, 2020; Otekunrin et al., 2022). However, the challenge of hunger and food insecurity 68 was experienced by almost every country in 2020. Globally, it was estimated that 161 million more 69 people experienced hunger in 2020 more than that of 2019 while about 2.4 billion of the population did 70 not have access to quality and sufficient food in 2020, reflecting an unprecedented increase of 320 million 71 in 12 months period (FAO et al., 2021). 72 Moreover, high-quality diets was far from the reach of about 3 billion people in 2019, owing to 73 the soaring cost of healthy diets, ever-increasing poverty levels in developing nations, and income 74 inequality in all regions of the world. More so, high prevalence of food insecurity was related to the rising 75 unaffordable healthy diets.The emergence of COVID-19 has really aggravated hunger and food insecurity 76 in all regions of the world, putting so much pressure on the food systems and health sector in every 77 country (FAO et al., 2021). With 282 million malnourished population (1/3 of global population) found 78 in Africa in 2020, malnutrition remained a serious challenge in the region (FAO et al., 2021). However, a 79 study revealed that many of the malnourished population are high among smallholder farm households in 80 poor nations who depend mostly on agriculture as means of livelihood (IFPRI 2017; Otekunrin et al., 81 2022). Good health of members of farm households mostly adolescent members (future head of 82 households) are pivotal to their agricultural productivity, produce marketing and that of the nation’s food 83 security strategy. 84
  • 3. Agricultural commercialization occurs when agricultural operations depend largely on the market 85 for the sale of produce and for the purchase of production inputs, and labour (APRA, 2018). More so, 86 Agricultural commercialization refers to increased market transactions in a position of enjoying gains 87 from specialization (Carletto et al., 2017; Opondo et al., 2017; Otekunrin, 2022; Otekunrin et al., 2022). 88 The estimaion of the extent of commercialization of smallholder agriculture from the output side of 89 production gives us the opportunity to take advantage of marketing behaviour from (small-scale to full 90 commercialization) of individual households (Carletto et al. 2017; Opondo et al. 2017; Otekunrin et al., 91 2022). 92 Previous studies in Africa, such as Northern Ethiopia found high level of stunting (26.5%) and 93 thinness (58.3%) among adolescent students (Melaku et al., 2015). More so, a study in Northwest 94 Ethiopia also reported 21.8% stunting and 16.9% thinness among school-aged adolescents (Kebede et al., 95 2021). However, some studies also reported nutrition outcomes and dietary diversity (DD) of both under- 96 five children and women of rural farm households in Nigeria (Lawal and Samuel, 2010; Babatunde et al., 97 2011; Ukegbu and Ogu, 2017; Ogunnaike et al., 2020; Otekunrin et al., 2022). Likewise, few works have 98 described the relationships that existed between agricultural commercialization and nutritional status of 99 under-five children (Okezie and Nwosu, 2007; Carletto et al., 2017) while Otekunrin et al (2022) 100 investigated DD of young children of farm households in Southwestern Nigeria. From literature, studies 101 on agricultural commercialization, dietary diversity, and nutrition outcomes nexus among adolescent 102 members of farm households have not yet received research priority. 103 However, from our knowledge, this study is the first that focuses on the effect of agricultural 104 commercialization on dietary diversity and nutrition outcomes of adolescent members of rural farm 105 households. This study is set to fill knowledge gap concerning the dietary pattterns and nutrition 106 outcomes of adolescent members of smallholder farm households. The study employed primary data and 107 used individual dietary diversity score (IDDS) module to calculate the DDS of the adolescent members of 108 the cassava farm households while WHO AnthroPlus software was used to determine the nutrition 109 outcomes (stunting and thinness) of the adolescents (boys and girls). The result of the study is crucial to 110 the stakeholders in prioritizing the implementation of nutrition-sensitive policy interventions that will 111 improve the health and standard of living of adolescents as well as other members of the households. 112 2. Methodology 113 2.1. The study area 114 This study was conducted in Southwestern Nigeria. The country is one of the West African 115 countries with land mass of 923,768 square kilometer (Maps of World 2021; Otekunrin et al., 2022). The 116 region has six (6) states namely; Lagos, Ekiti, Ogun, Ondo, Osun and Oyo. However, majority of the 117 people in this part of the country speak Yoruba fluently but not without diverse dialects within and across 118 the states. The study was carried out in Ogun and Oyo states, Southwestern Nigeria. Agriculture is the 119 major occupation of the rural people in this region (Lawal and Samuel 2010; Otekunrin, 2022). 120 2.1. Sampling and data collection procedure 121 This study utilized primary data which was collected through multi-stage sampling procedure. In 122 the first stage, two (Ogun and Oyo states) out of six (6) cassava producing states in the Southwestern 123 Nigeria was randomly selected. The stage two included the selection of 5 Local Government areas 124 (LGAs) from Oyo state and 3 LGAs from Ogun state giving a total of eight (8) LGAs in the two states. 125 The third stage included the selection of 24 villages from the 8 LGAs while stage four included selection 126
  • 4. of 16 smallholder cassava farm households resulting in 384 farm households. The data were collected 127 with the help of structured questionnaire which include; the household socioeconomic factors, 128 adolescents’ DDS, expenditure on food and other germane household and adolescent-related issues. 129 Thirty-two (32) of the questionnaires were unusable after data cleaning. In the 352 farm households, there 130 were 160 adolescent members. However, anthropometric measurements such as age of adolescents, 131 gender, height and weight were measured and recorded. The number of food groups consumed by the 132 adolescents were recorded and used in calculating their DDS while measurement details were used in 133 obtaining malnutrition indices such stunting-height-for-age z-score (HAZ) and thinness-body mass index 134 z-score (BAZ). 135 136 2.2. Data Analysis 137 2.2.1. Evaluating the levels of agricultural commercialization 138 The commercialization levels of smallholder cassava farming households in the study areas were 139 estimated, adapting the Crop Commercialization Index (CCI) by Strasberg et al., 1999, Carletto et al., 140 2017; Otekunrin et al., 2022 which is expressed as: 141 142 𝐶𝐶𝐼𝑖 = 𝐺𝑟𝑜𝑠𝑠 𝑣𝑎𝑙𝑢𝑒 𝑜𝑓 𝑐𝑟𝑜𝑝 𝑠𝑎𝑙𝑒ℎℎ𝑖, 𝑦𝑒𝑎𝑟𝑗 𝐺𝑟𝑜𝑠𝑠 𝑣𝑎𝑙𝑢𝑒 𝑜𝑓 𝑎𝑙𝑙 𝑐𝑟𝑜𝑝 𝑝𝑟𝑜𝑑𝑢𝑐𝑡𝑖𝑜𝑛ℎℎ𝑖,𝑦𝑒𝑎𝑟𝑗 × 100 (1) 143 We have ℎℎ𝑖 as the 𝑖𝑡ℎ household in year j. 144 Using this method, agricultural commercialization is represented by a continuum from real 145 subsistence (𝐶𝐶𝐼𝑖 = 0) to full commercialization (𝐶𝐶𝐼𝑖 = 100). Using this method, cassava farm 146 households were categorized on their commercialization levels. Farm households that did not participate 147 in the sale of cassava roots were grouped as (i) zero level households (CCI 1 = 0%) while participants 148 were classified into; (ii) low level (CCI 2 =1-49%) (iii) medium-high level (CCI 3 = 50-75%) and (iv) 149 very- high level (CCI 4 = >75%) of commercialization (Otekunrin, 2022; Otekunrin et al., 2022). 150 151 2.2.2. Measuring individual dietary diversity score (IDDS) for adolescents 152 The IDDS for adolescents helps in detemining the individual member of the household dietary 153 pattern in a particular period of time such as 30-d, 7-d, and 24-h recall period. Nine (9) food groups (FG) 154 was adapted for adolescents aged 10-19 y old. However, the minimum of 4 food groups or more out of 9 155 was used (Kennedy et al., 2010a, b; Steyn et al., 2014; Otekunrin et al., 2022). It is worthy of note that 156 IDDS capured all foods consumed by specific individual irespective of how the foods were prepared 157 whether at home or outside. The food groups are: (i) Starchy Staples, (ii) Dark green leafy vegetables, (iii) 158 Other vitamin A rich fruits and vegetables (a combination of vitamin A rich vegetables and tubers and 159 vitamin A rich fruit), (iv) Other fruits and vegetables (a combination of other fruit and other vegetables), 160 (v) Organ meat (offals), (vi) Meat and fish, (vii) Eggs, (viii) Legumes, nuts and seeds, (ix) Milk and milk 161 products used (Kennedy et al., 2010; Steyn et al., 2014; Uzosike et al., 2020; Otekunrin et al., 2022). 162 The DDS of adolescents was determined by summing the number of different food groups 163 consumed over 24-h recall period while a score of 1 was assigned to each food group resulting in a total 164 of 9 points. The percentage of adolesents meeting up the minimum of 4 food groups out of 9 was 165 calculated. This means an adolescent having DDS less than 4 is regarded as having low DDS. 166 167
  • 5. 2.2.3. Anthropometric measurements of adolescents 168 Anthropometry is a human body measurements which is commonly used to obtain crucial 169 nutrition details about a sample or population (Babatunde et al., 2011). Previous rural farm household 170 studies have applied anthropometric data to under-five children (Babatunde et al., 2011; Ogunnaike et al., 171 2020). Empirical studies on anthropometric measurements of adolescent members of households 172 especially rural farm households are scare. The anthropometric measurements for adolescents (10-19 y 173 old) were measured using stunting (HAZ) and thinness (BAZ). The anthropometric indices of adolescent 174 members of cassava farm households were obtained for this study. These are stunting and thinness. 175 However, adolescents having HAZ < -2 Standard Deviation (SD) and < -3SD compared to the 2007 176 WHO reference were classified as stunting and severe stunting while BAZ < -2SD and < -3SD referred to 177 as thinness and severe thinness respectively (de Onis et al., 2007; Bhargava et al., 2020). The 178 anthropometric analysis for 160 sampled adolescents of cassava farm households was analyzed using the 179 WHO AnthroPlus software (WHO, 2009; Bhargava et al. 2020). 180 2.2.4. Modelling the drivers of adolescents’ dietary diversity and malnutrition 181 The determinants of dietary diversity (DD) among adolescent members of cassava farm 182 households were analyzed using logit regression model (Otekunrin et al., 2022). The choice of this model 183 was appropriate based on the fact that the regressand (adolescents DDS) is binary in nature and 184 categorized as 1 if an adolescent obtains 4 or more food groups out of 9, and zero otherwise, given as a 185 function of a vector of regressors (explanatory variables) assumed to affect DD of adolescents of cassava 186 farm households. The explanatory variables used in the model are; adolescent age, gender, household 187 head year of schooling, farm size, household size, farm income, non-farm income, food expenditure, 188 household primary occupation, transport cost, access to healthcare, access to electricity, access to toilet, 189 access to nutrition training and crop sold ratio (commercialization levels). Following Gujarati and Porter 190 (2009), Otekunrin et al (2022) the logit regression is expressed as: 191 𝐿𝑜𝑔𝑖𝑡 (𝑝) = 𝑙𝑛 ( 𝑝 1−𝑝 ) = 𝛽0 + 𝛽𝑖𝑋𝑖 + 𝑈𝑖 (2) 192 where 𝑝 denotes the probability of having DD of 4 or more food groups out of 9, the 𝛽𝑖′𝑠 are the 193 parameter estimates of the regressors, the 𝑋𝑖′𝑠 represent the regressors and 𝑈𝑖′𝑠 are the random error 194 terms (Gujarati and Porter, 2009; Otekunrin et al., 2022). 195 Furthermore, the drivers of adolescents’ malnutrition (stunting and thinness) of farm households 196 were also analyzed using logit regression model, as expressed in equation (2) above. Here, the dependent 197 variables are the malnutrition status (stunting and thinness) of the adolescent members of the farm 198 households were presented in separate regression models. In each case (dummy variable), one (1) is for 199 malnourished adolescent and zero (0) otherwise (i.e. stunted =1, 0 otherwise; thinness = 1, 0 otherwise) 200 expressed as a function of a vector of explanatory variables assumed to affect the malnutrition of 201 adolescent members of cassava farm households. This indicated that in each case, the parameter estimate 202 shows the likelihood that an adolescent will be malnourished. Here, the positive sign on the parameters 203 reveals increased level of malnutrition while negative sign indicates low level of malnutrition (Babatunde 204 et al., 2011). 205 The regressors included in the model are; adolescent age, household head gender, household head 206 year of schooling, farm size, household size, farm income, non-farm income, food expenditure, distance 207 to market, transport cost, access to healthcare, access to electricity, access to toilet, access to piped water, 208 access to nutrition training and crop sold ratio. 209
  • 6. 𝐿𝑜𝑔𝑖𝑡 (𝑝) = 𝑙𝑛 ( 𝑝 1−𝑝 ) = 𝛽0 + 𝛽𝑖𝑍𝑖 + 𝑈𝑖 (3) 210 The 𝑍𝑖′𝑠, as the only parameter that is different from equation (2) represents the regressors in the model 211 (Gujarati and Porter, 2009; Otekunrin et al. 2022). 212 213 Ethical approval and consent to participate: 214 The Department of Agricultural Economics and Farm Management Review Board of Federal University 215 of Agriculture, Abeokuta (FUNAAB), Nigeria approved this study. In addition, Oyo State Ethics Review 216 Committee of the Ministry of Health also approved this study (Ref No: AD13/479/4420A ). However, 217 informed consent was received from the respondents before data collection while respondents’ data are 218 completely anonymized. 219 220 221 3. Results and Discussion 222 3.1. Socioeconomic description of adolescents’ farm households 223 The results of the socioeconomic description of adolescents’ farm households of this study is 224 revealed in Table I. The results indicated that, from the 160 adolescents of farm households, 53% were 225 male while 47% were female. The mean age of the adolescents was 13.6 y old. However, 63% of the 226 household heads were men while the rest were women. The mean household farm size was about 7 227 persons while household head year of schooling was 7. More so, Table I also showed that mean 228 household farm size was 1.46 hectare, while farrm income and non-farm income wee at N122, 281 (388 229 US $) and N71, 500 (221 US $) respectively. The mean household food expenditure (monthly) was N25, 230 006 (77 US $). The mean household head (HH) farm expeience was 14 years while mean household head 231 cassava farming experience was about 11 y. The mean household transport cost, distance to market and 232 crop share ratio was N3, 673 (11 US $), 9.3 hectare and 0.62 respectively. The adolescents’ mean DDS 233 was 4.7 while mean HAZ and BAZ was -2.6 and -0.88 respectively. 234 235 <Table 1> 236 237 Furthermore, the results of the food groups consumed by adolescent members of cassava farm 238 households in the previous 24-h recall period indicated that 100% of the adolescents consumed starchy 239 staples (i.e. rice, “eba”, “amala”, yam etc) in the two states while about 30% and 65% consumed green 240 leafy vegetables in Ogun and Oyo states respectively. However, the results also indicated that 60% of the 241 adolescents consumed legumes, nuts and seeds in the two states. More so, it is interesting to note that only 242 9.3% and 16.2% of the adolescents consumed eggs in previous 24-h in Ogun and Oyo states respectively. 243 Only 3.1% adolescents in the two states (Ogun, 1.2%; Oyo, 5.4%) consumed milk and milk products 244 while no adolescents consumed organ meat in the two states in 24-h recall period. However, 47% and 245 10.8% of the adolescents did not meet the minimum 4 food groups in Ogun and Oyo states respectively. 246 The adolescents have DDS mean score of 4.5 and 4.85 in Ogun and Oyo states respectively. 247 248 3.2. The cassava commercialization levels 249 The commercialization levels of households in the study areas indicated the extent of their 250 cassava commercialization. The commercialization level is calculated using the CCI of each cassava farm 251
  • 7. household (equation 1). The results revealed that 9.2% and 16.1% of cassava farm households are non- 252 participants in the sales of cassava roots in the market (zero level) in Ogun and Oyo states respectively. 253 About fifty percent of the households had above 75% CCI in Ogun while 33.7% were in Oyo state. 254 However, about 40% of the households were categorized as very-high commercialization households 255 (CCI 4). 256 257 3.3. Exploring adolescents’ DDS across farm households’ CCI levels 258 This section explores the adolescents’ DDS in all the four CCI levels (CCI 1-4) of farm 259 households. However, results in Table 2 indicated that less than twenty-five percent (21.1%) of the 260 adolescents of zero level (CCI 1) households in the two states (Ogun, 28.6%; Oyo, 16.7%) did not meet 261 the minimum 4 food groups out of 9 within 24-h recall period. Also, in Ogun state, the results revealed 262 that farm households in higher CCI levels (CCI 3-4) recorded higher percent of adolescents consuming 263 less than minimum DDS of 4 food groups, with medium-high level farm households (CCI 3) recording 264 more than fifty percent (53.7%) while very-high level (CCI 4) recorded 43.2% of the adolescents failing 265 to meet up with the minimum DDS in 24-h recall period. Contrariwise, Oyo state recorded less than 266 fifteen percent (CCI 3 = 11.5%; CCI 4 = 8.0%) of the adolescent members of farm households consuming 267 less than 4 food groups in the previous 24-h. However, the scatter plot showing the association between 268 adolescents DDS and CCI revealed the existence of very weak negative relationship between the two 269 variables with Correlation Coefficient (r) = -0.03. Similarly, in Table 2, the relationships between 270 adolescents’ DDS and farm households’ CCI in the two states are not statistically significant (Ogun, p = 271 0.45; Oyo, p = 0.91). 272 273 <Table II> 274 275 3.4. Nutritional status of adolescent members of farm households 276 The results of the study in Table 3 presents the nutrition outcomes of adolescent members of 277 smallholder farm households in the study areas. The results revealed that 85 were boys while 75 were 278 girls. Also, among the adolescent boys, fifty-four (54) were in the age-group 10-14 y old while thirty-one 279 (31) were in the age bracket 15-19 y old. There were forty-nine (49) adolescent girls in the age-group 10- 280 14 y old while twenty-six (26) fall within 15-19 y old age bracket. The results also showed the mean and 281 standard deviation of adolescents’ HAZ and BAZ as -2.58 ± 1.3 and -0.88 ± 1.9 respectively. The results 282 further revealed that 74% of the boys were found to be stunted (having HAZ < -2SD) while about 44% of 283 them were severely stunted (having HAZ < -3SD). Interestingly, stunting prevalence in adolescent girls 284 are lower when compared to that of boys. About 57% and 39% of girls were found to be stunted in 10-14 285 and 15-19 y of age respectively. However, thinness (BAZ < -2SD) among adolescent boys (10-19 y old) 286 of cassava farm households was found to be 21.1% while 9.4% of them were severely thin (BAZ < -3SD). 287 The prevalence of thinness is lower in adolescent girls with 9.3% thinness and 1.3% severe thinness. 288 However, Figure 1-2 (A and B) revealed the nutrition outcomes (HAZ and BAZ) curves of adolescents of 289 all cassava farm households and gender distribution (boys and girls ) in rural Ogun and Oyo states 290 compaed to the WHO reference. The results revealed a conspicuous shift of the curves to the left 291 (negatively skewed distribution). 292 293 <Table III> 294 295
  • 8. <Figure I> 296 297 <Figure II> 298 299 3.5. The Prevalence of adolescents’ undernutrition across farm households’ CCI levels 300 This section invesigated the link between cassava commercialization and nutrition outcomes 301 (HAZ and BAZ) of adolescent members of the farm households. It further revealed the relationship 302 between cassava commercialization and nutrition indices of adolescent members. Anthropometric indices 303 were used to measure adolescents’ nutritional status (stunting and thinness). The results in Table 4 304 indicated that all (4) cassava farm households’ CCI levels (CCI 1-4) recorded very high stunting 305 prevalence of about 60% while low level households (CCI 2) recorded the highest percent (83.3%) of 306 stunting in the study areas. Furthemore, among total sampled adolescents, 63% (101 adolescents) were 307 found to be stunted. Futhermore, thinness is lower when compared to that of stunting among adolescents 308 in the study areas. The prevalence of thinness was was found to be about 16% and 17% of the adolescents 309 belonging to zero (CCI 1) and low level (CCI 2) households in the study areas. However, medium-high 310 level (CCI 3) households recorded the highest adolescent thinness percent (20.9%) while the lowest 311 percent thinness (9.7%) in adolescents was found in the very-high level (CCI 4) households. 312 However, in Table 4, the relationships between cassava commercialization and nutrition indices 313 of adolescent members of farm households (stunting and thinness) are not statistically significant 314 (stunting prevalence: χ2 = 3.67, p-value = 0.30; thinnnes prevalence: χ2 = 3.09, p-value = 0.38). 315 Furthermore, the scatter plots showing the relationships between adolescents’ nutrition outcomes (HAZ 316 and BAZ) and CCI revealed the existence of weak negative relationship between HAZ and CCI 317 (Correlation Coefficient (r) = -0.26) while there existed a very weak positive relationship between BAZ 318 and CCI (Correlation Coefficient (r) = <0.01). 319 320 <Table IV> 321 322 3.6. Determinants of adolescents’ dietary diversity and malnutrition 323 This section presents the results of logit regression of drivers of adolescents dietary diversity and 324 nutritional status (stunting and thinness) of farm households (Table 5 & 6). As specified above, logit 325 regressions were used to regress dietary , stunting, and thinness against some sets of household and 326 adolescent-centred variables (as regressors). The regressand (dependent variable) in each case is a 327 dummy, 1 if adolescent meet the minmum 4 food groups and 0 otherwise; 1 if adolescent is malnourished 328 and 0 otherwise (i.e. stunted = 1, 0 otherwise; and thinness = 1, 0 otherwise). The resulting parameter 329 estimates from the logit regressions indicate the likelihood of the adolescents meeting the recommeded 330 DDS and the probability of the adolescents being malnourished. 331 The results in Table 5 revealed the factors influencing adolescents’ dietary diversity of cassava 332 farm households. The results revealed that household size (p< 0.03) is negatively related to the probability 333 of meeting the recommeded DDS while household head year of schooling (p< 0.01) is positively related 334 to the likelihood of meeting the recommended adolescedents DDS in the study areas. However, household 335 toilet (p< 0.03) and nurition training access (p< 0.01 negatively influenced the dietary diversity of the 336 adolescents. It is noteworthy that commercialization level of farm households (crop sold ratio) was not 337
  • 9. significant (p< 0.42) in the model but was positively related to the dietary diversity of adolescent 338 members of cassava farm households. 339 From Table 6, the first part of the results (stunting) showed some of the significant drivers of 340 stunting among adolescent members of cassava farm households such as household size (p< 0.01), farm 341 income (p< 0.01) and nonfarm income (p< 0.02) positively influenced the incidence of stunting while age 342 of adolescent (p< 0.01), food expenditure (p< 0.01), access to electricity (p< 0.01), access to piped water 343 (p< 0.01), and commercialisation level (p< 0.01) negatively influenced stunting of adolescents in the 344 study areas. However, the second part of the results (thinness) in Table 6 revealed some of the significant 345 determinants of thinness among adolescents of cassava farm households which include; adolescent gender 346 (p< 0.02), household head year of schooling (p< 0.08), and commercialization level (p< 0.01) positively 347 affect adolescent thinness while access to nutrition training negatively influenced adolescent thinness in 348 the study areas. 349 350 <Table V> 351 352 <Table VI> 353 354 3.2. Discussion 355 The dietary diversity of adolescent members of farm households in the study areas revealed a 356 100% consumption of starchy staples in the two states. This indicated the 100% inclusion of 357 carbohydrate-dense food in the diet of all the adolescents in the last 24-h recall period. This result was 358 similar to the study among school-aged children (6-11 years old) in Port Harcourt metropolis, Nigeria 359 (Uzosike et al., 2020). Previous studies have also revealed that starchy foods top most of the diets in 360 Nigeria and in most low-and middle-income countries (Garnett, 2016; Ochieng et al., 2017; Willet et al., 361 2019; Uzosike et al., 2020; Otekunrin et al., 2021; Otekunrin, 2022). The DDS of the adolescents in the 362 two states further showed that eggs and milk/milk products were consumed by only 12% (20/160) and 363 3.1% (5/160) respectively while no adolescents consumed organ meat in the last 24-h recall period. This 364 result was contrary to the study of Uzosike et al (2020) who reported that 11.7% (99/847) of school-aged 365 children (6-11 y old) in Port Harcourt metropolis consumed organ meat in the last 24-h recall period. 366 More so, the low proportion of the adolescents consuming dark green leafy vegetables (Ogun, 367 30.2%) and eggs (Ogun, 9.3%; Oyo, 16.2%) is a source of concern because of the importance of such 368 food groups in the diets of children and adolescents in the households. However, this kind of dietary 369 pattern among adolescent members of the farm households may be a reflection of the one that existed 370 among children and their mothers. Few empirical studies reported similar dietary patterns among 371 children, adolescents and women of child bearing age in Nigeria and other parts of the world with most of 372 the foods consumed being carbohydrate-dense (Ochieng et al., 2017; Nithya and Bhavani, 2018; Keats et 373 al., 2018; Rammohan et al., 2018; Otekunrin, 2022; Otekunrin et al., 2022). 374 Assessing the dietary diversity of the adolescents across farm households’ CCI levels (Table 2) in 375 rural Ogun and Oyo states, 53.7% of adolescents in medium-high level households (CCI 3) in Ogun did 376 not meet the minmum DDS while about 43% (consuming < 4 food groups) were found in very-high level 377 (CCI 4) households in Ogun state. This may be associated with the fact that rural farm households in 378 Ogun states that are members of highly commercialized cassava households (CCI 3-4) had more of their 379 adolescents consuming low DDS (< 4 food groups) which may be as a result of household heads’ decision 380 to plough back most of the income received from sales of their produce (cassava roots) to the cassava 381
  • 10. farming enterprise and do not prioritize the consumption of high-quality diets in the households which 382 may result in low-quality diets and high prevalence of malnutrition among household members especially 383 women and children (Otekunrin, 2022; Otekunrin et al., 2022). This results was corroborated by previous 384 studies that reported overdependence of young children and women on starchy staples and other 385 carbohydrate-dense foods especially in low-and middle-income countries (Savy et al., 2005; Keding et al., 386 2012; Herrador et al,. 2015; Ochieng et al., 2017; Otekunrin et al., 2022). 387 Furthermore, findings from the scatter plot between adolescents DDS and CCI indicated the 388 existence of very weak negative association (r = -0.03) between adolescents DDS and CCI and showing 389 that as CCI increases, adolescents DDS may go down. This corroborates the results of adolescents DDS 390 in Ogun states (Table 2) where highly commercialized households (CCI 3-4) recorded high percent of 391 adolescents (CCI 3 = 53.7%; CCI 4 = 43.2%) consuming less than 4 food groups and affirming that 392 belonging to highly commercialized households (CCI 3-4) does not guarantee high-quality diets among 393 adolescent members of cassava farm households. Similarly, the relationships between adolescents’ DDS 394 and farm households’ CCI in the two states (Table 2) are not statistically significant (Ogun, p = 0.45; 395 Oyo, p = 0.91) indicating that belonging to either low or high-level CCI may not translate to adolescent 396 members’ consumption of diverse diets in the two states (Ogun and Oyo). This result was similar to that 397 of under-five children dietary diversity score (CDDS) and CCI levels of farm households in Nigeria 398 (Otekunrin et al., 2022). 399 However, this study also showed higher level of undernutrition among adolescents (10-19 y old) 400 of farm households in the study areas. The prevalence of stunting among adolescents (boys and girls) was 401 63.1%. The results of the nutritional status of adolescents indicated that more adolescent boys are stunted 402 and severely stunted than their female counterparts (Table 3). About 74% boys were stunted while 403 adolescent girls recorded 50.7% stunting prevalence. This finding was contrary to the study conducted in 404 Ethiopia which reported seemingly high stunting prevalence (23.8%) among girls than adolescent boys 405 (21.9%) (Jikamo and Samuel, 2019). The adolescents’ stunting prevalence in this study is higher than 406 other studies reported in Northern and Northwest Ethiopia among adolescent students with 37.7% and 407 20.5% stunting prevalence among boys and 21.2% and 26.8% stunting among adolescent girls 408 respectively (Melaku et al., 2015; Kebede et al., 2021). Other studies with lower (medium level; <20%) 409 stunting prevalence include; Dabone et al (2013), Gebreyohannes (2014) and Woday et al (2017). This 410 results was higher than the study in Ethiopia with stunting of 28.5% and severe stunting of 8.1% (Melaku 411 et al., 2015). 412 More so, in this study, the prevalence of thinness was 15.6% while prevalence of thinness among 413 adolescent boys (21.2%) was significantly higher than that of girls (9.3%). In contrary, Melaku et al 414 (2015) reported that prevalence of thinness among girls was higher than that of adolescent boys. This 415 results was lower than other studies in Ethiopia (26.1%) (Melaku et al., 2015), Seychelles (27.7%) (Bovet 416 et al. 2011), and Bangladesh (32%) (Alam et al., 2010). 417 Furthermore, among all adolescents in the study areas, the results revealed that about 63% were 418 stunted (alarming level) while about 16% experienced thinness. It is quite alarming that in all the four 419 CCI levels of the cassava farm households, the lowest stunting percent among adolescent members was 420 59.7% while the highest percent (73.7%) of stunting was recorded among the zero level (CCI 1) farm 421 households. This indicated that stunting is of grave concern among adolescent members of farm 422 households in the study areas. With Nigeria ranked among the top 5 countries with highest population of 423 adolescents in the world (UNICEF, 2021), high prevalence of undernutrition will portend great challenge 424 to healthy living of adolescent population. 425
  • 11. However, the scatter plot revealing the relationship between HAZ and CCI showed the existence 426 of a negative association between adolescents HAZ and CCI (r = -0.26) indicating that as CCI increases, 427 adolescents’ height-for-age z-score (HAZ) may go down. 428 The result in Table 4 gave more insights to this finding by indicating that, being a member of 429 higher CCI households (CCI 3-4) may not translate to better nutrition for the adolescents and other 430 members of the farm households in the study areas. This result is different from that of the findings by 431 Carletto et al (2017) who found no clear trends between CCI and HAZ even though with under-five 432 children data from three African countries. 433 The logit regression results of the drivers of adolescents’ DD (Table 5) indicated that household 434 head year of schooling was positive and significantly affect the DD of the adolescents while household 435 size, household primary occupation, access to toilet, and access to nutrition training was negative and 436 significantly influence adolescents’ dietary diversity. The marginal effect coefficient of household year of 437 schooling indicated that a unit increase in year of schooling of household head is expected to lead to 0.01 438 rise in the likelihood of adolescent meeting up with the minimum recommended DDS. This implies that 439 as the household head become more educated, the diets of the adolescent members and other members 440 may become more diverse, all other factors held constant. Previous studies results from Tanzania posited 441 that education of household heads may have positive influence on household dietary quality (Ochieng et 442 al., 2017; Rajendran et al., 2017). More so, the household size is significant at 5% level. A unit rise in 443 household size will reduce the probability of the adolescents meeting up with the recommended DDS by 444 1.5%. This result is quite in line with a priori expectation that farm households with larger family size 445 may find it difficult to consume diverse diets (especially young children) because household members 446 will have to manage the available food and this may be connected to the fact that larger percent of rural 447 smallholder farm households are prone to increased levels of food insecurity (Ayinde et al., 2020; 448 Otekunrin et al., 2021; Otekunrin, 2022). 449 However, access to improved toilet negatively influenced adolescents’ dietary diversity in the 450 study areas. A unit increase in access to improved toilet facilities reduces the likelihood of adolescent 451 members meeting the recommended DDS by 0.08. This finding is contrary to a priori expectation in that 452 more access to toilet facilities is expected to improve the nutrition and healthy living of the adolescents 453 and other household members. This may be connected to the fact that most farm households in the study 454 areas did not have access to improved toilet and thereby defecate in the nearby bush, revealing that most 455 households live in an unhygienic environment. This result was corroborated by the report of Nigeria 456 Demographic and Household Survey 2018 which stated that 59.9% rural households in Nigeria did not 457 have access to improved toilet facilities (NPC and ICF, 2019; Otekunrin et al., 2021; Otekunrin et al., 458 2022; Otekunrin, 2022). Also, household access to nutrition training negatively influenced adolescents’ 459 dietary diversity. The marginal effect coefficient indicated that a unit increase in access to household 460 nutrition training is expected to result in 16% decrease in the likelihood of adolescent member of the 461 household meeting the recommended DDS in 24-h recall period. This may be connected to low level of 462 nutrition knowledge occasioned by large percent of households with no formal education in the study 463 areas. This is contrary to previous findings that access to nutrition education enhanced households’ high- 464 quality diets (Pillai et al., 2016; Ochieng et al., 2017; Rajendran et al., 2017). 465 More so, the results indicated crop sold ratio did not significantly influence adolescent DD in the 466 study areas. This revealed that CCI 1-4 of farm households may not necessarily influence diet quality of 467 the adolescents and other members of the farm households. This showed that belonging to higher CCI 468
  • 12. households does not translate to high-quality diets for the adolescents and other members of the 469 households. This may be connected to the fact that household heads may decide to plough back most of 470 their income received from sales of their produce (cassava roots) to the cassava farming enterprise and did 471 not prioritize the consumption of high-quality diets in the households (Otekunrin, 2022; Otekunrin et al., 472 2022). 473 Furthermore, the logit regression results of the drivers of adolescents’ nutritional status (stunting 474 = HAZ < -2SD; thinness = BAZ < -2SD) as shown in Table 6 revealed that adolescent age, gender, 475 household size, household farm income, non-farm income, food expenditure, access to electricity, access 476 to piped water, and commercialization level (crop sold ratio) significantly influenced adolescents’ 477 nutritional status of farm households in the study areas. However, a unit increase in age is expected to 478 reduce the likelihood of the adolescent being stunted by 81%. This implies that older adolescents are less 479 likely to be stunted. However, a unit increase in household size of farm household will make the 480 probability of stunted adolescent go up by 9.3%. This implies that as cassava farm household member 481 increases, stunting prevalence among adolescent members increases. Due to the prevalence of food 482 insecurity marked with lack of access to nutritious food (food deprivation) among rural smallholder farm 483 households, increase in household member may increase the prevalence of malnutrition (stunting) among 484 adolescents and other young children in the households (Otekunrin et al., 2021; Otekunrin, 2022). 485 Further, considering adolescent gender, a unit increase in adolescent boy is expected to increase the 486 likelihood of thinness by 11.8% when other factors are held constant. This result corroborated the 487 findings in Table 4 where thinness in adolescent boys was found to be higher (21.2%) than that of 488 adolescent girls (9.3%) of cassava farming households. Other studies also reported higher prevalence of 489 thinness in adolescent boys than that of girls (Gebreyohannes et al., 2014; Melaku et al., 2015; Kebede et 490 al., 2021). 491 Moreover, a unit rise in cassava household’s farm income and non-farm income increases the 492 probability of stunted adolescents. This may be due to the fact that most of the income generated from the 493 farm business was ploughed back to the farm business with little consideration for the provision and 494 consumption of nutritious and high-quality diets for household members (especially young children and 495 adolescents). This result is contrary to the previous study that reported that increased household income is 496 more likely to result in higher purchasing power for high-quality food for the adolescents (Darmon and 497 Drewnowski, 2008; Kebede et al., 2021). From the results of the analysis in Table 7, a unit increase in 498 household food expenditure reduces the likelihood of stunted adolescents among cassava farm households 499 by <0.01. This indicated that as household’s expenditure on food go up, more food items will likely be 500 available in the households leading to lower level of undernutrition (especially stunting) among 501 adolescents and other members of the household. Access to rural infrastructure (piped water and 502 electricity among others) are crucial to the well-being of rural households. However, a unit increase in 503 access to both electricity and piped water reduces the likelihood of having stunted adolescents belonging 504 to cassava farming households by 28.1% and 29.6% respectively. The results amplified the importance of 505 rural electrification and access to improved drinking water facilities which have capacity of reducing the 506 prevalence of undernutrition among young children, adolescents, and other members of the farm 507 households (Omotayo et al., 2021; Adeyonu et al., 2022). 508 The marginal effects of commercialisation level (crop sold ratio) revealed that a unit increase in 509 commercialisation level reduces the likelihood of stunted adolescents by 70.5%. This revealed that higher 510 cassava commercialisation level households (CCI 3-4) may likely achieve a reduction in stunting 511 prevalence among adolescent members of farm households. This result is corroborated by the assessment 512
  • 13. of undernutrition (stunting) of adolescent members across CCI levels (Table 5). Here, stunting among 513 adolescents was higher in both zero level (73.7%) and low level (83.3%) households when compared with 514 that of highly commercialized households (medium-high level, 59.7%; very-high level, 59.7%). 515 Although, all the four commercializattion levels (CCI 1-4) recorded very high percent (60-83%) of 516 stunting among adolescent members of households in the study areas. 517 518 Conclusion and Recommendations 519 Previous empirical works have analyzed the prevalence and determinants of adolescents’ dietary 520 diversity and some on adolescents’ malnutrition but, studies on the links between commercialization 521 levels and adolescents’ dietary diversity, and malnutrition among farming households are scarce 522 especially in Nigeria. This study showed that the dietary pattern of the adolescent members in the study 523 areas (especially in Ogun state) was rather monotonous with 100% consumption of starchy staples while 524 food groups such as organ meat, milk/milk products and eggs were consumed by 0%, 5% and 20% 525 adolescents within 24-h recall period respectively. About 47% of the adolescents in Ogun state achieved 526 less diverse diets (< 4 food groups) by failing to meet up with the minimum dietary diversity. This study 527 found very weak negative relationship between adolescents’ DDS and CCI, indicating that belonging to 528 higher CCI households may not guarantee access to diverse diets (especially in Ogun state). 529 However, more adolescent boys were found to be stunted and thin when compared to the 530 adolescent girls while very high (≥ 60%) adolescent stunting prevalence was recorded in all the four CCI 531 levels’ households in the study areas. In addition, there existed a negative association between HAZ and 532 CCI indicating that as CCI increases, adolescents’ height-for-age (HAZ) may go down. However, 533 belonging to a higher commercialization level households (CCI 3-4) may not necessarily translate to 534 lower prevalence of adolescent stunting as indicated in Figure 5 where CCI 3&4 recorded about 60% 535 stunting prevalence in the study areas. Cassava farm household heads should not be concerned about 536 increasing the extent of cassava commercialization alone but should make concerted effort in prioritizing 537 the provision and consumption of high-quality diets among household members which can enhance 538 diverse dietary pattern and help in reducing undernutrition (stunting and thinness) especially among 539 young children and adolescent members of farm households in the study areas. 540 This study stressed the need to support nutrition-sensitive intervention programs to provide 541 nutrition knowledge/information on preparation and consumption of nutrient-dense diets that will 542 improve the nutritional status of household members. Also, stakeholders should facilitate the provision of 543 rural infrastructure development such as the provision of piped water, rural electrification and functional 544 healthcare facilities that will enhance agricultural productivity and improve healthy living of the farm 545 households. 546 547 References 548 Adeyonu, G.A., Adams, S.O., Kehinde, M.O., Akerele, D., and Otekunrin, O.A. (2022). “Spatial Pofiles 549 and Determinants of Multidimensional Poverty in rural Nigeria” International Journal of Energy 550 Economics and Policy 12 (3), pp. 373-384. 551 Agricultural Policy Research in Africa (2018). “What is Agricultural Commercialization: who benefits 552 and how do we measure it?” Issue 1, pp. 1-6. 553 Alam, N., Roy S.K., Ahmed, T., and Ahmed, A.M.S. (2010). “Nutritional Status, Dietary Intake, and 554 Relevant Knowledge of Adolescent Girls in Rural Bangladesh” Journal of Health Population and 555 Nutrition, 28(1), pp. 86–94. 556
  • 14. Ayinde I.A., Otekunrin, O.A., Akinbode, S.O., and Otekunrin, O.A. (2020). “Food Security in Nigeria: 557 Impetus for growth and Development” Journal of agricultural. Econonomics and Rural 558 Development. 6(2), pp. 808-820. 559 Azadbahkt, L., and Esmailzader, A. (2012). “Dietary patterns and attention deficit hyperactivity disorder 560 among Iranian children” Nutrition 28(3), pp. 242–249. 561 Babatunde, R.O., Olagunju, F.I., Fakayode, S.B., and Sola-Ojo, F.E. (2011). “Prevalence and 562 Determinants of Malnutrition among Under Five Children of Farming Households in Kwara State, 563 Nigeria” Journal of Agricultural Science 3 (3), pp. 173-181. 564 Bhargava, M., Bhargava, A., Ghate, S.D., and Rao, R.S.P. (2020). “Nutritional status of Indian 565 adolescents (15-19 years) from National Family Health Surveys 3 and 4: Revised estimates using 566 WHO 2007 Growth reference” PLOS ONE, 15(6), pp. 1-24. 567 Bovet, P., Kizirian, N., Madeleine, G., Blössner, M., and Chiolero, A. (2011). “Prevalence of thinness in 568 children and adolescents in the Seychelles: comparison of two international growth references” 569 Nutrition Journal, 10:65. 570 Carletto, C., Corral, P., and Guelfi, A. (2017). “Agricultural commercialization and nutrition revisited: 571 Empirical evidence from three African countries” Food Policy 67, pp. 106-118. 572 Daboné, C., Delisle, H., and Receveur, O. (2013). “Predisposing, facilitating and reinforcing factors of 573 healthy and unhealthy food consumption in schoolchildren: a study in Ouagadougou. Burkina 574 Faso” Global health promotion, 20(1), pp. 68–77. 575 Darmon, N., and Drewnowski, A. (2008). “Does social class predict diet quality?” American Journal of 576 Clinical Nutrition, 87(5), pp. 1107–17. 577 de Onis, M., Garza, C., Onyango, A.W., and Borghi, E. (2007). “Comparison of the WHO child growth 578 standards and the CDC 2000 growth charts” Journal of Nutrition 137, pp. 144–148. 579 FAO, IFAD, UNICEF, WFP, and WHO. (2021). The State of Food Security and Nutrition in the World 580 2021. Transforming food systems for food security, improved nutrition and affordable healthy diets 581 for all. Rome, FAO. Rome. 582 Garnett, T. (2016). “Plating up solutions” Science 353(6305), pp. 1202–1204. 583 Gebreyohannes, Y., Shiferaw, S., Demtsu, B., and Bugssa, G. (2014). “Nutritional Status of Adolescents 584 in Selected Government and Private Secondary Schools of Addis Ababa, Ethiopia” International 585 Journal of Nutrition and Food Science, 3 (6), pp. 504–14. 586 Global Nutrition Report (2021). “2021 Global Nutrition Report: The state of global nutrition” Bristol, 587 UK: Development Initiatives. 588 Global Panel (Global Panel on Agriculture and Food Systems for Nutrition) (2016). “Food systems and 589 diets: Facing the challenges of the 21st century” Foresight Report, London. 590 Gujarati, DN., and Porter, D.C. (2009). “Basic Econometrics” Fifth edition. 591 Herrador, Z., Jesus, P., Sordo, L, et al (2015). Low Dietary Diversity and Intake of Animal Source Foods 592 among School Aged Children in Libo Kemkem and Fogera Districts, Ethiopia. PLoS ONE; 593 10(7):e0133435. 594 International Food Policy Research Institute (IFPRI) (2017). “Global Food Policy Report” Washington, 595 DC: International Food Policy Research Institute. 596 Jikamo, B., and Samuel, M. (2019). “Does dietary diversity predict the nutritional status of adolescents in 597 Jimma Zone, Souhwest Ethiopia?” BMC Research Notes, 12:402. 598 Keats, E., Rappaport, A., Shah, S, et al. (2018). “The dietary intake and practices of adolescent girls in 599 low- and middle-income countries: a systematic review” Nutrients 10(12): 1978. 600 Kebede, D., Prasad, R.P.C.J., Asres, D.T., Aragaw, H., and Worku, E. (2021). “Prevalence and associated 601 factors of stunting and thinness among adolescent students in Finote Selam Town, Nothwest 602 Ethiopia” Journal of Health, Population and Nutrition, 40: 44. 603
  • 15. Keding, G.B., Msuya, J.M., Maass, B.L., and Krawinkel, M.B. (2012). “Relating dietary diversity and 604 food variety scores to vegetable production and socio-economic status of women in rural Tanzania” 605 Food Security; 4 (1), pp. 129-40. 606 Kennedy, G., Berado, A., Papavero, C., Horjus, P., Ballard, T, Dop, M. (2010a). “Proxy measures of 607 household food consumption for food security assessment and surveillance, comparison of the 608 household dietary diversity and food consumption scores” Journal of Public Health Nutrition. 13 609 (12), pp. 2010–2018. 610 Kennedy, G., Ballard, T., Dop, M. (2010b). “Guidelines for measuring Houdehold and Individual Dietary 611 Diversity” Nutrition and Consumer Protection Division, Food and Agriculture Organization of the 612 United Nations. Accessed from: https://www.fao.org/3/i1983e/i1983e.pdf 613 Lawal, B.O., and Samuel, F.O. (2010). “Determinant of Nutritional Status of Children in Farming 614 Households in Oyo State, Nigeria” African Journal of Food, Agriculture, Nutrition and 615 Development 10 (10), pp. 4235-4253. 616 Melaku, YA., Zello, G.A., Gill, T.K., Adams, R.J., and Shi, Z. (2015). “Prevalence and factors associated 617 with stunting and thinness among adolescent students in Northern Ethiopia: a comparison to World 618 Health Organization standards” Archives of Public Health, 73: 44. 619 Maps of World (2021). Accessed from: https://wwww.mapsofworld.com/lat_long/nigeria-lat-long.html 620 Mirmiran, P., Azadbaht, L., and Azizi, F. (2006). “Dietary diversity within food groups: an indicator of 621 specific nutrient adequacy in Tehranian women” Journal of the American College of Nutrition, 622 25(4), pp. 354–361. 623 National Population Commission (NPC) [Nigeria], ICF (2019). Nigeria Demographic and Health Survey 624 2018. Abuja, Nigeria and Rockville, Maryland, USA: NPC and ICF. 625 Nithya, D.J., and Bhavani, R.V. (2017). “Dietary Diversity and its Relationship with Nutritional Status 626 among Adolescents and Adults in Rural India” Journal of Biosocial Sciences 50, pp. 397-413. 627 Obayelu, O.A., and Osho, F.O. (2020). “How diverse are the diets of low-income urban households in 628 Nigeria?” Journal of Agriculture and Food Research, 2, pp. 1–8. 629 Ochieng, J., Afari-Sefa, V., Lukumay, P.J., and Dubois, T. (2017). “Determinants of dietary diversity and 630 the potential role of men in improving household nutrition in Tanzania” PLoS ONE 12(12), 631 e0189022. 632 Ogunnaike, M.G., Kehinde, M.O., and Olabode, O.J. (2020). “Determinants of malnutrition among 633 children in rural farm households in Ogun State, Nigeria” FUDMA Journal of Science, 4 (4), pp. 634 90-95. 635 Okezie, C.A., and Nwosu, A. (2007). “The Effect of Agricultural Commercialization on the Nutritional 636 Status of Cocoa Growing Households in Ikwuano LGA of Abia State Nigeria” International 637 Journal of Agriculture and Rural Development, 9, pp. 12-15. 638 Omotayo, A.O., Olagunju, K.O., Omotoso, A.B., Ogunniyi, A.I., Otekunrin, O.A., and Daud, A.S. (2021). 639 “Clean water, sanitation and under-five children diarrhea incidence: Empirical evidence from South 640 Africa’s General Household Survey” Environmental Science and Pollution Science, 28 (44), pp. 641 63150-63162. 642 Opondo, F.A., Dannenberg, P., and Willkomm, M. (2017). “Characterization of the levels of cassava 643 commercialization among smallholder farmers in Kenya: A multinomial regression approach” 644 African Journal of Agricultural Research, 12(41), pp. 3024-3036. 645 Otekunrin, O.A, Otekunrin, O.A, Sawicka, B., and Pszczółkowski, P. (2021). “Assessing Food Insecurity 646 and Its Drivers among Smallholder Farming Households in Rural Oyo State, Nigeria: The HFIAS 647 Approach” Agriculture, 11:1189. 648 Otekunrin, O.A. (2022). “Investigating food insecurity, health and environment-relatd factors, and 649 agricultural commercialization in Southwestern Nigeria: evidence from smallholder farming 650 households”. Environmenal Science and Pollution. Research 1-20. https://doi.org/10.1007/s11356- 651 022-19544-w 652
  • 16. Otekunrin, O.A., Otekunrin, O.A., Ayinde, I.A, Sanusi, R.A., Onabanjo, O.O, and Ariyo, O. (2022). 653 “Dietary diversity, environment and health-related factors of under-five children: Evidence from 654 cassava commercialization households in rural South-West Nigeria” Environmental Science and 655 Pollution. Research, 29(13), pp. 19432-19446. 656 Pillai, A., Kinabo, J., and Krawinkel, M.B. (2016). “Effect of nutrition education on the knowledge scores 657 of urban households with home gardens in Morogoro, Tanzania” Agriculture & Food Security, 658 5(1), 22. 659 Rajendran, S., Afari-Sefa, V., Shee, A., et al. (2017). “Does crop diversity contribute to dietary diversity? 660 Evidence from integration of vegetables into maize-based farming systems” Agriculture & Food 661 Security, 6(1):50. 662 Rammohan, A., Goli, S., Singh, D., Ganguly, D., and Singh, U. (2018). “Maternal dietary diversity and 663 odds of low birth weight: empirical findings from India” Women and Health 59(4), pp. 375–390. 664 Savy, M., Martin-Prevel, Y., Sawadogo, P., Kameli, Y., and Delpeuch, F. (2005). “Use of 665 variety/diversity scores for diet quality measurement: relation with nutritional status of women in a 666 rural area in Burkina Faso” European Journal of Clinical Nutrition, 59(3), pp. 703-716. 667 Strasberg, P., Jayne, T., Yamano, T., et al. (1999). “Effects of Agricultural Commercialization on Food 668 Crop Input Use and Productivity in Kenya” Policy Synthesis for USAID – Africa Bureau Office of 669 Sustainable Development 41, East Lansing MI: Michigan State University 1999. 670 Steyn, N.P., Nel, J., Labadarios, D., Maunder, E.M.W., and Kruger, H.S. (2014). “Which dietary diversity 671 indicator is best to assess micronutrient adequacy in children 1 to 9 y?” Nutrition 30(1), pp. 55-60. 672 United Nations Children’s Fund (2021). “The State of the World’s Children 2021: On My Mind – 673 Promoting, protecting and caring for children’s mental health” UNICEF, New York, October 2021. 674 Ukegbu, P.O., and Ogu, V.C. (2017). “Assessment of Dietary Diversity Score, Nutritional Status and 675 Socio-demograhic Characteristics of Under-five Children in Some Rural Areas of Imo State, 676 Nigeria” Malaysian Journal of Nutrition 23(3), pp. 425-435. 677 Uzosike, T.C.J., Okeafor, I., and Mezie-Okoye, M. (2020). “Dietary Diversity, Nutritional status and 678 Academic performance of pupils in public primary schools in Port Harcourt Metropolis” Journal of 679 Community Medicine and Primary Health Care, 32 (2), pp. 42-56. 680 Willett, W., Rockström, J., Loken, B., et al. (2019). “Food in the Anthropocene: The EAT–lancet 681 commission on healthy diets from sustainable food systems” The Lancet 393(10170):447–492. 682 Woday, A., Menber, Y., and Tsegaye, D. (2017). “Prevalence of and associated factors of stunting among 683 adolescents in Tehuledere District, North East Ethiopia” Journal of Clinical Cell Immunology, 684 9(2): 546. 685 WHO (2009). WHO AnthroPlus for personal computers: Software for assessing growth of the world’s 686 children and adolescents. Geneva. 687 World Health Organization (2021). Working for a brighter, healthier future: how WHO improves health 688 and promotes well-being for the world’s adolescents. Geneva: World Health Organization; 2021. 689 Licence: CC BY-NC-SA 3.0 IGO. 690 691 692 693 694 695 696
  • 17. 697 698 699 Table I Desciption of farm household and adolescent-centred factors 700 Variables Description Mean ± SD Age Adolescent’s age (years) 13.6 ± 2.7 Household size Persons living in the household 6.6 ± 2.5 Gender Gender of the adolescent 0.47 ± 0.50 HH gender Head of household gender 0.37 ± 0.48 HH education Household head year of schooling 6.6 ± 3.5 F Size Household cassava farmland size (ha) 1.5 ± 1.0 FarmInc Household farm income (naira) N122,281 ± N82,102 Non-farmInc Household non-farm income (naira) N71,500 ± N28,708 FarmExp Household head farming experience (year) 14.4 ± 9.5 cassfarmExp Household head cassava farming experience 10.5 ± 8.6 Food Expenditure Household food expenditure (naira) N25,006 ± N8,820 DistMarket Distance to market (Km) 9.3 ± 3.6 Transport cost Monthly Transport cost (naira) N3,673 ± N1,720 CropShare CCI level 0.62 ± 0.28 Adolescent Ht Adolescent height (Metre) 1.4 ± 0.13 Adoelscent Wt Adolescent weight (Kg) 33.4 ± 9.1 Adolescent DDS DDS of adolescents (0-9) 4.7 ± 1.0 Adolescent HAZ Height-for-age-z-score -2.6 ± 1.3 Adolescent BAZ Body mass index z-score -0.88 ± 1.2 Source: underlying survey data 2020. SD means Standard Deviation 701 702 Table II. Exploring adolescents DDS across cassava farm households’ CCI levels 703 CCI Levels Adolescent DDS (10-19 y old) State Ogun (n=86) Oyo (n=74) Zero Level (CCI 1) n (%) n (%) Food groups <4 2 (28.6) 2 (16.7) Food groups ≥4 5 (71.4) 10 (83.3) Total 7 (100) 12 (100) Low Level (CCI 2) Food groups <4 - 1 (9.1) Food groups ≥4 1 (100) 10 (90.9) Total 1 (100) 11 (100) Medium-high Level (CCI 3) Food groups <4 22 (53.7) 3 (11.5) Food groups ≥4 19 (46.3) 23 (88.5) Total 41 (100) 26 (100) Very-High Level (CCI 4) Food groups <4 16 (43.2) 2 (8.0) Food groups ≥4 21 (56.8) 23 (92.0) Total 37 (100) 25 (100) Total Food groups <4 40 (46.5) 8 (10.8) Food groups ≥4 46 (53.5) 66 (89.2) Total 86 (100) 74 (100) Fisher’s exact, p-value -, 0.45 -, 0.91 Source: underlying survey data 2020. 704
  • 18. This shows the number (frequency) and percent of adolescents DDS food groups in all the four CCI levels of farm 705 households in rural Ogun and Oyo states of Nigeria. This equally explored both of the adolescents that met and 706 those that failed to meet the recommmended food groups. 707 708 709 Table III. Nutrition outcomes of adolescent members of farm households 710 Source: underlying survey data 2020. 711 Note: Stunting and severe stunting is HAZ < -2SD; < -3SD respectively 712 Thinness and severe thinness is BAZ < -2SD; < -3SD respectively; SD means Standard Deviation. This Table 713 revealed the nutrition outcomes (HAZ and BAZ) of the adolescents members (10-19 years old) of the cassava 714 farm households in Ogun and Oyo states of Nigeria. 715 Table IV. Adolescents’ nuritional status over farm households’ CCI levels 716 Zero Level (No Seller) Low Level Medium-High Level Very High Level Chi-square, p-value Nutritional Status n (%) n (%) n (%) n (%) Stunted < - 2 SD 14 (73.7) 10 (83.3) 40 (59.7) 37 (59.7) χ2 = 3.67, p-value = 0.30 Not stunted > -2 SD 5 (26.3) 2 (16.7) 27 (40.3) 25 (40.3) Total 19 (100) 12 (100) 67 (100) 62 (100) BAZ (Thinness) < - 2 SD 3 (15.8) 2 (16.7) 14 (20.9) 6 (9.7) χ2 = 3.09, p-value = 0.38 BAZ (Not Thin) > -2 SD 16 (84.2) 10 (83.3) 53 (79.1) 56 (90.3) Total 19 (100) 12 (100) 67 (100) 62 (100) Source: underlying survey data 2020. 717 Note: Stunting is HAZ < -2SD; Thinness is BAZ < -2SD. This table indicated adolescents’ nutritional status across 718 the four commercialization levels (Zero level – very-high levels). It showed the number (frequency) of adolescents 719 experiencing malnutrion and those not suffering from it across the CCI levels of cassava farm households in the 720 study areas 721 722 723 724 725 726 Age Group (year) Height-for-age z-score (HAZ) (%) BMI-for-age z-score (BAZ) (%) Boys (n=85) n % <-3SD % <-2SD Mean ± SD % <-3SD % <-2SD Mean ± SD 10-14 54 42.6 70.4 -2.8 ± 1.2 9.3 18.5 -0.79 ± 1.4 15-19 31 45.2 80.6 -2.8 ± 0.88 9.7 25.8 -1.4 ± 1.1 10-19 85 43.5 74.1 -2.8 ± 1.1 9.4 21.2 -1.0 ± 1.3 Girls (n=75) 10-14 49 34.7 57.1 -2.5 ± 1.4 0 4.1 -0.64 ± 0.91 15-19 26 30.8 38.5 -2.1 ± 1.4 3.8 19.2 -0.91 ± 1.1 10-19 75 33.3 50.7 -2.4 ± 1.4 1.3 9.3 -0.73 ± 0.98 Pooled (n=160) 10-14 103 38.8 64.1 -2.7 ± 1.3 4.9 11.7 -0.72 ± 1.2 15-19 57 38.6 61.4 -2.5 ± 1.2 7 22.8 -1.2 ± 1.1 10-19 160 38.8 63.1 -2.6 ± 1.3 5.6 15.6 -0.88 ± 1.2
  • 19. 727 728 729 730 731 Table V. Determinants of adolescents’ dietary diversity 732 Variables 𝜷 ± RSE ME (P-values) Adolescent Age (years) 0.03 ± 0.10 <0.01 (0.79) +Adolescent Gender -0.50 ± 0.62 -0.02 (0.42) Household Size (Number) -0.51* ± 0.24 -0.02 (0.03) Farm Size (Ha) 0.43 ± 0.94 0.01 (0.65) HH year of schooling 0.33* ± 0.11 0.01 (<0.01) Farm Income (Naira) 0.00 ± 0.00 <0.01 (0.89) Nonfarm Income (Naira) -0.00 ± 0.00 -<0.01 (0.47) Food Expenditure (Naira) 0.00 ± 0.00 <0.01 (0.42) +HH Primary Occupation -3.6* ± 1.3 -0.06 (0.01) Transport cost (Naira) 0.00 ± 0.00 <0.01 (0.30) +Healthcare access -1.0 ± 1.2 -0.03 (0.39) + Electricity access -0.55 ± 0.93 -0.02 (0.56) +Toilet access -1.9* ± 0.84 -0.08 (0.03) +Access to Nutrition Training -2.5* ± 0.90 -0.16 (0.01) Crop sold ratio 2.3 ± 2.8 0.07 (0.42) Constant 6.0* ± 2.5 (0.02) (+) represent dummy variable (0 or 1). *Significance at p<0.05 levels. 733 ME means Marginal Effects, RSE means Robust Standard Error 734 Number of observation = 160 735 Wald chi2 (15) = 34.1 736 Prob > chi2 = 0.00 737 Log pseudo likelihood = -33.4 738 Pseudo R2 = 0.41 739 Note: Marginal effects measures the association between a change in the predictor 740 S and a change in the outcome. It is an effect, not a prediction. It is a change and 741 not a level. It is the percentage change on the probability associated with a unit 742 change in the independent variable. They tell the effect on the probability of not 743 attainig the recommended dietary diversity score. 744 745 Table VI. Determinants of adolescents’ malnutrition 746 Nutrition outcomes Stunting (1) Thinness (2) Variables 𝜷 ± SE ME (p-values) 𝜷 ± RSE ME (p-values) Age (years) -5.6* ± 1.4 -0.81 (<0.01) -0.12 ± 0.11 -0.01 (0.26) Age squared (years) 0.20* ± 0.05 0.03 (<0.01) - - +Gender -0.21± 0.60 -0.03 (0.73) 1.2* ± 0.54 0.12 (0.02) +Household Head gender -1.3* ± 0.73 -0.17 (0.08) 1.3* ± 0.70 0.12 (0.06) Household Size (n) 0.64*± 0.19 -0.09 (<0.01) -0.10 ± 0.12 -0.09 (0.42) Farm Size (Ha) -0.48 ± 0.60 -0.07 (0.43) -0.35 ± 0.68 -0.03 (0.61) HH year of schooling 0.02 ± 0.10 <0.01 (0.84) 0.12* ± 0.07 0.01 (0.08)
  • 20. Farm Income (Naira) <0.01* ± <0.01 <0.01 (0.01) -<0.01 ± <0.01 -<0.01 (0.83) Nonfarm Income (Naira) <0.01* ± <0.01 0.09 (0.02) <0.01 ± <0.01 <0.01 (0.11) Food expenditure (Naira) <0.01* ± <0.01 <0.01 (<0.01) <0.01 ± <0.01 <0.01 (0.87) Distance to market (Km) - - -0.04 ± 0.08 -<0.01 (0.60) Transport cost (Naira) <0.01 ± <0.01 <0.01 (0.66) - - +Access to Nutrition Training 0.48 ± 0.66 0.08 (0.47) -1.2* ± 0.68 -0.14 (0.09) +Access to Electricity -1.9* ± 0.76 -0.28 (0.01) -0.44 ± 0.67 -0.04 (0.51) +Access to Piped water -3.3* ± 1.11 -0.30 (0.00) 0.57 ± 0.83 0.05 (0.50) +Access to Healthcare 0.55 ± 0.65 0.08 (0.39) -0.13 ± 0.68 -0.01 (0.84) +Access to Toilet - - -1.05 ± 0.75 -0.11 (0.16) Crop sold ratio -4.9* ± 1.4 -0.71 (<0.01) 3.0* ± 1.2 0.29 (0.01) Constant 38.6* ± 9.4 (<0.01) 1.2 ± 2.0 (0.56) Number of observations 160 160 Wald chi2 (16) 34.9 27.1 Prob > chi2 0.00 0.04 Log pseudo likelihood -46.9 -58.1 Pseudo R2 0.56 0.16 (+) represent dummy variable (0 or 1). *Significance at p<0.05 level. SE means Standard Error; 747 RSE means Robust Standard Error. ME means Marginal Effects 748 The p-values are in parenthesis on Marginal Effects and p-values column. 749 Note: Marginal effects measures the association between a change in the predictors and a change in the 750 outcome. It is an effect, not a prediction. It is a change and not a level. They tell the effect on the probability 751 of being malnourished (stunting and thinnes) in a specific group for change in the regressors. It is the 752 percentage change on the probability associated with a unit change in the independent variable. 753 754 755
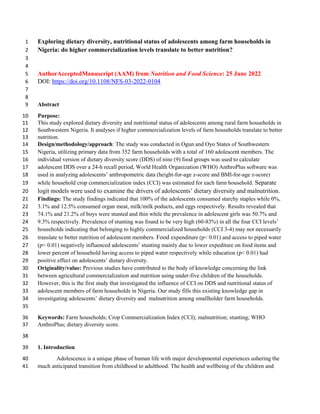
  • 21. 756 Figure I. A. Height for-age- z-score of all cassava farm households’ adolescents (10-19 y) 757 in rural Ogun and Oyo States. B. Height for-age- z-score of gender (boys and girls) of 758 cassava farm households’ adolescents (10-19 y old) in rural Ogun and Oyo States. 759 Note: The red line is the all children (n =160), blue line is the male (n = 85), pink line is the 760 female (n = 75) while the red line is the WHO 2007 child growth standards. 761 Height for-age- z-score are compared with the WHO 2007 child growth reference population 762 763 764 Fig. 1A Fig. 1B
  • 22. 765 766 Figure II. A. BMI-for-age z-score of all cassava farm households’ adolescents (10-19 y) 767 in rural Ogun and Oyo States. B. BMI-for-age z-score of gender (boys and girls) of 768 cassava farm households’ adolescents (10-19 y old) in rural Ogun and Oyo States. 769 Note: The red line is the all children (n =160), blue line is the male (n = 85), pink line is the 770 female (n = 75) while the red line is the WHO 2007 child growth standards. 771 BMI-for-age z-score are compared with the WHO 2007 child growth reference population. 772 773 Fig. IIA Fig. IIB