ASIAN CURRENCIES STILL ON THE STRAIGHT AND NARROW

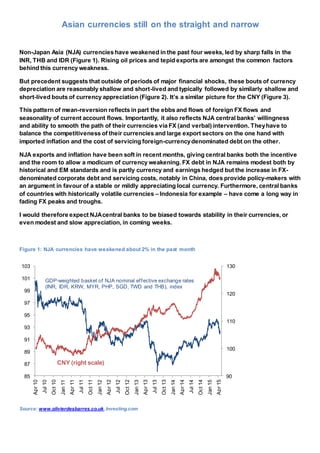
Non-Japan Asia (NJA) currencies have weakened in the past four weeks, led by sharp falls in the INR, THB and IDR (Figure 1). Rising oil prices and tepid exports are amongst the common factors behind this currency weakness. But precedent suggests that outside of periods of major financial shocks, these bouts of currency depreciation are reasonably shallow and short-lived and typically followed by similarly shallow and short-lived bouts of currency appreciation (Figure 2). It’s a similar picture for the CNY (Figure 3). This pattern of mean-reversion reflects in part the ebbs and flows of foreign FX flows and seasonality of current account flows. Importantly, it also reflects NJA central banks’ willingness and ability to smooth the path of their currencies via FX (and verbal) intervention. They have to balance the competitiveness of their currencies and large export sectors on the one hand with imported inflation and the cost of servicing foreign-currency denominated debt on the other.

Recommended
Recommended
More Related Content
What's hot
What's hot (20)
Viewers also liked
Viewers also liked (8)
Similar to ASIAN CURRENCIES STILL ON THE STRAIGHT AND NARROW
Similar to ASIAN CURRENCIES STILL ON THE STRAIGHT AND NARROW (20)
Recently uploaded
Recently uploaded (20)
ASIAN CURRENCIES STILL ON THE STRAIGHT AND NARROW
- 1. Asian currencies still on the straight and narrow Non-Japan Asia (NJA) currencies have weakened in the past four weeks, led by sharp falls in the INR, THB and IDR (Figure 1). Rising oil prices and tepid exports are amongst the common factors behind this currency weakness. But precedent suggests that outside of periods of major financial shocks, these bouts of currency depreciation are reasonably shallow and short-lived and typically followed by similarly shallow and short-lived bouts of currency appreciation (Figure 2). It’s a similar picture for the CNY (Figure 3). This pattern of mean-reversion reflects in part the ebbs and flows of foreign FX flows and seasonality of current account flows. Importantly, it also reflects NJA central banks’ willingness and ability to smooth the path of their currencies via FX (and verbal) intervention. Theyhave to balance the competitiveness of their currencies and large export sectors on the one hand with imported inflation and the cost of servicing foreign-currencydenominated debt on the other. NJA exports and inflation have been soft in recent months, giving central banks both the incentive and the room to allow a modicum of currency weakening. FX debt in NJA remains modest both by historical and EM standards and is partly currency and earnings hedged but the increase in FX- denominated corporate debt and servicing costs, notably in China, does provide policy-makers with an argument in favour of a stable or mildly appreciating local currency. Furthermore, central banks of countries with historically volatile currencies – Indonesia for example – have come a long way in fading FX peaks and troughs. I would therefore expect NJAcentral banks to be biased towards stability in their currencies, or even modest and slow appreciation, in coming weeks. Figure 1: NJA currencies have weakened about 2% in the past month Source: www.olivierdesbarres.co.uk,Investing.com 90 100 110 120 130 85 87 89 91 93 95 97 99 101 103 Apr10 Jul10 Oct10 Jan11 Apr11 Jul11 Oct11 Jan12 Apr12 Jul12 Oct12 Jan13 Apr13 Jul13 Oct13 Jan14 Apr14 Jul14 Oct14 Jan15 Apr15 GDP-weighted basket of NJA nominal effective exchange rates (INR, IDR, KRW, MYR, PHP, SGD, TWD and THB), index CNY (right scale)
- 2. Figure 2: But precedent suggests sell-offs (and rallies) are reasonably modest and short-lived… Figure 3: …including for the CNY Source: www.olivierdesbarres.co.uk,Investing.com Note: Includes INR, IDR, KRW,MYR,PHP, SGD, THB and TWD Source: www.olivierdesbarres.co.uk,Investing.com Higher oil prices and soft exports removing some currency support I estimate that a GDP-weighted basket of NJA nominal effective exchange rates (NEERs) has weakened about 2% since mid-April, and if the CNY is excluded is back near early 2015 levels (see Figure 1). While country-specific drivers have contributed to individual currencies’ weakening, a number of common factors can be identified, including: - Rising crude oil prices: The 28% increase in international crude oil prices since mid-March and subsequent increase in the value of oil imports. The nature of crude-oil contracts suggests this price increase is likely to feed through to the USD-value of imports over coming months. As I elaborated in Crude Expectations (16 January 2015), NJA economies have significant net oil imports. The only exception is Malaysia which is a small net crude oil exporter. - Weak exports: The USD-value of exports from Asia (excluding China), seasonally adjusted, were down 8% year-on-year in March, according to my estimates, and this was not a one-off. Indeed, in Q1 2015, exports contracted 8% from Q1 2014 and 20% annualised from Q4 2014 (see Figure 4). The picture is similar in China (see Figure 5). Furthermore, Korea and Taiwan have released April data showing the USD-value of exports at multi-year lows, according to my calculations (see Figure 6). The US dollar’s appreciation accounts for only part of the weakness in the USD-value of Asian exports. Figure 7 strips out these currency effects and is effectively an estimate of export volumes, which have flat-lined for the past 18 months. -5 -4 -3 -2 -1 0 1 2 3 4 5 Apr 10 Feb 11 Dec 11 Oct 12 Aug 13 Jun 14 Apr 15 Month-on-month % change in GDP-weighted basket of NJA nominal effective exchange rates -4 -3 -2 -1 0 1 2 3 4 5 Apr 10 Feb 11 Dec 11 Oct 12 Aug 13 Jun 14 Apr 15 Month-on-month % change in CNY nominal effective exchange rate
- 3. Figure 4: Exports slumped in Q1 2015… Figure 5: …including in China… Source: National statisticaloffices, www.olivierdesbarres.co.uk Note: includes India, Indonesia, Korea, Malaysia, Philippines, Singapore, Taiwan and Thailand Source: China customs, www.olivierdesbarres.co.uk Figure 6: …and were weak in Korea and Taiwan in April Figure 7: Export volumes have flat-lined for 18 months Source: National statisticaloffices, www.olivierdesbarres.co.uk Source: National statisticaloffices, www.olivierdesbarres.co.uk Note: the USD-value of exports is deflated by a GDP- weighted basket of NJA exchange rates vs the US dollar (includes INR, IDR, KRW, MYR,PHP, SGD, THB and TWD) Incentives for central banks to fade or even reverse currency moves 450 490 530 570 610 Mar-10 Aug-10 Jan-11 Jun-11 Nov-11 Apr-12 Sep-12 Feb-13 Jul-13 Dec-13 May-14 Oct-14 Mar-15 NJA merchandise exports (excluding China) seasonally adjusted 3-month moving average ($ bn) 350 400 450 500 550 600 650 Mar-10 Aug-10 Jan-11 Jun-11 Nov-11 Apr-12 Sep-12 Feb-13 Jul-13 Dec-13 May-14 Oct-14 Mar-15 China merchandise exports seasonally adjusted 3m moving average ($ bn) 30 50 70 90 110 130 150 Jan-09 Jul-09 Jan-10 Jul-10 Jan-11 Jul-11 Jan-12 Jul-12 Jan-13 Jul-13 Jan-14 Jul-14 Jan-15 Korea Taiwan Merchandise exports seasonally adjusted 3m moving average ($ bn) 2.0 2.2 2.4 2.6 2.8 3.0 3.2 3.4 3.6 3.8 4.0 Jan-09 Jul-09 Jan-10 Jul-10 Jan-11 Jul-11 Jan-12 Jul-12 Jan-13 Jul-13 Jan-14 Jul-14 Jan-15 NJA merchandise exports (excluding China), adjusted for seasonality and currency moves (index) *
- 4. Precedent suggests that outside of periods of major financial shocks (e.g. 2008-2009), these bouts of currency depreciation are reasonably shallow and short-lived and typically followed by similarly shallow and short-lived bouts of currency appreciation (Figure 2). It’s a similar picture for the CNY (Figure 3). This pattern of mean-reversion reflects in part the ebbs and flows of foreign FX flows and seasonality of current account flows – for example the rise in worker remittances to the Philippines in the run-up to Christmas. Importantly, it also reflects NJA central banks’ willingness and ability to smooth the path of their currencies via intervention in the FX market and/or verbal intervention. They have to balance the competitiveness of their currencies and large export sectors on the one hand with imported inflation and the cost of servicing foreign-currency denominated debt on the other. NJA exports have weakened in recent months, as detailed above, giving central banks the incentive to allow a modicum of currency weakening and support export competitiveness. Importantly, inflation has also weakened to multi-year lows (see Figure 8) which has given NJA central banks the room to maintain loose monetary conditions – i.e. low interest rates and weaker currencies. Figure 8: NJA-inflation has fallen to multi-year lows Figure 9: Volatility in IDR NEER has eroded significantly in the past 18 months Source: National statisticaloffices, www.olivierdesbarres.co.uk Note: Wholesale Price Inflation for India Source: www.olivierdesbarres.co.uk,Investing.com FX debt in NJA remains modest both by historical and EM standards and is partly currency and earnings hedged but the increase in FX-denominated corporate debt and servicing costs, notably in China, does provide policy-makers with an argument in favour of a stable or mildly appreciating local currency. Furthermore, central banks of countries with historically volatile currencies – Indonesia for example – have come a long way in successfully fading FX peaks and troughs (see Figure 9). I would therefore expect NJA central banks to be biased towards stability in their currencies, or even modest and slow appreciation, in coming weeks. Underlying flows are unlikely to support rapid or sustained. Modest global growth and demand is likely to curb Asian exports while the uncertainty about the timing of Fed rate hikes may dampen FX inflows into Asia. 0 1 2 3 4 5 6 7 8 9 Including China Excluding China GDP-weighted CPI-inflation, % year-on-year* -10 -8 -6 -4 -2 0 2 4 6 8 10 Apr10 Sep10 Feb11 Jul11 Dec11 May12 Oct12 Mar13 Aug13 Jan14 Jun14 Nov14 Apr15 Month-on-month % change in IDR nominal effective exchange rate