1. Avant Garde Wealth Management Pvt. Ltd.
Contents
Market cap to GDP – India's valuation in a global context
Inflation expectations and equity returns – Flashing red
Portfolio positioning – Higher equity exposure but remain cautious
Stocks in the portfolio – A few additions
Portfolio performance – In line with the index
Dear investor,
Investor sentiment on Indian equities is extremely bullish and markets continue to rally almost in a
straight line. The new government does seem to be working towards increasing India's economic
productivity so we can only hope they remain on this path. So far domestic economic activity has
remained subdued but there are expectations of a pickup materialising in short order. In this letter
we consider India's equity valuations in a global context and analyze the potential impact of falling
global inflation expectations on equity returns.
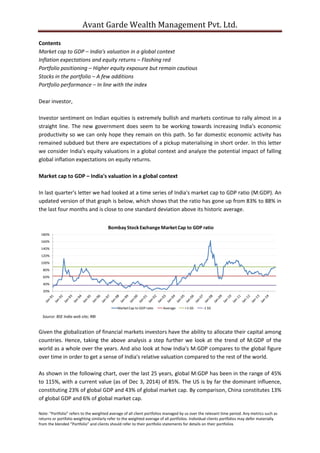
Market cap to GDP – India's valuation in a global context
In last quarter's letter we had looked at a time series of India's market cap to GDP ratio (M:GDP). An
updated version of that graph is below, which shows that the ratio has gone up from 83% to 88% in
the last four months and is close to one standard deviation above its historic average.
180%
160%
140%
120%
100%
80%
60%
40%
20%
Source: BSE India web site; RBI
Bombay Stock Exchange Market Cap to GDP ratio
Market Cap to GDP ratio Average +1 SD -1 SD
Given the globalization of financial markets investors have the ability to allocate their capital among
countries. Hence, taking the above analysis a step further we look at the trend of M:GDP of the
world as a whole over the years. And also look at how India's M:GDP compares to the global figure
over time in order to get a sense of India's relative valuation compared to the rest of the world.
As shown in the following chart, over the last 25 years, global M:GDP has been in the range of 45%
to 115%, with a current value (as of Dec 3, 2014) of 85%. The US is by far the dominant influence,
constituting 23% of global GDP and 43% of global market cap. By comparison, China constitutes 13%
of global GDP and 6% of global market cap.
Note: “Portfolio” refers to the weighted average of all client portfolios managed by us over the relevant time period. Any metrics such as
returns or portfolio weighting similarly refer to the weighted average of all portfolios. Individual clients portfolios may defer materially
from the blended “Portfolio” and clients should refer to their portfolio statements for details on their portfolios
2. Avant Garde Wealth Management Pvt. Ltd.
120%
110%
100%
90%
80%
70%
60%
50%
40%
Global market cap to GDP
1988
1989
1990
1991
1992
1993
1994
1995
1996
1997
1998
1999
2000
2001
2002
2003
2004
2005
2006
2007
2008
2009
2010
2011
2012
2013
2014
Source: World Bank; IMF; Yahoo Finance
China's equity market performance over the last few years has been dismal relative to its reported
GDP growth. So unsurprisingly, excluding China from the above analysis makes the current ratio look
slightly higher relative to its history.
120%
110%
100%
90%
80%
70%
60%
50%
40%
1988
1989
1990
1991
1992
1993
1994
1995
1996
1997
1998
1999
2000
2001
2002
2003
2004
2005
2006
2007
2008
2009
2010
2011
2012
2013
2014 Global market cap to GDP (ex-China)
Source: World Bank; IMF; Yahoo Finance
Around the turn of the century the ratio of India's M:GDP to global M:GDP (shown below) was
around 0.3x. This ratio went as high as 1.25x in 2007 and now sits at 1.05x.
1.5
1.3
1.1
0.9
0.7
0.5
0.3
0.1
India MCap to GDP relative to World MCap to GDP
Average
1988
1989
1990
1991
1992
1993
1994
1995
1996
1997
1998
1999
2000
2001
2002
2003
2004
2005
2006
2007
2008
2009
2010
2011
2012
2013
2014
Source: World Bank; IMF; Yahoo Finance; BSE India web site
Note: “Portfolio” refers to the weighted average of all client portfolios managed by us over the relevant time period. Any metrics such as
returns or portfolio weighting similarly refer to the weighted average of all portfolios. Individual clients portfolios may defer materially
from the blended “Portfolio” and clients should refer to their portfolio statements for details on their portfolios
3. Avant Garde Wealth Management Pvt. Ltd.
Readers know that we have been wary of downside risks in global equity markets, led by the USA. In
the context of relative valuation, India's M:GDP ratio may not have much higher to go relative to the
rest of the world. So in case of a meaningful correction in global equities the Indian market may not
prove particularly resilient, irrespective of domestic fundamentals. Additionally, if for some reason
there is an adverse change in investor perception of India, and the Indian M:GDP to global M:GDP
ratio mean reverts towards 0.6x from 1.05x currently, there is potential for a significant decline in
Indian equities. While the latter scenario seems to have low probability as of now it is worth keeping
in mind.
Inflation expectations and equity returns – Flashing red
Since the 2008 financial crisis, Central Bank policies (led by that of the US Federal Reserve) have
arguably been the key driver of asset returns, especially for equities. In a world awash in debt, it
seems that nothing will scare a central banker more than the prospect of deflation. In a deflationary
environment the real burden of debt increases, penalizing borrowers and benefiting savers. Since
today's central bankers (with some exceptions) view the world through the prism of financial
markets, their policy decisions are highly influenced by the need to ensure that inflation does not fall
close to or below the zero threshold.
Similarly, equity markets do not seem to respond well to periods of low and falling inflation
expectations. Using US 5-yr TIPS implied inflation as a proxy for inflation expectations, the chart
below shows a fairly tight correlation of inflation expectations with the S&P500 index1.
3.0%
2.0%
1.0%
0.0%
-1.0%
-2.0%
Source: Datastream
2000
1000
500
5-yr TIPS implied inflation expectation (LHS) S&P500 Index (RHS)
Historically, rising equity markets have been accompanied by low but rising inflation expectations
and falling equity markets with low and declining inflation expectations2. In the last 27 years there
have been two extended periods of material "divergence" between the direction of equity prices
1 It is worth pointing out that while a correlation exists the magnitude of moves will obviously be very different. While
inflation expectations will vary within a range, equity markets tend to appreciate over time
2 The historical context here is limited to the last 27 years and indeed there were periods like the 1970s when very high
levels of inflation were coincident with very low equity prices. However, in the period depicted in the graph, inflation
expectations have never been too high and therefore a comparison may not be relevant
Note: “Portfolio” refers to the weighted average of all client portfolios managed by us over the relevant time period. Any metrics such as
returns or portfolio weighting similarly refer to the weighted average of all portfolios. Individual clients portfolios may defer materially
from the blended “Portfolio” and clients should refer to their portfolio statements for details on their portfolios
4. Avant Garde Wealth Management Pvt. Ltd.
and inflation expectations. From late 1997 through mid 1998 equity markets rallied in the face of
declining inflation expectations. This was eventually resolved through a sharp but brief equity
market correction in 1998 during the so called "Asian crisis", followed by a rally in both equities and
inflation expectations. The second period of significant divergence has been persisting since early
2013. While the S&P500 has rallied about 30% from early 2013 to present, inflation expectations
have dropped from >2% to ~1.4% as of last count.
Inflation expectations also have a strong correlation with the broader emerging markets as
represented by the MSCI Emerging Markets Index.
3.0%
2.5%
2.0%
1.5%
1.0%
0.5%
0.0%
5-yr TIPS implied inflation expectation (LHS)
MSCI Emerging Markets Index (RHS)
Source: Datastream
800
400
200
1600
800
400
3.0%
2.5%
2.0%
1.5%
1.0%
0.5%
0.0%
5-yr TIPS implied inflation expectation (LHS)
MSCI Emerging Markets Index (RHS)
Similarly, the historic correlation with the Nifty index is very strong as well. However, as with the
S&P500, a significant divergence has developed between the two since early 2013.
3.0%
2.5%
2.0%
1.5%
1.0%
0.5%
0.0%
5-yr TIPS implied inflation expectation (LHS) Nifty (RHS)
Source: Datastream; NSE India web site
3200
1600
800
400
9000
4500
2250
3.0%
2.5%
2.0%
1.5%
1.0%
0.5%
0.0%
5-yr TIPS implied inflation expectation (LHS) Nifty (RHS)
The recent sharp decline in oil prices is only exacerbating the disinflationary impulse in the world's
large economies (US, Europe, China and Japan), which are the ones weighed down by the largest
amounts of debt in proportion to GDP. While some of the decline in oil prices is likely supply driven,
coincident declines across a wide variety of base metals, including iron ore and copper, point
towards deficient demand as the primary cause of declining inflation expectations.
Note: “Portfolio” refers to the weighted average of all client portfolios managed by us over the relevant time period. Any metrics such as
returns or portfolio weighting similarly refer to the weighted average of all portfolios. Individual clients portfolios may defer materially
from the blended “Portfolio” and clients should refer to their portfolio statements for details on their portfolios
5. Avant Garde Wealth Management Pvt. Ltd.
In addition, Japan is effectively exporting deflation to the world through its policy of Yen
depreciation via large scale debt monetization. In the event that China is forced to follow suit
through a significant RMB depreciation at some point, the deflationary shock could be compounded
significantly. There is about $9 trillion in US$ credit given to non-banks outside the USA3. The dollar
has been strengthening against most currencies. Using the DXY Index as a proxy, the US dollar is
potentially reversing a multi-decade decline and entering a bull market. This is deflationary for the
US economy and financially destabilizing for the borrowers, of which a large number are likely to be
unhedged. Additionally, about 45% of the $9 trillion dollar credit is accounted for by non-banks,
which tends to be less sticky and more vulnerable to reversals. Currency movements need to be
watched carefully in the time ahead as they could be both a symptom and cause of disruptive moves
in other financial markets.
Central bankers have been unable to engineer higher inflation for the past few years despite their
policies of zero interest rates and consistent and large scale quantitative easing. While they may
have more bullets left in their arsenal, disinflation seems to be the dominant theme for now. Based
on history, the divergence between falling inflation expectations and rising equity prices is unlikely
to persist for much longer. Either equities are going to correct meaningfully or inflation expectations
are going to turn around and head higher. At this time it seems that the former is more likely.
Portfolio positioning – Higher equity exposure but remain cautious
As of quarter end Sep 2014 we were 47% equity net long (64% long, 17% short), with 21% of the
portfolio in Gold and 15% in cash equivalents (the short positions are via futures). The long equity
portion increased substantially as we added to an existing position and included new stocks in the
portfolio. Simultaneously, we also added a new short position, taking up the short exposure.
We estimate that the long positions, despite significant price appreciation in the last nine months, in
aggregate still have about 40% upside to their intrinsic value under base assumptions. Under stress
scenarios the aggregate intrinsic value is 5% lower than current prices, indicating limited risk of
permanent capital loss. For our short positions we estimate base case intrinsic values approximately
25% below current prices and believe that the stocks are currently trading at their optimistic
estimates of intrinsic value.
While we keep a keen eye on macroeconomics developments and trends in various asset markets in
both India and globally, our intent is not to try and time the market. This should be evident from the
increase in our equity net long position (versus three months ago) despite our continued, and indeed
increased, caution on risks of a broad market correction. We will continue to add exposure in
individual stocks as and when we find value. When the overall risks seem high we are simply more
discerning in stock selection and weighting in the portfolio.
3 Source: "Financial stability risks: old and new", Hyun Song Shin, Bank of International Settlements, Dec 4 2014
Note: “Portfolio” refers to the weighted average of all client portfolios managed by us over the relevant time period. Any metrics such as
returns or portfolio weighting similarly refer to the weighted average of all portfolios. Individual clients portfolios may defer materially
from the blended “Portfolio” and clients should refer to their portfolio statements for details on their portfolios
6. Avant Garde Wealth Management Pvt. Ltd.
Stocks in the portfolio – A few additions
New positions added to the portfolio are SunTV Network, Sukhjit Starch, and DSP Blackrock World
Gold Fund. We added further to our position in Noida Toll Bridge, which is now the largest position
in the portfolio, followed by Gold, Blue Star, and SunTV in that order. The other positions of roughly
equivalent size are Manugraph, Sukhjit Starch, Thangamayil, DSPBR World Gold Fund, and Jagran
Prakashan.
We added to our position in Noida Toll Bridge even at current prices as the risk reward remains
extremely compelling, especially in the context of other investment opportunities available. The
stock trades at ~7.5x FY15e P/E with an estimated dividend yield of ~12%. The company has no debt
and is paying out all its earnings as dividends. Earnings and cash flows will continue to grow over
time through a combination of traffic increases and tariff hikes. Outside of extreme regulatory
action, which is very low probability, it is difficult to see downside from the current stock price.
Indeed, the total return from the stock should range between 50%-100% over the next two years.
After having sold our SunTV position earlier in 2014 we have rebuilt a large position on a significant
decline in the stock price during the quarter. Our take on the business remains unchanged. This is a
high quality franchise with a strong competitive position and an excellent balance sheet. The noise
surrounding political troubles of the promoters, which is probably responsible for the recent stock
decline, should not have any material impact on business economics. At our average purchase price
the stock trades at ~19x FY15e P/E with a 3.5% dividend yield. Earnings are currently depressed in
our view and can comfortably double over the next 3 years. In this context current valuation seems
extremely attractive. By comparison, its peer Zee Entertainment currently trades at 40x P/E and the
Nifty P/E is 21x.
Sukhjit Starch and Chemicals is a manufacturer of starch and related value added products. This is a
commodity business which is well into the fourth year of a down cycle, with margins currently at
historic lows. We think the company's business cycle is turning up, which could result in high
earnings growth over the next one to two years as margins normalize. The stock trades at 10.5x TTM
P/E on what are depressed earnings. P/B valuation is only 1.1x and the company is valued well below
replacement cost. In our opinion the combination of reasonable to cheap valuation and improving
fundamentals warrants a small position in the portfolio.
The DSP Blackrock World Gold Fund in a feeder fund for the Blackrock World Gold Fund which
invests in gold mining equities globally. From both a price and sentiment perspective, gold mining
equities are one of the most depressed asset classes in the world today. Indexes that track gold
mining shares are at multi decade lows even relative to the price of Gold. Clearly the fundamentals
of these companies are tied to the price of Gold, but even from a micro perspective capital allocation
and cost control across the industry seems to be improving after a long period of excess and
misallocation. This change in industry dynamics, coupled with our positive view on Gold, lead us to
believe that the risk/reward in this sector is extremely compelling. The Blackrock Fund has
historically been a reasonable performer relative to peers and seems like a good vehicle to gain
exposure to this asset class.
Note: “Portfolio” refers to the weighted average of all client portfolios managed by us over the relevant time period. Any metrics such as
returns or portfolio weighting similarly refer to the weighted average of all portfolios. Individual clients portfolios may defer materially
from the blended “Portfolio” and clients should refer to their portfolio statements for details on their portfolios
7. Avant Garde Wealth Management Pvt. Ltd.
Portfolio performance – In line with the index
In the 3.2 years from inception in June 2011 till end September 2014 the portfolio is up 38.6% while
our benchmark, the BSE500 index, is up 41.5%. This translates into a CAGR of 10.3% for the portfolio
vs. 11% for the benchmark. Of late, portfolio performance has been particularly dragged down by
our Gold and short positions. Additionally, after initial sharp rallies in the first half of the year, most
of our long equity positions have not appreciated much in the past 3 months even as the broader
markets have continued to head higher.
50%
40%
30%
20%
10%
0%
-10%
-20%
-30%
Cumulative portfolio returns vs. Index
41.5%
38.6%
6-Jun-11
6-Jul-11
6-Aug-11
6-Sep-11
6-Oct-11
6-Nov-11
6-Dec-11
6-Jan-12
6-Feb-12
6-Mar-12
6-Apr-12
6-May-12
6-Jun-12
6-Jul-12
6-Aug-12
6-Sep-12
6-Oct-12
6-Nov-12
6-Dec-12
6-Jan-13
6-Feb-13
6-Mar-13
6-Apr-13
6-May-13
6-Jun-13
6-Jul-13
6-Aug-13
6-Sep-13
6-Oct-13
6-Nov-13
6-Dec-13
6-Jan-14
6-Feb-14
6-Mar-14
6-Apr-14
6-May-14
6-Jun-14
6-Jul-14
6-Aug-14
6-Sep-14
NAV (pre-fee) BSE500 Index
We are confident that we are investing your money prudently such that there is a high probability of
reasonable absolute returns while significantly limiting the risk of permanent capital loss. Over time
this should result in higher than index returns as well. During periods of extremely positive market
sentiment it will usually be tough for us to outperform the indexes. Indeed we will be quite happy if
we can continue to keep up with the broader markets. While the future looks extremely rosy as of
now, sentiment is an extremely fickle beast and should not be taken for granted. At any given point
in time there are various possible scenarios for the future state of the world, both at a macro and
micro level. While only one scenario eventually comes to pass it would be reckless to invest by
assigning 100% probability to any one outcome. Hence while we continue to search for companies
that have the potential for material price appreciation, our enthusiasm is tempered by the degree of
optimism that is already priced in.
Gaurav Jalan
December 7, 2014
Note: “Portfolio” refers to the weighted average of all client portfolios managed by us over the relevant time period. Any metrics such as
returns or portfolio weighting similarly refer to the weighted average of all portfolios. Individual clients portfolios may defer materially
from the blended “Portfolio” and clients should refer to their portfolio statements for details on their portfolios