SlideShare a Scribd company logo
1 of 5
Lifetime Evaluation vs. Measurement. Part4
Quantitative HALT
Give me a place to stand on,
and I will move the Earth
(Archimedes)
Its known HALT is an effective way to find the weaknesses in your product during the reliability
improvement program. In doing so, we view HALT as a qualitative test only. We cannot define
the reliability and lifetime of the product from its results. So, unfortunately, we cannot use
HALT for purposes of Type Certification, confirm the lifetime of Critical Parts, predict the
warranty and maintenance costs, which are required, for example, for aviation.
If we could combine the effectiveness of HALT (high acceleration of testing) with the benefits of
quantitative testing, we would get a very powerful tool for the Reliability Demonstration and the
Reliability Development of the new products.
Let us consider in detail why the HALT has not become a quantitative test so far and whether it
can become one.
We can get quantitative characteristics of reliability and lifetime by two methods. This is a
MEASUREMENT and EVALUATION (See Part 1).
HALT failure data is clearly not enough for the MEASUREMENT of reliability and lifetime due
to the small numbers of samples and failures.
Therefore, we can get quantitative characteristics only by the EVALUATION method.
And EVALUATION of reliability and lifetime is impossible due to a lack of mathematical
foundation, besides expressions like 1-CL=Rn with its inherent disadvantages (See Part 2) and
software tools, besides Reliasoft's Weibull++ DRT utility. This impasse is the reason that the
HALT remains qualitative.
The way out of this impasse is the creation of a new mathematical foundation by explicit
consideration of uncertainty and its resolution by the worst-case method (Part 3). "Give me a
place to stand on, and I will move the Earth" (Archimedes). THIS IS THE PLACE! We do not
know something. Let us make evaluations and build the best control based on the worst-case
scenario.
There are simple formulas (Part 3). Unfortunately, this is where the simplicity ends:
1. We must consider all possible events (often dependent) during testing and operation of the
product and calculate their probabilities. As Kozma Prutkov used to say, "You can't grasp the
immensity!"
2. What is the indicator of the worst case? For some, it is a risk, for another it is safety. A more
general indicator of the worst case can be the Life Cycle Cost of the product.
This approach is implemented in the software tool Life Cycle Simulator, which calculates the
quantitative characteristics of reliability and lifetime from HALT data.
Even more interesting tasks that the Simulator solves are:
- Finding the best-accelerated testing modes that will provide the smallest Life Cycle Cost for a
given Time to Market.
- Search and foundation for absolutely new test acceleration methods.
We can make a simple example to demonstrate this approach. This example is so simple that we
can do calculations in Excel.
We are making a Reliability Improving Program of the product. The expected product launch
program is 50 units. The warranty lifetime is 6000 hours. The warranty costs are $20 per failure.
The product has one failure mode with a normal distribution of lifetime. The lifetime expectation
is unknown, but it is in the range of 3000 - 13000 hours. The standard deviation is 900 hours.
The Reliability Improvement Program of the Product includes the testing of one product. The
cost of the product for testing is $15. The cost of the testing gas-hour is $0.01.
If a product passes the test, it goes into production. The production cost of the basic version is
$10 per product. If the product fails the test, we redesign the product. The cost of the redesign is
$10. The production cost of the redesigned version is $12 per product. We suppose the modified
product does not fail for warranty lifetime
Applying this approach, we review the uncertainty of the lifetime expectation (from 3000 to
13000 hours). Let the duration of our test will be 6,000 hours for example. Then we will have
probabilities of passing the test as shown in Line 1 of Table 1.
The expectation of the Development cost (including the cost of the product to test, the cost of the
test itself, and the cost of the redesign, if necessary) calculated for the discrete distribution is
shown in Line 2 of Table 1.
The expectation of the Manufacture cost (considering the production of basic or modified
versions) calculated for the discrete distribution is shown in Line 3 of Table 1.
The expectation of the Warranty cost calculated by Poisson distribution is shown in Line 4 of
Table 1.
The total cost of the product life cycle is shown in Line 5 of Table 1.
Brief explanation: as the life of the product increases, the probability of passing the test increases
from 0 to 1. The expectation of the development cost decreases from $85 to $75 due to the
decrease in the probability of redesign. The expected manufacture cost is reduced from $600 to
$500 due to the reduced probability of producing a more expensive redesigned version. The
expected warranty cost first rises from 0 to $250 and then decreases to 0. This is due to the fact
that a bad product will be identified in testing and redesigned, and warranty costs will be
minimal. A good product will have minimal warranty costs too. The middle of uncertainty is the
worst! The life cycle cost of the product is a maximum of $880 with an expected lifetime of
6000 hours.
We solved the problem of uncertainty by looking for the worst case. Now we can find the best
control (test time) at which the life cycle cost is minimal (See Table 2). This is $710 with a test
time of 8000 hours.
We can also find the best control (the number of samples for testing) at which the life cycle cost
is minimal. In this case, an increase in the number of tested samples from 1 to 2 and 3 increases
the expected life cycle cost from 710 to 787 and 859, which are not beneficial. If we don't test,
the expected life cycle cost will be $ 1500.
The calculation on the Life Cycle Simulator gives us similar results (Fig. 1)
The Life Cycle Simulator is a very complex tool that considers simultaneously up to 12 failure
modes with different lifetime distributions (Weibull, lognormal, exponential, etc.) and up to 5
redesign options. The function of the goal can be not only the life cycle cost expectation, but also
cost with a given confidence level (for example CL=0,9 or 0,95). We can search for the best
acceleration test modes and found completely new accelerated test methods to meet the Time to
Market. There is a video of how the Life Cycle Simulator works on YouTube
(https://www.youtube.com/watch?v=0_RtgmAzATg&t=68s).
Table 1
Lifetime expectation, hours
3000 4000 5000 6000 7000 8000 9000 10000 11000 12000 13000
Prob. Of Pass 0,00043 0,01313 0,13326 0,50000 0,86674 0,98687 0,99957 1,00000 1,00000 1,00000 1,00000
Development cost 85,00 84,87 83,67 80,00 76,33 75,13 75,00 75,00 75,00 75,00 75,00
Manufacture cost 599,96 598,69 586,67 550,00 513,33 501,31 500,04 500,00 500,00 500,00 500
Warranty cost 0,43 12,96 115,50 250,00 115,50 12,96 0,43 0,00 0,00 0,00 0,0000
Life Cycle cost 685,38 696,52 785,84 880,00 705,16 589,41 575,48 575,00 575,00 575,00 575,00
Table 2
Testing
time
Max
LCS
5000 1053,37
5500 957,19
6000 880,00
6500 802,81
7000 746,97
7500 718,64
8000 710,12
8500 711,11
9000 715,31
9500 720,06
10000 725,01
Lifetime evaluation vs. measurement. part 4

More Related Content

Similar to Lifetime evaluation vs. measurement. part 4

Chap 9 A Process Capability & Spc Hk
Chap 9 A Process Capability & Spc HkChap 9 A Process Capability & Spc Hk
Chap 9 A Process Capability & Spc Hkajithsrc
 
Applied Reliability Symposium 2009 M Turner
Applied Reliability Symposium 2009 M TurnerApplied Reliability Symposium 2009 M Turner
Applied Reliability Symposium 2009 M TurnerMark Turner CRP
 
The International Journal of Engineering and Science
The International Journal of Engineering and ScienceThe International Journal of Engineering and Science
The International Journal of Engineering and Sciencetheijes
 
Production & Operation Management Chapter10[1]
Production & Operation Management Chapter10[1]Production & Operation Management Chapter10[1]
Production & Operation Management Chapter10[1]Hariharan Ponnusamy
 
Seminar presentation on reliability
Seminar presentation on reliabilitySeminar presentation on reliability
Seminar presentation on reliabilityRAHUL SINGH
 
Med day presentation
Med day presentationMed day presentation
Med day presentationCarsten Lund
 
Production & Operation Management Chapter9[1]
Production & Operation Management Chapter9[1]Production & Operation Management Chapter9[1]
Production & Operation Management Chapter9[1]Hariharan Ponnusamy
 
The Seven Habits of Highly Effective Test Facilities
The Seven Habits of Highly Effective Test FacilitiesThe Seven Habits of Highly Effective Test Facilities
The Seven Habits of Highly Effective Test FacilitiesWilhelm Graupner, Ph.D.
 
Software Testing Metrics
Software Testing MetricsSoftware Testing Metrics
Software Testing MetricsVladimir Arutin
 
EricKatzen_NEEG_Abstract_072616
EricKatzen_NEEG_Abstract_072616EricKatzen_NEEG_Abstract_072616
EricKatzen_NEEG_Abstract_072616Eric Katzen
 
Design and Analysis of Chute System to obtain World Class OEE
Design and Analysis of Chute System to obtain World Class OEEDesign and Analysis of Chute System to obtain World Class OEE
Design and Analysis of Chute System to obtain World Class OEEijsrd.com
 
Aco based solution for tsp model for evaluation of software test suite
Aco based solution for tsp model for evaluation of software test suiteAco based solution for tsp model for evaluation of software test suite
Aco based solution for tsp model for evaluation of software test suiteIAEME Publication
 
Aco based solution for tsp model for evaluation of software test suite
Aco based solution for tsp model for evaluation of software test suiteAco based solution for tsp model for evaluation of software test suite
Aco based solution for tsp model for evaluation of software test suiteIAEME Publication
 
Aco based solution for tsp model for evaluation of software test suite
Aco based solution for tsp model for evaluation of software test suiteAco based solution for tsp model for evaluation of software test suite
Aco based solution for tsp model for evaluation of software test suiteIAEME Publication
 
Continuous Sampling Planning
Continuous Sampling PlanningContinuous Sampling Planning
Continuous Sampling Planningahmad bassiouny
 

Similar to Lifetime evaluation vs. measurement. part 4 (20)

Accelerated Stress Testing
Accelerated Stress TestingAccelerated Stress Testing
Accelerated Stress Testing
 
Chap 9 A Process Capability & Spc Hk
Chap 9 A Process Capability & Spc HkChap 9 A Process Capability & Spc Hk
Chap 9 A Process Capability & Spc Hk
 
Applied Reliability Symposium 2009 M Turner
Applied Reliability Symposium 2009 M TurnerApplied Reliability Symposium 2009 M Turner
Applied Reliability Symposium 2009 M Turner
 
The International Journal of Engineering and Science
The International Journal of Engineering and ScienceThe International Journal of Engineering and Science
The International Journal of Engineering and Science
 
Production & Operation Management Chapter10[1]
Production & Operation Management Chapter10[1]Production & Operation Management Chapter10[1]
Production & Operation Management Chapter10[1]
 
Chapter10[1]
Chapter10[1]Chapter10[1]
Chapter10[1]
 
Seminar presentation on reliability
Seminar presentation on reliabilitySeminar presentation on reliability
Seminar presentation on reliability
 
Med day presentation
Med day presentationMed day presentation
Med day presentation
 
Production & Operation Management Chapter9[1]
Production & Operation Management Chapter9[1]Production & Operation Management Chapter9[1]
Production & Operation Management Chapter9[1]
 
Chapter9[1]
Chapter9[1]Chapter9[1]
Chapter9[1]
 
The Seven Habits of Highly Effective Test Facilities
The Seven Habits of Highly Effective Test FacilitiesThe Seven Habits of Highly Effective Test Facilities
The Seven Habits of Highly Effective Test Facilities
 
Case Study of Petroleum Consumption With R Code
Case Study of Petroleum Consumption With R CodeCase Study of Petroleum Consumption With R Code
Case Study of Petroleum Consumption With R Code
 
Doe
DoeDoe
Doe
 
Software Testing Metrics
Software Testing MetricsSoftware Testing Metrics
Software Testing Metrics
 
EricKatzen_NEEG_Abstract_072616
EricKatzen_NEEG_Abstract_072616EricKatzen_NEEG_Abstract_072616
EricKatzen_NEEG_Abstract_072616
 
Design and Analysis of Chute System to obtain World Class OEE
Design and Analysis of Chute System to obtain World Class OEEDesign and Analysis of Chute System to obtain World Class OEE
Design and Analysis of Chute System to obtain World Class OEE
 
Aco based solution for tsp model for evaluation of software test suite
Aco based solution for tsp model for evaluation of software test suiteAco based solution for tsp model for evaluation of software test suite
Aco based solution for tsp model for evaluation of software test suite
 
Aco based solution for tsp model for evaluation of software test suite
Aco based solution for tsp model for evaluation of software test suiteAco based solution for tsp model for evaluation of software test suite
Aco based solution for tsp model for evaluation of software test suite
 
Aco based solution for tsp model for evaluation of software test suite
Aco based solution for tsp model for evaluation of software test suiteAco based solution for tsp model for evaluation of software test suite
Aco based solution for tsp model for evaluation of software test suite
 
Continuous Sampling Planning
Continuous Sampling PlanningContinuous Sampling Planning
Continuous Sampling Planning
 

Recently uploaded

HARMONY IN THE NATURE AND EXISTENCE - Unit-IV
HARMONY IN THE NATURE AND EXISTENCE - Unit-IVHARMONY IN THE NATURE AND EXISTENCE - Unit-IV
HARMONY IN THE NATURE AND EXISTENCE - Unit-IVRajaP95
 
(PRIYA) Rajgurunagar Call Girls Just Call 7001035870 [ Cash on Delivery ] Pun...
(PRIYA) Rajgurunagar Call Girls Just Call 7001035870 [ Cash on Delivery ] Pun...(PRIYA) Rajgurunagar Call Girls Just Call 7001035870 [ Cash on Delivery ] Pun...
(PRIYA) Rajgurunagar Call Girls Just Call 7001035870 [ Cash on Delivery ] Pun...ranjana rawat
 
APPLICATIONS-AC/DC DRIVES-OPERATING CHARACTERISTICS
APPLICATIONS-AC/DC DRIVES-OPERATING CHARACTERISTICSAPPLICATIONS-AC/DC DRIVES-OPERATING CHARACTERISTICS
APPLICATIONS-AC/DC DRIVES-OPERATING CHARACTERISTICSKurinjimalarL3
 
Software Development Life Cycle By Team Orange (Dept. of Pharmacy)
Software Development Life Cycle By  Team Orange (Dept. of Pharmacy)Software Development Life Cycle By  Team Orange (Dept. of Pharmacy)
Software Development Life Cycle By Team Orange (Dept. of Pharmacy)Suman Mia
 
Microscopic Analysis of Ceramic Materials.pptx
Microscopic Analysis of Ceramic Materials.pptxMicroscopic Analysis of Ceramic Materials.pptx
Microscopic Analysis of Ceramic Materials.pptxpurnimasatapathy1234
 
Call Girls Service Nagpur Tanvi Call 7001035870 Meet With Nagpur Escorts
Call Girls Service Nagpur Tanvi Call 7001035870 Meet With Nagpur EscortsCall Girls Service Nagpur Tanvi Call 7001035870 Meet With Nagpur Escorts
Call Girls Service Nagpur Tanvi Call 7001035870 Meet With Nagpur EscortsCall Girls in Nagpur High Profile
 
The Most Attractive Pune Call Girls Budhwar Peth 8250192130 Will You Miss Thi...
The Most Attractive Pune Call Girls Budhwar Peth 8250192130 Will You Miss Thi...The Most Attractive Pune Call Girls Budhwar Peth 8250192130 Will You Miss Thi...
The Most Attractive Pune Call Girls Budhwar Peth 8250192130 Will You Miss Thi...ranjana rawat
 
(ANJALI) Dange Chowk Call Girls Just Call 7001035870 [ Cash on Delivery ] Pun...
(ANJALI) Dange Chowk Call Girls Just Call 7001035870 [ Cash on Delivery ] Pun...(ANJALI) Dange Chowk Call Girls Just Call 7001035870 [ Cash on Delivery ] Pun...
(ANJALI) Dange Chowk Call Girls Just Call 7001035870 [ Cash on Delivery ] Pun...ranjana rawat
 
VIP Call Girls Service Kondapur Hyderabad Call +91-8250192130
VIP Call Girls Service Kondapur Hyderabad Call +91-8250192130VIP Call Girls Service Kondapur Hyderabad Call +91-8250192130
VIP Call Girls Service Kondapur Hyderabad Call +91-8250192130Suhani Kapoor
 
Call for Papers - African Journal of Biological Sciences, E-ISSN: 2663-2187, ...
Call for Papers - African Journal of Biological Sciences, E-ISSN: 2663-2187, ...Call for Papers - African Journal of Biological Sciences, E-ISSN: 2663-2187, ...
Call for Papers - African Journal of Biological Sciences, E-ISSN: 2663-2187, ...Christo Ananth
 
Sheet Pile Wall Design and Construction: A Practical Guide for Civil Engineer...
Sheet Pile Wall Design and Construction: A Practical Guide for Civil Engineer...Sheet Pile Wall Design and Construction: A Practical Guide for Civil Engineer...
Sheet Pile Wall Design and Construction: A Practical Guide for Civil Engineer...Dr.Costas Sachpazis
 
IMPLICATIONS OF THE ABOVE HOLISTIC UNDERSTANDING OF HARMONY ON PROFESSIONAL E...
IMPLICATIONS OF THE ABOVE HOLISTIC UNDERSTANDING OF HARMONY ON PROFESSIONAL E...IMPLICATIONS OF THE ABOVE HOLISTIC UNDERSTANDING OF HARMONY ON PROFESSIONAL E...
IMPLICATIONS OF THE ABOVE HOLISTIC UNDERSTANDING OF HARMONY ON PROFESSIONAL E...RajaP95
 
(MEERA) Dapodi Call Girls Just Call 7001035870 [ Cash on Delivery ] Pune Escorts
(MEERA) Dapodi Call Girls Just Call 7001035870 [ Cash on Delivery ] Pune Escorts(MEERA) Dapodi Call Girls Just Call 7001035870 [ Cash on Delivery ] Pune Escorts
(MEERA) Dapodi Call Girls Just Call 7001035870 [ Cash on Delivery ] Pune Escortsranjana rawat
 
Model Call Girl in Narela Delhi reach out to us at 🔝8264348440🔝
Model Call Girl in Narela Delhi reach out to us at 🔝8264348440🔝Model Call Girl in Narela Delhi reach out to us at 🔝8264348440🔝
Model Call Girl in Narela Delhi reach out to us at 🔝8264348440🔝soniya singh
 
UNIT-V FMM.HYDRAULIC TURBINE - Construction and working
UNIT-V FMM.HYDRAULIC TURBINE - Construction and workingUNIT-V FMM.HYDRAULIC TURBINE - Construction and working
UNIT-V FMM.HYDRAULIC TURBINE - Construction and workingrknatarajan
 
Coefficient of Thermal Expansion and their Importance.pptx
Coefficient of Thermal Expansion and their Importance.pptxCoefficient of Thermal Expansion and their Importance.pptx
Coefficient of Thermal Expansion and their Importance.pptxAsutosh Ranjan
 
Introduction to IEEE STANDARDS and its different types.pptx
Introduction to IEEE STANDARDS and its different types.pptxIntroduction to IEEE STANDARDS and its different types.pptx
Introduction to IEEE STANDARDS and its different types.pptxupamatechverse
 
Decoding Kotlin - Your guide to solving the mysterious in Kotlin.pptx
Decoding Kotlin - Your guide to solving the mysterious in Kotlin.pptxDecoding Kotlin - Your guide to solving the mysterious in Kotlin.pptx
Decoding Kotlin - Your guide to solving the mysterious in Kotlin.pptxJoão Esperancinha
 
UNIT-III FMM. DIMENSIONAL ANALYSIS
UNIT-III FMM.        DIMENSIONAL ANALYSISUNIT-III FMM.        DIMENSIONAL ANALYSIS
UNIT-III FMM. DIMENSIONAL ANALYSISrknatarajan
 

Recently uploaded (20)

HARMONY IN THE NATURE AND EXISTENCE - Unit-IV
HARMONY IN THE NATURE AND EXISTENCE - Unit-IVHARMONY IN THE NATURE AND EXISTENCE - Unit-IV
HARMONY IN THE NATURE AND EXISTENCE - Unit-IV
 
(PRIYA) Rajgurunagar Call Girls Just Call 7001035870 [ Cash on Delivery ] Pun...
(PRIYA) Rajgurunagar Call Girls Just Call 7001035870 [ Cash on Delivery ] Pun...(PRIYA) Rajgurunagar Call Girls Just Call 7001035870 [ Cash on Delivery ] Pun...
(PRIYA) Rajgurunagar Call Girls Just Call 7001035870 [ Cash on Delivery ] Pun...
 
APPLICATIONS-AC/DC DRIVES-OPERATING CHARACTERISTICS
APPLICATIONS-AC/DC DRIVES-OPERATING CHARACTERISTICSAPPLICATIONS-AC/DC DRIVES-OPERATING CHARACTERISTICS
APPLICATIONS-AC/DC DRIVES-OPERATING CHARACTERISTICS
 
Software Development Life Cycle By Team Orange (Dept. of Pharmacy)
Software Development Life Cycle By  Team Orange (Dept. of Pharmacy)Software Development Life Cycle By  Team Orange (Dept. of Pharmacy)
Software Development Life Cycle By Team Orange (Dept. of Pharmacy)
 
Microscopic Analysis of Ceramic Materials.pptx
Microscopic Analysis of Ceramic Materials.pptxMicroscopic Analysis of Ceramic Materials.pptx
Microscopic Analysis of Ceramic Materials.pptx
 
Call Girls Service Nagpur Tanvi Call 7001035870 Meet With Nagpur Escorts
Call Girls Service Nagpur Tanvi Call 7001035870 Meet With Nagpur EscortsCall Girls Service Nagpur Tanvi Call 7001035870 Meet With Nagpur Escorts
Call Girls Service Nagpur Tanvi Call 7001035870 Meet With Nagpur Escorts
 
The Most Attractive Pune Call Girls Budhwar Peth 8250192130 Will You Miss Thi...
The Most Attractive Pune Call Girls Budhwar Peth 8250192130 Will You Miss Thi...The Most Attractive Pune Call Girls Budhwar Peth 8250192130 Will You Miss Thi...
The Most Attractive Pune Call Girls Budhwar Peth 8250192130 Will You Miss Thi...
 
(ANJALI) Dange Chowk Call Girls Just Call 7001035870 [ Cash on Delivery ] Pun...
(ANJALI) Dange Chowk Call Girls Just Call 7001035870 [ Cash on Delivery ] Pun...(ANJALI) Dange Chowk Call Girls Just Call 7001035870 [ Cash on Delivery ] Pun...
(ANJALI) Dange Chowk Call Girls Just Call 7001035870 [ Cash on Delivery ] Pun...
 
VIP Call Girls Service Kondapur Hyderabad Call +91-8250192130
VIP Call Girls Service Kondapur Hyderabad Call +91-8250192130VIP Call Girls Service Kondapur Hyderabad Call +91-8250192130
VIP Call Girls Service Kondapur Hyderabad Call +91-8250192130
 
Call for Papers - African Journal of Biological Sciences, E-ISSN: 2663-2187, ...
Call for Papers - African Journal of Biological Sciences, E-ISSN: 2663-2187, ...Call for Papers - African Journal of Biological Sciences, E-ISSN: 2663-2187, ...
Call for Papers - African Journal of Biological Sciences, E-ISSN: 2663-2187, ...
 
Sheet Pile Wall Design and Construction: A Practical Guide for Civil Engineer...
Sheet Pile Wall Design and Construction: A Practical Guide for Civil Engineer...Sheet Pile Wall Design and Construction: A Practical Guide for Civil Engineer...
Sheet Pile Wall Design and Construction: A Practical Guide for Civil Engineer...
 
IMPLICATIONS OF THE ABOVE HOLISTIC UNDERSTANDING OF HARMONY ON PROFESSIONAL E...
IMPLICATIONS OF THE ABOVE HOLISTIC UNDERSTANDING OF HARMONY ON PROFESSIONAL E...IMPLICATIONS OF THE ABOVE HOLISTIC UNDERSTANDING OF HARMONY ON PROFESSIONAL E...
IMPLICATIONS OF THE ABOVE HOLISTIC UNDERSTANDING OF HARMONY ON PROFESSIONAL E...
 
(MEERA) Dapodi Call Girls Just Call 7001035870 [ Cash on Delivery ] Pune Escorts
(MEERA) Dapodi Call Girls Just Call 7001035870 [ Cash on Delivery ] Pune Escorts(MEERA) Dapodi Call Girls Just Call 7001035870 [ Cash on Delivery ] Pune Escorts
(MEERA) Dapodi Call Girls Just Call 7001035870 [ Cash on Delivery ] Pune Escorts
 
★ CALL US 9953330565 ( HOT Young Call Girls In Badarpur delhi NCR
★ CALL US 9953330565 ( HOT Young Call Girls In Badarpur delhi NCR★ CALL US 9953330565 ( HOT Young Call Girls In Badarpur delhi NCR
★ CALL US 9953330565 ( HOT Young Call Girls In Badarpur delhi NCR
 
Model Call Girl in Narela Delhi reach out to us at 🔝8264348440🔝
Model Call Girl in Narela Delhi reach out to us at 🔝8264348440🔝Model Call Girl in Narela Delhi reach out to us at 🔝8264348440🔝
Model Call Girl in Narela Delhi reach out to us at 🔝8264348440🔝
 
UNIT-V FMM.HYDRAULIC TURBINE - Construction and working
UNIT-V FMM.HYDRAULIC TURBINE - Construction and workingUNIT-V FMM.HYDRAULIC TURBINE - Construction and working
UNIT-V FMM.HYDRAULIC TURBINE - Construction and working
 
Coefficient of Thermal Expansion and their Importance.pptx
Coefficient of Thermal Expansion and their Importance.pptxCoefficient of Thermal Expansion and their Importance.pptx
Coefficient of Thermal Expansion and their Importance.pptx
 
Introduction to IEEE STANDARDS and its different types.pptx
Introduction to IEEE STANDARDS and its different types.pptxIntroduction to IEEE STANDARDS and its different types.pptx
Introduction to IEEE STANDARDS and its different types.pptx
 
Decoding Kotlin - Your guide to solving the mysterious in Kotlin.pptx
Decoding Kotlin - Your guide to solving the mysterious in Kotlin.pptxDecoding Kotlin - Your guide to solving the mysterious in Kotlin.pptx
Decoding Kotlin - Your guide to solving the mysterious in Kotlin.pptx
 
UNIT-III FMM. DIMENSIONAL ANALYSIS
UNIT-III FMM.        DIMENSIONAL ANALYSISUNIT-III FMM.        DIMENSIONAL ANALYSIS
UNIT-III FMM. DIMENSIONAL ANALYSIS
 

Lifetime evaluation vs. measurement. part 4

  • 1. Lifetime Evaluation vs. Measurement. Part4 Quantitative HALT Give me a place to stand on, and I will move the Earth (Archimedes) Its known HALT is an effective way to find the weaknesses in your product during the reliability improvement program. In doing so, we view HALT as a qualitative test only. We cannot define the reliability and lifetime of the product from its results. So, unfortunately, we cannot use HALT for purposes of Type Certification, confirm the lifetime of Critical Parts, predict the warranty and maintenance costs, which are required, for example, for aviation. If we could combine the effectiveness of HALT (high acceleration of testing) with the benefits of quantitative testing, we would get a very powerful tool for the Reliability Demonstration and the Reliability Development of the new products. Let us consider in detail why the HALT has not become a quantitative test so far and whether it can become one. We can get quantitative characteristics of reliability and lifetime by two methods. This is a MEASUREMENT and EVALUATION (See Part 1). HALT failure data is clearly not enough for the MEASUREMENT of reliability and lifetime due to the small numbers of samples and failures. Therefore, we can get quantitative characteristics only by the EVALUATION method. And EVALUATION of reliability and lifetime is impossible due to a lack of mathematical foundation, besides expressions like 1-CL=Rn with its inherent disadvantages (See Part 2) and software tools, besides Reliasoft's Weibull++ DRT utility. This impasse is the reason that the HALT remains qualitative. The way out of this impasse is the creation of a new mathematical foundation by explicit consideration of uncertainty and its resolution by the worst-case method (Part 3). "Give me a place to stand on, and I will move the Earth" (Archimedes). THIS IS THE PLACE! We do not know something. Let us make evaluations and build the best control based on the worst-case scenario. There are simple formulas (Part 3). Unfortunately, this is where the simplicity ends: 1. We must consider all possible events (often dependent) during testing and operation of the product and calculate their probabilities. As Kozma Prutkov used to say, "You can't grasp the immensity!" 2. What is the indicator of the worst case? For some, it is a risk, for another it is safety. A more general indicator of the worst case can be the Life Cycle Cost of the product. This approach is implemented in the software tool Life Cycle Simulator, which calculates the quantitative characteristics of reliability and lifetime from HALT data. Even more interesting tasks that the Simulator solves are: - Finding the best-accelerated testing modes that will provide the smallest Life Cycle Cost for a given Time to Market. - Search and foundation for absolutely new test acceleration methods.
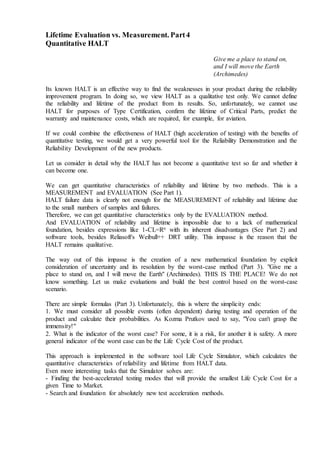
  • 2. We can make a simple example to demonstrate this approach. This example is so simple that we can do calculations in Excel. We are making a Reliability Improving Program of the product. The expected product launch program is 50 units. The warranty lifetime is 6000 hours. The warranty costs are $20 per failure. The product has one failure mode with a normal distribution of lifetime. The lifetime expectation is unknown, but it is in the range of 3000 - 13000 hours. The standard deviation is 900 hours. The Reliability Improvement Program of the Product includes the testing of one product. The cost of the product for testing is $15. The cost of the testing gas-hour is $0.01. If a product passes the test, it goes into production. The production cost of the basic version is $10 per product. If the product fails the test, we redesign the product. The cost of the redesign is $10. The production cost of the redesigned version is $12 per product. We suppose the modified product does not fail for warranty lifetime Applying this approach, we review the uncertainty of the lifetime expectation (from 3000 to 13000 hours). Let the duration of our test will be 6,000 hours for example. Then we will have probabilities of passing the test as shown in Line 1 of Table 1. The expectation of the Development cost (including the cost of the product to test, the cost of the test itself, and the cost of the redesign, if necessary) calculated for the discrete distribution is shown in Line 2 of Table 1. The expectation of the Manufacture cost (considering the production of basic or modified versions) calculated for the discrete distribution is shown in Line 3 of Table 1. The expectation of the Warranty cost calculated by Poisson distribution is shown in Line 4 of Table 1. The total cost of the product life cycle is shown in Line 5 of Table 1. Brief explanation: as the life of the product increases, the probability of passing the test increases from 0 to 1. The expectation of the development cost decreases from $85 to $75 due to the decrease in the probability of redesign. The expected manufacture cost is reduced from $600 to $500 due to the reduced probability of producing a more expensive redesigned version. The expected warranty cost first rises from 0 to $250 and then decreases to 0. This is due to the fact that a bad product will be identified in testing and redesigned, and warranty costs will be minimal. A good product will have minimal warranty costs too. The middle of uncertainty is the worst! The life cycle cost of the product is a maximum of $880 with an expected lifetime of 6000 hours. We solved the problem of uncertainty by looking for the worst case. Now we can find the best control (test time) at which the life cycle cost is minimal (See Table 2). This is $710 with a test time of 8000 hours. We can also find the best control (the number of samples for testing) at which the life cycle cost is minimal. In this case, an increase in the number of tested samples from 1 to 2 and 3 increases the expected life cycle cost from 710 to 787 and 859, which are not beneficial. If we don't test, the expected life cycle cost will be $ 1500. The calculation on the Life Cycle Simulator gives us similar results (Fig. 1) The Life Cycle Simulator is a very complex tool that considers simultaneously up to 12 failure modes with different lifetime distributions (Weibull, lognormal, exponential, etc.) and up to 5 redesign options. The function of the goal can be not only the life cycle cost expectation, but also cost with a given confidence level (for example CL=0,9 or 0,95). We can search for the best
  • 3. acceleration test modes and found completely new accelerated test methods to meet the Time to Market. There is a video of how the Life Cycle Simulator works on YouTube (https://www.youtube.com/watch?v=0_RtgmAzATg&t=68s).
  • 4. Table 1 Lifetime expectation, hours 3000 4000 5000 6000 7000 8000 9000 10000 11000 12000 13000 Prob. Of Pass 0,00043 0,01313 0,13326 0,50000 0,86674 0,98687 0,99957 1,00000 1,00000 1,00000 1,00000 Development cost 85,00 84,87 83,67 80,00 76,33 75,13 75,00 75,00 75,00 75,00 75,00 Manufacture cost 599,96 598,69 586,67 550,00 513,33 501,31 500,04 500,00 500,00 500,00 500 Warranty cost 0,43 12,96 115,50 250,00 115,50 12,96 0,43 0,00 0,00 0,00 0,0000 Life Cycle cost 685,38 696,52 785,84 880,00 705,16 589,41 575,48 575,00 575,00 575,00 575,00 Table 2 Testing time Max LCS 5000 1053,37 5500 957,19 6000 880,00 6500 802,81 7000 746,97 7500 718,64 8000 710,12 8500 711,11 9000 715,31 9500 720,06 10000 725,01