Call Girls In Sikandarpur Gurgaon ❤️8860477959_Russian 100% Genuine Escorts I...
Ok state 11 page average august 2012
1. August 2012
Area Delimited by Entire OK State MLS -
Single-Family Property Type
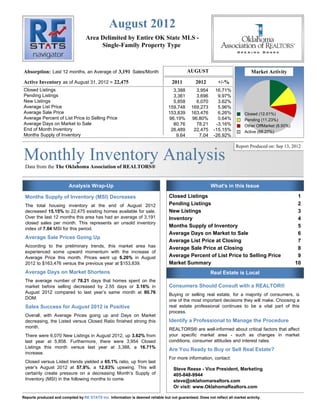
Absorption: Last 12 months, an Average of 3,191 Sales/Month AUGUST Market Activity
Active Inventory as of August 31, 2012 = 22,475 2011 2012 +/-%
Closed Listings 3,388 3,954 16.71%
Pending Listings 3,361 3,696 9.97%
New Listings 5,858 6,070 3.62%
Average List Price 159,748 169,273 5.96%
Average Sale Price 153,839 163,476 6.26% Closed (12.01%)
Average Percent of List Price to Selling Price 96.19% 96.80% 0.64% Pending (11.23%)
Average Days on Market to Sale 80.76 78.21 -3.16% Other OffMarket (8.50%)
End of Month Inventory 26,489 22,475 -15.15% Active (68.27%)
Months Supply of Inventory 9.64 7.04 -26.92%
Report Produced on: Sep 13, 2012
Monthly Inventory Analysis
Data from the The Oklahoma Association of REALTORS®
Analysis Wrap-Up What's in this Issue
Months Supply of Inventory (MSI) Decreases Closed Listings 1
The total housing inventory at the end of August 2012 Pending Listings 2
decreased 15.15% to 22,475 existing homes available for sale. New Listings 3
Over the last 12 months this area has had an average of 3,191 Inventory 4
closed sales per month. This represents an unsold inventory
Months Supply of Inventory 5
index of 7.04 MSI for this period.
Average Days on Market to Sale 6
Average Sale Prices Going Up
Average List Price at Closing 7
According to the preliminary trends, this market area has Average Sale Price at Closing 8
experienced some upward momentum with the increase of
Average Price this month. Prices went up 6.26% in August Average Percent of List Price to Selling Price 9
2012 to $163,476 versus the previous year at $153,839. Market Summary 10
Average Days on Market Shortens Real Estate is Local
The average number of 78.21 days that homes spent on the
market before selling decreased by 2.55 days or 3.16% in Consumers Should Consult with a REALTOR®
August 2012 compared to last year’s same month at 80.76 Buying or selling real estate, for a majority of consumers, is
DOM. one of the most important decisions they will make. Choosing a
Sales Success for August 2012 is Positive real estate professional continues to be a vital part of this
process.
Overall, with Average Prices going up and Days on Market
decreasing, the Listed versus Closed Ratio finished strong this Identify a Professional to Manage the Procedure
month. REALTORS® are well-informed about critical factors that affect
There were 6,070 New Listings in August 2012, up 3.62% from your specific market area - such as changes in market
last year at 5,858. Furthermore, there were 3,954 Closed conditions, consumer attitudes and interest rates.
Listings this month versus last year at 3,388, a 16.71%
Are You Ready to Buy or Sell Real Estate?
increase.
For more information, contact:
Closed versus Listed trends yielded a 65.1% ratio, up from last
year’s August 2012 at 57.8%, a 12.63% upswing. This will Steve Reese - Vice President, Marketing
certainly create pressure on a decreasing Month’s Supply of 405-848-9944
Inventory (MSI) in the following months to come. steve@oklahomarealtors.com
Or visit: www.OklahomaRealtors.com
Reports produced and compiled by RE STATS Inc. Information is deemed reliable but not guaranteed. Does not reflect all market activity.
2. Monthly Inventory Analysis
Data from the The Oklahoma Association of
REALTORS®
August 2012
Closed Sales as of Sep 12, 2012
Closed Listings Report Produced on: Sep 13, 2012
Area Delimited by Entire OK State MLS - Single-Family Property Type
AUGUST YEAR TO DATE (YTD)
2008 2009 2010 2011 2012 2008 2009 2010 2011 2012
3,944 3,954 27,573 26,967
3,355 3,388 24,537
2,857 23,827 23,257
1 Year 1 Year
+16.71% +15.95%
2 Year 2 Year
+38.40% +13.18%
5 YEAR MARKET ACTIVITY TRENDS 5yr AUG AVG = 3,500 3 MONTHS
5,000 High J 3,775
Jul 2008 = 4,041 U
4,000
Low N
3,000 Jan 2010 = 1,691 J 3,813
U
Closed Listings
2,000 Closed Listings
this L 1.01%
1,000 month at 3,954,
above the 5 yr AUG A 3,954
U
0
Jun 2008 Dec 2008 Jun 2009 Dec 2009 Jun 2010 Dec 2010 Jun 2011 Dec 2011 Jun 2012 average of 3,500 G 3.70%
CLOSED LISTINGS & BEDROOMS DISTRIBUTION BY PRICE
Distribution of Closed Listings by Price Range % AVDOM 2 Beds 3 Beds 4 Beds 5 Beds+
$25,000
and less 135 3.41% 70.5 79 48 7 1
$25,001
$75,000 634 16.03% 83.1 230 352 42 10
$75,001
$100,000 413 10.45% 72.2 89 282 40 2
$100,001
Contact an experienced REALTOR
Ready to Buy or Sell Real Estate?
$150,000 1,022 25.85% 73.5 159 734 124 5
$150,001
$200,000 743 18.79% 80.2 99 423 214 7
$200,001
$275,000 542 13.71% 75.7 61 201 255 25
$275,001
and up 465 11.76% 89.2 39 108 253 65
Total Closed Units: 3,954 78.2 756 2148 935 115
Total Closed Volume: 646,383,708 86.20M 296.47M 219.22M 44.50M
Average Closed Price: $163,476 $114,024 $138,020 $234,456 $386,942
Reports produced and compiled by RE STATS Inc. Information is deemed reliable but not guaranteed. Does not reflect all market activity. pp. 1
Steve Reese 405-848-9944 steve@oklahomarealtors.com
3. Monthly Inventory Analysis
Data from the The Oklahoma Association of
REALTORS®
August 2012
Pending Listings as of Sep 12, 2012
Pending Listings Report Produced on: Sep 13, 2012
Area Delimited by Entire OK State MLS - Single-Family Property Type
AUGUST YEAR TO DATE (YTD)
2008 2009 2010 2011 2012 2008 2009 2010 2011 2012
3,647 3,696 28,636 29,259
3,478 3,361 26,663
2,796 24,720 24,764
1 Year 1 Year
+9.97% +18.15%
2 Year 2 Year
+32.19% +18.36%
5 YEAR MARKET ACTIVITY TRENDS 5yr AUG AVG = 3,396 3 MONTHS
5,000 High J 3,655
Apr 2010 = 4,805 U
4,000
Low N
3,000 Dec 2009 = 2,007 J 3,976
U
Pending Listings
2,000 Pending Listingsthis L 8.78%
1,000 month at 3,696,
above the 5 yr AUG A 3,696
U
0
Jun 2008 Dec 2008 Jun 2009 Dec 2009 Jun 2010 Dec 2010 Jun 2011 Dec 2011 Jun 2012 average of 3,396 G -7.04%
PENDING LISTINGS & BEDROOMS DISTRIBUTION BY PRICE
Distribution of Pending Listings by Price Range % AVDOM 2 Beds 3 Beds 4 Beds 5 Beds+
$25,000
and less 131 3.54% 66.2 64 53 13 1
$25,001
$75,000 615 16.64% 69.8 222 339 51 3
$75,001
$100,000 410 11.09% 78.5 93 272 44 1
$100,001
Contact an experienced REALTOR
Ready to Buy or Sell Real Estate?
$150,000 963 26.06% 74.2 163 659 130 11
$150,001
$200,000 667 18.05% 79.1 89 390 178 10
$200,001
$275,000 466 12.61% 74.2 53 179 221 13
$275,001
and up 444 12.01% 86.8 43 104 237 60
Total Pending Units: 3,696 83.9 727 1996 874 99
Total Pending Volume: 608,856,684 84.93M 278.10M 207.18M 38.64M
Average Listing Price: $164,375 $116,825 $139,328 $237,053 $390,324
Reports produced and compiled by RE STATS Inc. Information is deemed reliable but not guaranteed. Does not reflect all market activity. pp. 2
Steve Reese 405-848-9944 steve@oklahomarealtors.com
4. Monthly Inventory Analysis
Data from the The Oklahoma Association of
REALTORS®
August 2012
New Listings as of Sep 12, 2012
New Listings Report Produced on: Sep 13, 2012
Area Delimited by Entire OK State MLS - Single-Family Property Type
AUGUST YEAR TO DATE (YTD)
2008 2009 2010 2011 2012 2008 2009 2010 2011 2012
6,070 50,058 49,793
5,922 5,858 48,214 48,129
5,819
5,641 45,223
1 Year 1 Year
+3.62% +3.46%
2 Year 2 Year
+2.50% +3.27%
5 YEAR MARKET ACTIVITY TRENDS 5yr AUG AVG = 5,862 3 MONTHS
8,000 High J 6,016
7,000 Apr 2010 = 7,586 U
6,000 Low N
5,000 Dec 2008 = 3,500 J 6,266
4,000 U
New Listings
3,000 New Listings this L 4.16%
2,000 month at 6,070,
1,000 above the 5 yr AUG A 6,070
U
0
Jun 2008 Dec 2008 Jun 2009 Dec 2009 Jun 2010 Dec 2010 Jun 2011 Dec 2011 Jun 2012 average of 5,862 G -3.13%
NEW LISTINGS & BEDROOMS DISTRIBUTION BY PRICE
Distribution of New Listings by Price Range % 2 Beds 3 Beds 4 Beds 5 Beds+
$50,000
and less 564 9.29% 270 254 32 8
$50,001
$75,000 571 9.41% 200 320 45 6
$75,001
$100,000 726 11.96% 207 450 66 3
$100,001
Contact an experienced REALTOR
Ready to Buy or Sell Real Estate?
$150,000 1,449 23.87% 232 1,041 167 9
$150,001
$225,000 1,393 22.95% 188 795 381 29
$225,001
$325,000 762 12.55% 92 267 362 41
$325,001
and up 605 9.97% 44 141 291 129
Total New Listed Units: 6,070 1233 3268 1344 225
Total New Listed Volume: 1,127,049,190 153.86M 486.90M 363.50M 122.79M
Average New Listed Listing Price: $207,242 $124,784 $148,989 $270,461 $545,753
Reports produced and compiled by RE STATS Inc. Information is deemed reliable but not guaranteed. Does not reflect all market activity. pp. 3
Steve Reese 405-848-9944 steve@oklahomarealtors.com
5. Monthly Inventory Analysis
Data from the The Oklahoma Association of
REALTORS®
August 2012
Active Inventory as of Sep 12, 2012
Active Inventory Report Produced on: Sep 13, 2012
Area Delimited by Entire OK State MLS - Single-Family Property Type
END OF AUGUST ACTIVE DURING AUGUST
2008 2009 2010 2011 2012 2008 2009 2010 2011 2012
25,372 26,485 32,435
23,630 29,829 30,503
22,475 28,967
21,408 27,376
1 Year 1 Year
-15.14% -10.69%
2 Year 2 Year
-11.42% -5.04%
5 YEAR MARKET ACTIVITY TRENDS 5yr AUG AVG = 23,874 3 MONTHS
Active Inventory
30,000 High J 23,274
Jul 2011 = 26,604 U
Low N
20,000
Jan 2008 = 19,325 J 22,901
U
10,000
Inventory this L -1.60%
month at 22,475,
below the 5 yr AUG A 22,475
U
0
Jun 2008 Dec 2008Jun 2009 Dec 2009Jun 2010 Dec 2010Jun 2011 Dec 2011Jun 2012 average of 23,874 G -1.86%
INVENTORY & BEDROOMS DISTRIBUTION BY PRICE
Distribution of Inventory by Price Range % AVDOM 2 Beds 3 Beds 4 Beds 5 Beds+
$50,000
and less 1,830 8.14% 121.4 928 787 96 19
$50,001
$75,000 2,268 10.09% 120.6 831 1,248 165 24
$75,001
$100,000 2,705 12.04% 108.4 706 1,717 259 23
$100,001
Contact an experienced REALTOR
Ready to Buy or Sell Real Estate?
$175,000 7,179 31.94% 98.1 1,284 4,652 1,159 84
$175,001
$225,000 2,818 12.54% 98.5 463 1,349 923 83
$225,001
$350,000 3,288 14.63% 106.1 443 1,152 1,455 238
$350,001
and up 2,387 10.62% 120.5 229 506 1,127 525
Total Active Inventory by Units: 22,475 107.1 4,884 11,411 5,184 996
Total Active Inventory by Volume: 4,510,718,386 668.59M 1.78B 1.49B 571.88M
Average Active Inventory Listing Price: $200,699 $136,893 $156,125 $287,173 $574,175
Reports produced and compiled by RE STATS Inc. Information is deemed reliable but not guaranteed. Does not reflect all market activity. pp. 4
Steve Reese 405-848-9944 steve@oklahomarealtors.com
6. Monthly Inventory Analysis
Data from the The Oklahoma Association of
REALTORS®
August 2012
Active Inventory as of Sep 12, 2012
Months Supply of Inventory Report Produced on: Sep 13, 2012
Area Delimited by Entire OK State MLS - Single-Family Property Type
MSI FOR AUGUST INDICATORS FOR AUGUST 2012
2008 2009 2010 2011 2012 Inventory Closed Absorption MSI MSI %
9.6 38,297
8.3 7.0 14.200%
22,475
7.0 7.1 7.0
1 Year 3,191
End of Closed Average Months Percent
-26.91% Month Last Closed per Supply Months
2 Year Active 12 Month over of Supply of
-15.11% Inventory Months 12 Months Inventory Inventory
5 YEAR MARKET ACTIVITY TRENDS 5yr AUG AVG = 7.8 3 MONTHS
10 High J 7.5
9 Jun 2011 = 9.9 U
8
Low N
7
6 Jan 2008 = 5.3 J 7.3
5 U
Months Supply
4 Months Supply this L -2.92%
3
2 month at 7.0,
1 below the 5 yr AUG A 7.0
U
0
Jun 2008 Dec 2008 Jun 2009 Dec 2009 Jun 2010 Dec 2010 Jun 2011 Dec 2011 Jun 2012 average of 7.8 G -3.31%
MONTHS SUPPLY & BEDROOMS DISTRIBUTION BY PRICE
Distribution of Active Inventory by Price Range and MSI % MSI 2 Beds 3 Beds 4 Beds 5 Beds+
$50,000
and less 1,830 8.14% 4.1 5.2 3.4 3.1 4.7
$50,001
$80,000 2,868 12.76% 7.2 9.0 6.5 6.9 9.7
$80,001
$110,000 2,874 12.79% 6.7 7.7 6.3 6.8 6.9
$110,001
Contact an experienced REALTOR
Ready to Buy or Sell Real Estate?
$170,000 6,072 27.02% 6.4 7.2 6.2 6.3 6.6
$170,001
$240,000 3,755 16.71% 7.4 9.6 7.5 6.4 9.5
$240,001
$360,000 2,792 12.42% 9.1 12.6 10.0 7.8 10.4
$360,001
and up 2,284 10.16% 15.1 24.6 16.0 13.0 17.0
MSI: 7.0 7.8 6.4 7.4 11.6
Total Active Inventory: 22,475 4,884 11,411 5,184 996
Reports produced and compiled by RE STATS Inc. Information is deemed reliable but not guaranteed. Does not reflect all market activity. pp. 5
Steve Reese 405-848-9944 steve@oklahomarealtors.com
7. Monthly Inventory Analysis
Data from the The Oklahoma Association of
REALTORS®
August 2012
Closed Sales as of Sep 12, 2012
Average Days on Market to Sale Report Produced on: Sep 13, 2012
Area Delimited by Entire OK State MLS - Single-Family Property Type
AUGUST YEAR TO DATE (YTD)
2008 2009 2010 2011 2012 2008 2009 2010 2011 2012
80 80 81 88
78 83 83 83
75 78
1 Year 1 Year
-3.16% -5.51%
2 Year 2 Year
-1.76% +6.59%
5 YEAR MARKET ACTIVITY TRENDS 5yr AUG AVG = 79 3 MONTHS
Average Days on Market
100 High J 78
90 Mar 2011 = 97 U
80
Low N
70
60 May 2010 = 73 J 78
50 U
40 Average DOM this L 0.42%
30
20 month at 78,
10 below the 5 yr AUG A 78
U
0
Jun 2008 Dec 2008 Jun 2009 Dec 2009 Jun 2010 Dec 2010 Jun 2011 Dec 2011 Jun 2012 average of 79 G 0.48%
AVERAGE DOM OF CLOSED SALES & BEDROOMS DISTRIBUTION BY PRICE
Distribution of Average Days on Market to Sale by Price Range % AVDOM 2 Beds 3 Beds 4 Beds 5 Beds+
$25,000
and less 135 3.41% 70.5 66.7 68.1 133.7 44.0
$25,001
$75,000 634 16.03% 83.1 95.8 71.1 104.4 124.3
$75,001
$100,000 413 10.45% 72.2 78.6 69.5 78.0 49.0
$100,001
Contact an experienced REALTOR
Ready to Buy or Sell Real Estate?
$150,000 1,022 25.85% 73.5 84.7 71.2 73.9 40.0
$150,001
$200,000 743 18.79% 80.2 95.0 74.0 85.9 67.6
$200,001
$275,000 542 13.71% 75.7 89.8 66.9 78.3 85.0
$275,001
and up 465 11.76% 89.2 135.7 74.6 92.2 73.8
Average Closed DOM: 78.2 89.9 71.2 84.8 78.1
Total Closed Units: 3,954 756 2148 935 115
Total Closed Volume: 646,383,708 86.20M 296.47M 219.22M 44.50M
Reports produced and compiled by RE STATS Inc. Information is deemed reliable but not guaranteed. Does not reflect all market activity. pp. 6
Steve Reese 405-848-9944 steve@oklahomarealtors.com
8. Monthly Inventory Analysis
Data from the The Oklahoma Association of
REALTORS®
August 2012
Closed Sales as of Sep 12, 2012
Average List Price at Closing Report Produced on: Sep 13, 2012
Area Delimited by Entire OK State MLS - Single-Family Property Type
AUGUST YEAR TO DATE (YTD)
2008 2009 2010 2011 2012 2008 2009 2010 2011 2012
169,273 160,428
160,252 159,748 154,113 155,946
153,846 156,564 149,792 151,615
1 Year 1 Year
+5.96% +2.87%
2 Year 2 Year
+8.12% +5.81%
5 YEAR MARKET ACTIVITY TRENDS 5yr AUG AVG = 160K 3 MONTHS
Average List Price
200,000 High J 166,873
Aug 2012 = 169,273 U
Low N
Nov 2008 = 135,800 J 165,159
100,000 U
Average LPrice this L -1.03%
month at 169,273,
above the 5 yr AUG A 169,273
U
0
Jun 2008 Dec 2008Jun 2009 Dec 2009Jun 2010 Dec 2010Jun 2011 Dec 2011Jun 2012 average of 159,937 G 2.49%
AVERAGE LIST PRICE OF CLOSED SALES & BEDROOMS DISTRIBUTION BY PRICE
Distribution of Average List Price at Closing by Price Range % AVL$ 2 Beds 3 Beds 4 Beds 5 Beds+
$25,000
and less 125 3.16% 18,787 19,332 21,423 24,629 24,900
$25,001
$75,000 606 15.33% 53,845 54,640 56,554 63,346 65,420
$75,001
$100,000 402 10.17% 89,311 91,558 92,216 92,725 93,250
$100,001
Contact an experienced REALTOR
Ready to Buy or Sell Real Estate?
$150,000 1,017 25.72% 127,451 129,923 128,977 135,533 141,660
$150,001
$200,000 778 19.68% 173,900 176,462 173,967 179,367 191,371
$200,001
$275,000 508 12.85% 237,245 244,128 239,120 244,519 244,008
$275,001
and up 518 13.10% 411,181 382,043 391,588 406,981 577,342
Average List Price: $169,273 $119,262 $142,249 $242,836 $404,704
Total Closed Units: 3,954 756 2148 935 115
Total List Volume: 669,306,156 90.16M 305.55M 227.05M 46.54M
Reports produced and compiled by RE STATS Inc. Information is deemed reliable but not guaranteed. Does not reflect all market activity. pp. 7
Steve Reese 405-848-9944 steve@oklahomarealtors.com
9. Monthly Inventory Analysis
Data from the The Oklahoma Association of
REALTORS®
August 2012
Closed Sales as of Sep 12, 2012
Average Sold Price at Closing Report Produced on: Sep 13, 2012
Area Delimited by Entire OK State MLS - Single-Family Property Type
AUGUST YEAR TO DATE (YTD)
2008 2009 2010 2011 2012 2008 2009 2010 2011 2012
163,476 154,774
155,369 153,839 149,443 149,848
148,290 150,604 144,430 146,220
1 Year 1 Year
+6.26% +3.29%
2 Year 2 Year
+8.55% +5.85%
5 YEAR MARKET ACTIVITY TRENDS 5yr AUG AVG = 154K 3 MONTHS
Average Sold Price
200,000 High J 161,349
Aug 2012 = 163,476 U
Low N
Nov 2008 = 131,059 J 159,286
100,000 U
Average SPrice this L -1.28%
month at 163,476,
above the 5 yr AUG A 163,476
U
0
Jun 2008 Dec 2008Jun 2009 Dec 2009Jun 2010 Dec 2010Jun 2011 Dec 2011Jun 2012 average of 154,316 G 2.63%
AVERAGE SOLD PRICE OF CLOSED SALES & BEDROOMS DISTRIBUTION BY PRICE
Distribution of Average Sold Price at Closing by Price Range % AVS$ 2 Beds 3 Beds 4 Beds 5 Beds+
$25,000
and less 135 3.41% 17,654 17,365 18,290 16,301 19,400
$25,001
$75,000 634 16.03% 52,486 50,523 53,289 55,735 55,750
$75,001
$100,000 413 10.45% 88,312 88,267 88,361 87,981 90,000
$100,001
Contact an experienced REALTOR
Ready to Buy or Sell Real Estate?
$150,000 1,022 25.85% 126,406 125,128 125,837 131,479 124,843
$150,001
$200,000 743 18.79% 172,506 171,777 170,653 176,234 180,786
$200,001
$275,000 542 13.71% 235,891 233,717 232,933 237,957 243,900
$275,001
and up 465 11.76% 406,537 364,005 375,404 389,509 550,065
Average Closed Price: $163,476 $114,024 $138,020 $234,456 $386,942
Total Closed Units: 3,954 756 2148 935 115
Total Closed Volume: 646,383,708 86.20M 296.47M 219.22M 44.50M
Reports produced and compiled by RE STATS Inc. Information is deemed reliable but not guaranteed. Does not reflect all market activity. pp. 8
Steve Reese 405-848-9944 steve@oklahomarealtors.com
10. Monthly Inventory Analysis
Data from the The Oklahoma Association of
REALTORS®
August 2012
Closed Sales as of Sep 12, 2012
Average Percent of List Price to Selling Price Report Produced on: Sep 13, 2012
Area Delimited by Entire OK State MLS - Single-Family Property Type
AUGUST YEAR TO DATE (YTD)
2008 2009 2010 2011 2012 2008 2009 2010 2011 2012
96.82% 96.87% 96.80% 96.84%
96.19% 96.28% 96.34% 96.41%
95.62% 95.91%
1 Year 1 Year
+0.64% +0.53%
2 Year 2 Year
+1.23% +0.07%
5 YEAR MARKET ACTIVITY TRENDS 5yr AUG AVG=96.46% 3 MONTHS
Average List/Sell Price
98 High J 96.94%
May 2008 = 97.13% U
Low N
97
Jan 2011 = 95.15% J 96.78%
U
96
Average List/Sell this L -0.17%
month at 96.80%,
above the 5 yr AUG A 96.80%
U
95
Jun 2008 Dec 2008 Jun 2009 Dec 2009 Jun 2010 Dec 2010 Jun 2011 Dec 2011 Jun 2012 average of 96.46% G 0.03%
AVERAGE L/S% OF CLOSED SALES & BEDROOMS DISTRIBUTION BY PRICE
Distribution of $avgmed L/S % by Price Range % AVL/S% 2 Beds 3 Beds 4 Beds 5 Beds+
$25,000
and less 135 3.41% 89.18% 92.16% 87.40% 69.37% 77.91%
$25,001
$75,000 634 16.03% 94.00% 93.18% 95.10% 91.22% 85.81%
$75,001
$100,000 413 10.45% 96.83% 96.99% 97.00% 95.29% 97.31%
$100,001
Contact an experienced REALTOR
Ready to Buy or Sell Real Estate?
$150,000 1,022 25.85% 97.45% 96.53% 97.74% 97.23% 88.44%
$150,001
$200,000 743 18.79% 98.70% 97.45% 98.18%100.42% 94.83%
$200,001
$275,000 542 13.71% 98.52% 96.07% 98.96% 97.50%111.47%
$275,001
and up 465 11.76% 96.35% 95.56% 96.30% 96.55% 96.11%
Average List/Sell Ratio: 96.80% 95.14% 97.11% 97.29% 98.00%
Total Closed Units: 3,954 756 2148 935 115
Total Closed Volume: 646,383,708 86.20M 296.47M 219.22M 44.50M
Reports produced and compiled by RE STATS Inc. Information is deemed reliable but not guaranteed. Does not reflect all market activity. pp. 9
Steve Reese 405-848-9944 steve@oklahomarealtors.com
11. Monthly Inventory Analysis
Data from the The Oklahoma Association of
REALTORS®
August 2012
Inventory as of Sep 12, 2012
Market Summary Report Produced on: Sep 13, 2012
Area Delimited by Entire OK State MLS - Single-Family Property Type
Inventory Inventory Market Activity Market Activity
New Listings Closed Sales
6,070 = 20.95% 3,954 = 12.01%
Start Inventory Pending Sales
22,902 3,696 = 11.23%
Total Inventory
Other Off Market
Units 2,797 = 8.50%
28,972
Volume Active Inventory
$5,650,115,001 22,475 = 68.27%
Absorption: Last 12 months, an Average of 3,191 Sales/Month AUGUST Year To Date
Active Inventory as of August 31, 2012 = 22,475 2011 2012 +/-% 2011 2012 +/-%
Closed Sales 3,388 3,954 16.71% 23,257 26,967 15.95%
Pending Sales 3,361 3,696 9.97% 24,764 29,259 18.15%
New Listings 5,858 6,070 3.62% 48,129 49,793 3.46%
Average List Price 159,748 169,273 5.96% 155,946 160,428 2.87%
Average Sale Price 153,839 163,476 6.26% 149,848 154,774 3.29%
Average Percent of List Price to Selling Price 96.19% 96.80% 0.64% 95.91% 96.41% 0.53%
Average Days on Market to Sale 80.76 78.21 -3.16% 88.04 83.19 -5.51%
Monthly Inventory 26,489 22,475 -15.15% 26,489 22,475 -15.15%
Months Supply of Inventory 9.64 7.04 -26.92% 9.64 7.04 -26.92%
2011 2011
AUGUST MARKET 2012 AVERAGE PRICES 2012
New Listings Pending Listings List Price Sale Price
5,858 6,070 169,273
163,476
159,748
3,361 3,696 153,839
+3.62% +9.97% +5.96% +6.26%
2011 2011
INVENTORY 2012 AVERAGE L/S% & DOM 2012
Active Inventory Monthly Supply of Inventory % of List to Sale Price Days on Market to Sale
26,489 9.64 96.80% 80.76
22,475 7.04 96.19% 78.21
-15.15% -26.92% +0.64% -3.16%
Reports produced and compiled by RE STATS Inc. Information is deemed reliable but not guaranteed. Does not reflect all market activity. pp. 10
Steve Reese 405-848-9944 steve@oklahomarealtors.com