Tight Market Pushes Average Price Above $500K
•
0 likes•303 views

Here is the February 2012 Housing Market Watch. Lots of great information inside...have a look...

Recommended
More Related Content
What's hot
What's hot (11)
Viewers also liked
Viewers also liked (16)
Similar to Tight Market Pushes Average Price Above $500K
Similar to Tight Market Pushes Average Price Above $500K (19)
More from Richard Silver, Certified International REALTOR®
More from Richard Silver, Certified International REALTOR® (20)
Recently uploaded
Recently uploaded (20)
Tight Market Pushes Average Price Above $500K
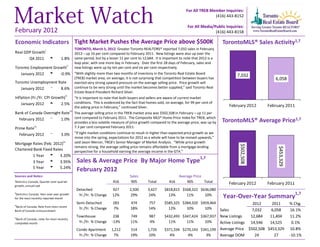
- 1. For All TREB Member Inquiries: (416) 443-8152 For All Media/Public Inquiries: February 2012 (416) 443-8158 Economic Indicators Tight Market Pushes the Average Price above $500K TorontoMLS® Sales Activity1,7 TORONTO, March 5, 2012 Greater Toronto REALTORS® reported 7,032 sales in February Real GDP Growthi 2012 – up 16 per cent compared to February 2011. New listings were also up over the Q4 2011 t 1.8% same period, but by a lesser 11 per cent to 12,684. It is important to note that 2012 is a leap year, with one more day in February. Over the first 28 days of February, sales and Toronto Employment Growthi i new listings were up by ten per cent and six per cent respectively. January 2012 u -0.9% “With slightly more than two months of inventory in the Toronto Real Estate Board 7,032 (TREB) market area, on average, it is not surprising that competition between buyers has 6,058 Toronto Unemployment Rate exerted very strong upward pressure on the average selling price. Price growth will January 2012 q 8.6% continue to be very strong until the market becomes better supplied,” said Toronto Real Estate Board President Richard Silver. ii Inflation (Yr./Yr. CPI Growth) “It is important to note that both buyers and sellers are aware of current market January 2012 t 2.5% conditions. This is evidenced by the fact that homes sold, on average, for 99 per cent of the asking price in February,” continued Silver. February 2012 February 2011 iii Bank of Canada Overnight Rate The average selling price in the TREB market area was $502,508 in February – up 11 per February 2012 q cent compared to February 2011. The Composite MLS® Home Price Index for TREB, which 1.0% provides a less volatile measure of price growth compared to the average price, was up by TorontoMLS® Average Price1,7 iv 7.3 per cent compared February 2011. Prime Rate February 2012 q 3.0% “If tight market conditions continue to result in higher than expected price growth as we move into the spring, expectations for 2012 as a whole will have to be revised upwards,” Mortgage Rates (Feb. 2012) iv said Jason Mercer, TREB’s Senior Manager of Market Analysis. “While price growth $502,508 remains strong, the average selling price remains affordable from a mortgage lending $453,329 Chartered Bank Fixed Rates perspective for a household earning the average income in the GTA.” 1 Year u 3.20% 1,7 3 Year u 3.95% Sales & Average Price By Major Home Type 5 Year u 5.24% February 2012 Sources and Notes: Sales Average Price i Statistics Canada, Quarter-over-quarter 416 905 Total 416 905 Total February 2012 February 2011 growth, annualized Detached 927 2,500 3,427 $818,815 $568,322 $636,080 ii Statistics Canada, Year-over-year growth 1,7 for the most recently reported month Yr./Yr. % Change 12% 29% 24% 13% 11% 10% Year-Over-Year Summary Semi-Detached 283 474 757 $585,325 $384,320 $459,464 2012 2011 % Chg. iii Bank of Canada, Rate from most recent Yr./Yr. % Change 7% 18% 14% 12% 10% 10% Sales 7,032 6,058 16.1% Bank of Canada announcement iv Townhouse 238 749 987 $432,493 $347,424 $367,937 New Listings 12,684 11,404 11.2% Bank of Canada, rates for most recently completed month Yr./Yr. % Change -13% 11% 4% 11% 11% 10% Active Listings 14,546 14,525 0.1% Condo Apartment 1,212 514 1,726 $371,334 $270,143 $341,199 Average Price $502,508 $453,329 10.8% Yr./Yr. % Change 7% 19% 10% 4% 4% 3% Average DOM 24 27 -10.1%
- 2. Toronto Real Estate Board SALES BY PRICE RANGE AND HOUSE TYPE1,7 FEBRUARY 2012 Price Range Detached Semi-Detached Att/Row/Twnhouse Condo Townhouse Condo Apt Link Co-op Apt Det Condo Co-ownership Apt Total $0 to $99,999 7 0 0 2 33 0 0 0 1 43 $100,000 to $199,999 55 20 4 61 222 2 6 0 0 370 $200,000 to $299,999 269 57 110 163 551 26 0 0 5 1,181 $300,000 to $399,999 559 246 170 152 530 22 0 0 1 1,680 $400,000 to $499,999 649 254 146 50 216 37 2 0 1 1,355 $500,000 to $599,999 528 79 55 15 80 20 0 0 0 777 $600,000 to $699,999 413 36 22 6 41 8 0 0 0 526 $700,000 to $799,999 299 27 11 5 21 2 1 0 0 366 $800,000 to $899,999 181 13 4 4 4 0 0 0 0 206 $900,000 to $999,999 107 8 1 1 4 0 0 0 0 121 $1,000,000 to $1,249,999 146 7 0 2 9 0 0 1 0 165 $1,250,000 to $1,499,999 70 6 1 0 4 0 0 0 0 81 $1,500,000 to $1,749,999 47 3 2 0 6 0 0 0 0 58 $1,750,000 to $1,999,999 32 1 0 0 1 0 0 0 0 34 $2,000,000 + 65 0 0 0 4 0 0 0 0 69 Total Sales 3,427 757 526 461 1,726 117 9 1 8 7,032 Share of Total Sales 48.7% 10.8% 7.5% 6.6% 24.5% 1.7% 0.1% 0.0% 0.1% - Average Price $636,080 $459,464 $410,038 $319,901 $341,199 $412,668 $276,889 $1,013,500 $265,388 $502,508 SALES BY PRICE RANGE AND HOUSE TYPE1,7 YEAR-TO-DATE, 2012 Price Range Detached Semi-Detached Att/Row/Twnhouse Condo Townhouse Condo Apt Link Co-op Apt Det Condo Co-ownership Apt Total $0 to $99,999 7 0 1 3 52 0 0 0 2 65 $100,000 to $199,999 93 31 5 119 392 3 8 0 1 652 $200,000 to $299,999 487 101 191 286 921 43 3 0 7 2,039 $300,000 to $399,999 949 426 280 261 863 37 1 1 1 2,819 $400,000 to $499,999 1,081 422 244 89 337 58 2 0 1 2,234 $500,000 to $599,999 865 116 91 29 130 32 0 1 0 1,264 $600,000 to $699,999 631 50 39 9 61 11 0 1 0 802 $700,000 to $799,999 430 39 18 9 24 2 1 0 0 523 $800,000 to $899,999 277 24 6 5 14 0 0 0 0 326 $900,000 to $999,999 156 9 3 1 8 0 0 0 0 177 $1,000,000 to $1,249,999 210 9 2 2 18 0 0 1 0 242 $1,250,000 to $1,499,999 119 6 1 0 5 0 0 0 0 131 $1,500,000 to $1,749,999 74 3 4 0 7 0 0 0 0 88 $1,750,000 to $1,999,999 44 1 0 0 1 0 0 0 0 46 $2,000,000 + 91 1 0 0 4 0 0 0 0 96 Total Sales 5,514 1,238 885 813 2,837 186 15 4 12 11,504 Share of Total Sales 47.9% 10.8% 7.7% 7.1% 24.7% 1.6% 0.1% 0.0% 0.1% - Average Price $616,891 $446,134 $411,999 $313,532 $333,757 $407,915 $255,400 $639,625 $238,883 $487,254 Page 3 July 2010 Market Watch, February 2012 2
- 3. Toronto Real Estate Board ALL HOME TYPES, FEBRUARY 2012 SUMMARY OF EXISTING HOME TRANSACTIONS ALL TREB AREAS Number of Sales Dollar Volume1 Average Price1 Median Price1 New Listings2 SNLR (Trend) 8 Active Listings3 Mos. Inv. (Trend)9 Avg. SP/LP 4 Avg. DOM5 TREB Total 7,032 $3,533,635,052 $502,508 $416,150 12,684 60.7% 14,546 2.2 99% 24 Halton Region 470 $270,673,825 $575,902 $465,000 834 62.8% 921 2.3 98% 25 Burlington 63 $33,769,489 $536,024 $400,000 110 65.8% 127 2.3 96% 40 Halton Hills 88 $40,533,850 $460,612 $433,000 134 67.2% 160 2.5 98% 25 Milton 150 $68,437,706 $456,251 $440,000 226 64.9% 182 1.6 99% 14 Oakville 169 $127,932,780 $756,999 $610,000 364 58.8% 452 2.7 97% 28 Peel Region 1,486 $646,022,367 $434,739 $387,250 2,581 61.2% 2,755 2.0 98% 23 Brampton 641 $254,999,487 $397,815 $375,500 1,125 59.3% 1,106 1.9 98% 23 Caledon 59 $34,205,600 $579,756 $491,000 124 57.5% 209 3.6 97% 32 Mississauga 786 $356,817,280 $453,966 $394,000 1,332 63.0% 1,440 1.9 98% 22 City of Toronto 2,686 $1,486,751,884 $553,519 $424,944 5,165 59.2% 6,090 2.2 101% 22 ! TURN PAGE FOR CITY OF TORONTO TABLES OR CLICK HERE: York Region 1,346 $787,374,134 $584,973 $530,000 2,283 64.3% 2,333 1.9 99% 22 Aurora 74 $43,661,399 $590,019 $543,000 128 68.9% 136 1.9 98% 22 E. Gwillimbury 35 $17,453,890 $498,683 $431,000 39 61.4% 57 3.2 98% 35 Georgina 82 $26,221,864 $319,779 $303,750 114 60.6% 183 3.5 97% 35 King 26 $24,471,500 $941,212 $891,000 47 45.7% 118 6.9 95% 66 Markham 338 $196,610,847 $581,689 $536,250 643 63.7% 620 1.6 100% 20 Newmarket 119 $53,050,088 $445,799 $425,000 184 75.2% 144 1.3 99% 14 Richmond Hill 263 $177,701,357 $675,671 $582,000 424 65.2% 341 1.6 99% 18 Vaughan 351 $214,075,382 $609,901 $575,000 594 64.0% 575 1.9 99% 19 Whitchurch-Stouffville 58 $34,127,807 $588,410 $505,000 110 58.6% 159 3.0 98% 42 Durham Region 848 $275,860,079 $325,307 $300,000 1,419 59.4% 1,745 2.5 98% 29 Ajax 156 $55,289,886 $354,422 $340,000 251 60.5% 252 1.9 98% 23 Brock 13 $3,150,800 $242,369 $222,000 40 38.9% 120 9.1 95% 110 Clarington 143 $40,990,522 $286,647 $270,000 228 56.4% 290 2.8 98% 34 Oshawa 208 $52,270,816 $251,302 $239,450 331 59.9% 389 2.5 98% 29 Pickering 117 $44,653,476 $381,654 $369,900 176 63.0% 203 2.0 99% 24 Scugog 21 $9,510,250 $452,869 $335,000 51 51.3% 101 4.8 96% 56 Uxbridge 26 $10,923,500 $420,135 $375,250 52 54.1% 108 4.8 97% 55 Whitby 164 $59,070,829 $360,188 $340,000 290 63.0% 282 1.8 99% 20 Dufferin County 44 $13,713,200 $311,664 $302,250 79 62.8% 130 2.7 98% 36 Orangeville 44 $13,713,200 $311,664 $302,250 79 62.8% 130 2.7 98% 36 Simcoe County 152 $53,239,563 $350,260 $299,450 323 57.0% 572 4.2 97% 53 Adjala-Tosorontio 18 $7,739,200 $429,956 $417,500 31 49.3% 66 6.6 97% 97 Bradford West Gwillimbury 37 $15,222,700 $411,424 $334,000 69 70.7% 76 2.3 97% 30 Essa 14 $4,424,400 $316,029 $254,500 61 46.8% 116 5.6 99% 45 Innisfil 33 $10,716,900 $324,755 $271,000 85 49.8% 176 5.3 97% 66 New Tecumseth 50 $15,136,363 $302,727 $275,000 77 62.8% 138 3.8 97% 47 Page 3 July 2010 Market Watch, February 2012 3
- 4. Toronto Real Estate Board ALL HOME TYPES, FEBRUARY 2012 SUMMARY OF EXISTING HOME TRANSACTIONS CITY OF TORONTO MUNICIPAL BREAKDOWN 1 1 1 2 8 3 4 5 Number of Sales Dollar Volume Average Price Median Price New Listings SNLR (Trend) Active Listings Mos. Inv. (Trend)9 Avg. SP/LP Avg. DOM TREB Total 7,032 $3,533,635,052 $502,508 $416,150 12,684 60.7% 14,546 2.2 99% 24 City of Toronto Total 2,686 $1,486,751,884 $553,519 $424,944 5,165 59.2% 6,090 2.2 101% 22 Toronto West 667 $304,492,983 $456,511 $388,500 1,400 57.6% 1,710 2.5 100% 26 Toronto W01 30 $18,192,600 $606,420 $536,750 104 59.2% 118 2.1 102% 18 Toronto W02 61 $39,308,924 $644,409 $535,000 105 69.2% 86 1.2 105% 15 Toronto W03 74 $26,632,500 $359,899 $355,000 117 59.0% 108 2.1 100% 19 Toronto W04 56 $20,042,500 $357,902 $350,450 107 58.4% 160 2.8 99% 36 Toronto W05 79 $25,025,050 $316,773 $349,300 169 53.7% 238 3.3 99% 34 Toronto W06 95 $43,942,038 $462,548 $410,000 273 48.2% 359 3.2 100% 29 Toronto W07 27 $18,825,407 $697,237 $645,333 38 68.9% 29 1.4 101% 27 Toronto W08 117 $72,035,318 $615,686 $515,000 253 61.0% 326 2.2 100% 23 Toronto W09 50 $18,544,888 $370,898 $417,000 102 55.8% 108 3.0 100% 32 Toronto W10 78 $21,943,758 $281,330 $270,250 132 56.2% 178 3.0 98% 26 Toronto Central 1,277 $852,662,991 $667,708 $451,900 2,528 58.8% 3,061 2.2 101% 21 Toronto C01 347 $157,680,041 $454,409 $391,000 723 53.8% 986 2.6 100% 23 Toronto C02 51 $59,084,131 $1,158,512 $765,000 129 55.5% 214 2.8 102% 18 Toronto C03 49 $44,694,050 $912,123 $678,300 103 59.1% 98 2.2 100% 18 Toronto C04 85 $90,615,468 $1,066,064 $1,030,000 163 60.1% 162 1.9 102% 16 Toronto C06 27 $15,424,808 $571,289 $630,000 49 59.9% 64 2.1 102% 20 Toronto C07 99 $56,480,666 $570,512 $509,000 190 63.5% 187 1.8 101% 20 Toronto C08 128 $56,666,289 $442,705 $391,500 210 62.5% 262 2.0 100% 21 Toronto C09 21 $27,065,126 $1,288,816 $789,000 49 63.3% 68 2.1 98% 25 Toronto C10 58 $41,107,300 $708,747 $635,000 94 68.4% 85 1.5 104% 14 Toronto C11 40 $29,853,026 $746,326 $324,500 65 65.6% 69 1.8 102% 17 Toronto C12 47 $84,004,576 $1,787,331 $1,661,000 100 53.5% 130 3.3 98% 25 Toronto C13 55 $32,988,500 $599,791 $450,000 114 65.4% 117 1.8 101% 23 Toronto C14 149 $91,724,462 $615,600 $428,000 258 61.7% 263 1.7 102% 23 Toronto C15 121 $65,274,548 $539,459 $403,000 281 57.1% 356 2.0 101% 23 Toronto East 742 $329,595,910 $444,199 $410,000 1,237 61.4% 1,319 1.9 102% 19 Toronto E01 86 $48,992,038 $569,675 $559,233 124 61.6% 101 1.5 105% 11 Toronto E02 60 $40,247,135 $670,786 $606,000 108 65.1% 72 1.2 103% 12 Toronto E03 89 $50,907,072 $571,990 $512,000 147 62.8% 118 1.5 105% 13 Toronto E04 86 $29,841,336 $346,992 $359,500 141 61.4% 169 2.0 100% 19 Toronto E05 58 $22,594,610 $389,562 $339,000 97 72.4% 94 1.3 101% 20 Toronto E06 41 $23,051,541 $562,233 $408,000 79 59.0% 53 1.7 101% 13 Toronto E07 64 $22,589,854 $352,966 $309,000 106 58.9% 146 2.2 102% 33 Toronto E08 48 $16,879,875 $351,664 $322,250 82 57.6% 111 2.4 99% 22 Toronto E09 76 $24,615,450 $323,888 $335,000 146 57.2% 218 2.3 100% 26 Toronto E10 52 $24,430,299 $469,813 $417,000 85 60.1% 87 2.0 100% 19 Toronto E11 82 $25,446,700 $310,326 $314,700 122 58.9% 150 2.4 99% 25 Page 3 July 2010 Market Watch, February 2012 4
- 5. Toronto Real Estate Board ALL HOME TYPES, YEAR-TO-DATE 2012 SUMMARY OF EXISTING HOME TRANSACTIONS ALL TREB AREAS Number of Sales Dollar Volume1 Average Price1 Median Price1 New Listings2 Avg. SP/LP 4 Avg. DOM5 TREB Total 11,504 $5,605,365,733 $487,254 $407,000 22,295 99% 27 Halton Region 755 $409,925,575 $542,948 $453,000 1,413 98% 27 Burlington 96 $47,821,689 $498,143 $392,500 176 96% 39 Halton Hills 141 $62,588,450 $443,890 $395,000 229 98% 31 Milton 235 $105,212,556 $447,713 $427,000 391 99% 17 Oakville 283 $194,302,880 $686,583 $575,000 617 97% 28 Peel Region 2,517 $1,074,172,821 $426,767 $385,000 4,609 98% 26 Brampton 1,122 $440,355,301 $392,474 $370,750 1,995 98% 26 Caledon 91 $54,075,500 $594,236 $489,900 220 96% 37 Mississauga 1,304 $579,742,020 $444,587 $394,000 2,394 98% 26 City of Toronto 4,362 $2,324,385,156 $532,871 $414,450 9,186 100% 26 ! TURN PAGE FOR CITY OF TORONTO TABLES OR CLICK HERE: York Region 2,128 $1,230,588,043 $578,284 $515,000 3,828 99% 25 Aurora 109 $65,049,190 $596,782 $541,000 213 99% 23 E. Gwillimbury 44 $21,136,490 $480,375 $411,000 74 98% 37 Georgina 123 $37,056,864 $301,275 $292,500 224 97% 33 King 45 $39,613,800 $880,307 $850,000 81 94% 75 Markham 553 $313,185,484 $566,339 $517,000 1,052 99% 24 Newmarket 186 $81,554,588 $438,466 $424,000 307 99% 16 Richmond Hill 421 $279,544,676 $664,002 $566,000 685 98% 22 Vaughan 554 $339,162,406 $612,207 $565,000 1,009 99% 23 Whitchurch-Stouffville 93 $54,284,545 $583,705 $491,300 183 98% 41 Durham Region 1,413 $455,267,508 $322,199 $298,000 2,561 98% 32 Ajax 268 $95,740,291 $357,240 $346,000 450 98% 24 Brock 22 $5,423,200 $246,509 $236,950 68 95% 121 Clarington 225 $64,386,472 $286,162 $266,500 408 98% 37 Oshawa 359 $90,507,032 $252,109 $242,000 613 98% 32 Pickering 179 $68,686,176 $383,722 $367,000 332 98% 27 Scugog 38 $14,546,350 $382,799 $316,500 87 97% 52 Uxbridge 40 $16,920,350 $423,009 $401,750 94 97% 61 Whitby 282 $99,057,637 $351,268 $339,950 509 98% 26 Dufferin County 79 $24,276,000 $307,291 $302,000 161 98% 43 Orangeville 79 $24,276,000 $307,291 $302,000 161 98% 43 Simcoe County 250 $86,750,630 $347,003 $311,000 537 97% 52 Adjala-Tosorontio 24 $10,800,000 $450,000 $427,500 52 97% 90 Bradford West Gwillimbury 79 $30,584,125 $387,141 $346,000 110 97% 36 Essa 21 $6,441,390 $306,733 $263,000 90 99% 47 Innisfil 54 $17,152,299 $317,635 $285,000 149 97% 62 New Tecumseth 72 $21,772,816 $302,400 $276,950 136 97% 52 Page 3 July 2010 Market Watch, February 2012 5
- 6. Toronto Real Estate Board ALL HOME TYPES, YEAR-TO-DATE 2012 SUMMARY OF EXISTING HOME TRANSACTIONS CITY OF TORONTO MUNICIPAL BREAKDOWN 1 1 1 2 4 5 Number of Sales Dollar Volume Average Price Median Price New Listings Avg. SP/LP Avg. DOM TREB Total 11,504 $5,605,365,733 $487,254 $407,000 22,295 99% 27 City of Toronto Total 4,362 $2,324,385,156 $532,871 $414,450 9,186 100% 26 Toronto West 1,095 $476,194,377 $434,881 $380,000 2,424 100% 31 Toronto W01 47 $27,237,000 $579,511 $516,000 175 102% 20 Toronto W02 101 $58,073,735 $574,987 $515,000 172 104% 19 Toronto W03 115 $40,725,900 $354,138 $350,000 192 99% 29 Toronto W04 102 $33,753,088 $330,913 $299,250 205 98% 36 Toronto W05 131 $42,563,150 $324,910 $347,500 298 98% 36 Toronto W06 152 $67,245,332 $442,404 $390,000 463 100% 35 Toronto W07 42 $27,990,407 $666,438 $605,000 61 100% 27 Toronto W08 200 $114,262,698 $571,313 $485,000 445 99% 29 Toronto W09 78 $28,831,909 $369,640 $417,000 163 99% 35 Toronto W10 127 $35,511,158 $279,615 $275,000 250 98% 32 Toronto Central 2,038 $1,322,424,738 $648,884 $448,700 4,527 100% 25 Toronto C01 536 $240,227,655 $448,186 $388,950 1,376 99% 26 Toronto C02 87 $93,333,131 $1,072,795 $770,000 238 101% 27 Toronto C03 75 $66,678,450 $889,046 $629,000 160 101% 22 Toronto C04 147 $149,079,131 $1,014,144 $950,000 266 102% 19 Toronto C06 48 $27,623,298 $575,485 $614,750 93 101% 22 Toronto C07 165 $96,771,065 $586,491 $467,000 325 99% 25 Toronto C08 203 $88,170,675 $434,338 $390,000 415 99% 27 Toronto C09 35 $40,741,126 $1,164,032 $901,000 94 97% 33 Toronto C10 88 $60,965,151 $692,786 $579,000 172 103% 15 Toronto C11 68 $42,693,926 $627,852 $283,000 115 101% 21 Toronto C12 64 $112,233,076 $1,753,642 $1,584,000 155 98% 30 Toronto C13 98 $59,973,438 $611,974 $436,000 192 101% 21 Toronto C14 233 $138,771,242 $595,585 $435,000 440 101% 27 Toronto C15 191 $105,163,374 $550,594 $405,000 486 101% 25 Toronto East 1,229 $525,766,041 $427,800 $399,000 2,235 101% 23 Toronto E01 128 $70,405,637 $550,044 $522,250 210 104% 13 Toronto E02 103 $65,916,535 $639,966 $585,200 167 102% 16 Toronto E03 144 $76,819,102 $533,466 $487,000 255 104% 15 Toronto E04 146 $49,933,524 $342,010 $353,875 274 99% 24 Toronto E05 96 $37,639,498 $392,078 $356,450 167 101% 23 Toronto E06 61 $30,706,941 $503,392 $402,000 126 101% 15 Toronto E07 115 $41,160,140 $357,914 $312,000 194 101% 33 Toronto E08 75 $30,569,475 $407,593 $350,000 155 97% 26 Toronto E09 144 $44,804,401 $311,142 $293,900 304 99% 30 Toronto E10 84 $36,807,387 $438,183 $416,500 144 100% 24 Toronto E11 133 $41,003,401 $308,296 $298,500 239 99% 26 Page 3 July 2010 Market Watch, February 2012 6
- 7. Toronto Real Estate Board DETACHED HOUSES, FEBRUARY 2012 Industrial Leasing SUMMARY OF EXISTING HOME TRANSACTIONS ALL TREB AREAS Sales1 Dollar Volume1 Average Price1 Median Price1 New Listings2 Active Listings3 Avg. SP/LP 4 Avg. DOM5 TREB Total 3,427 - $2,179,845,599 - $636,080 - $534,000 - 6,225 - 6,993 - 99% - 24 - Halton Region 298 $207,677,375 $696,904 $560,000 557 685 97% 29 Burlington 31 $23,228,589 $749,309 $575,000 63 96 95% 57 Halton Hills 69 $34,781,650 $504,082 $463,000 115 143 98% 26 Milton 88 $45,528,006 $517,364 $508,450 147 137 99% 17 Oakville 110 - $104,139,130 - $946,719 - $701,250 - 232 - 309 - 97% - 32 - Peel Region 654 $379,067,503 $579,614 $520,000 1,270 1,423 98% 24 Brampton 332 $157,239,835 $473,614 $449,450 648 669 98% 23 Caledon 48 $29,998,000 $624,958 $523,500 111 197 97% 37 Mississauga 274 - $191,829,668 - $700,108 - $600,000 - 511 - 557 - 98% - 23 - City of Toronto 927 $759,041,681 $818,815 $650,000 1,661 1,496 102% 16 ! TURN PAGE FOR CITY OF TORONTO TABLES OR CLICK HERE: - - - - - - - - York Region 812 $566,838,038 $698,076 $642,250 1,366 1,490 99% 24 Aurora 47 $32,658,599 $694,864 $622,000 85 94 98% 20 E. Gwillimbury 28 $15,391,490 $549,696 $488,500 36 54 98% 38 Georgina 76 $24,649,864 $324,340 $323,000 102 175 97% 37 King 25 $24,121,500 $964,860 $900,000 45 108 95% 68 Markham 164 $122,565,036 $747,348 $701,450 291 259 100% 20 Newmarket 70 $35,551,988 $507,886 $470,000 105 90 99% 16 Richmond Hill 160 $136,612,071 $853,825 $707,000 265 216 99% 19 Vaughan 197 $146,324,726 $742,765 $680,000 351 355 99% 18 Whitchurch-Stouffville 45 - $28,962,764 - $643,617 - $542,500 - 86 - 139 - 97% - 51 - Durham Region 591 $212,776,689 $360,028 $343,000 1,047 1,311 98% 29 Ajax 102 $40,776,298 $399,768 $391,500 170 162 98% 21 Brock 13 $3,150,800 $242,369 $222,000 39 110 95% 110 Clarington 108 $33,353,620 $308,830 $294,000 185 229 98% 34 Oshawa 146 $40,463,966 $277,150 $262,250 251 287 98% 30 Pickering 64 $29,514,426 $461,163 $429,000 102 126 99% 20 Scugog 20 $9,261,250 $463,063 $341,250 48 99 96% 58 Uxbridge 18 $8,894,500 $494,139 $460,000 40 93 97% 43 Whitby 120 - $47,361,829 - $394,682 - $372,500 - 212 - 205 - 99% - 20 - Dufferin County 30 $10,424,400 $347,480 $332,250 60 98 98% 38 Orangeville 30 - $10,424,400 - $347,480 - $332,250 - 60 - 98 - 98% - 38 - Simcoe County 115 $44,019,913 $382,782 $331,000 264 490 97% 60 Adjala-Tosorontio 18 $7,739,200 $429,956 $417,500 31 66 97% 97 Bradford West Gwillimbury 24 $11,410,700 $475,446 $429,500 46 61 96% 38 Essa 9 $3,232,900 $359,211 $335,000 51 94 99% 39 Innisfil 31 $10,256,000 $330,839 $277,000 83 174 97% 69 New Tecumseth 33 $11,381,113 $344,882 $298,900 53 95 97% 53 Page 3 July 2010 Market Watch, February 2012 7
- 8. Toronto Real Estate Board DETACHED HOUSES, FEBRUARY 2012 Industrial Leasing SUMMARY OF EXISTING HOME TRANSACTIONS CITY OF TORONTO MUNICIPAL BREAKDOWN Sales1 Dollar Volume1 Average Price1 Median Price1 New Listings2 Active Listings3 Avg. SP/LP 4 Avg. DOM5 TREB Total 3,427 $2,179,845,599 $636,080 $534,000 6,225 6,993 99% 24 City of Toronto Total 927 $759,041,681 $818,815 $650,000 1,661 1,496 102% 16 Toronto West 271 $174,311,727 $643,217 $540,000 513 509 101% 18 Toronto W01 10 $9,361,500 $936,150 $820,000 24 18 103% 10 Toronto W02 22 $20,074,323 $912,469 $862,500 48 40 107% 12 Toronto W03 32 $12,235,000 $382,344 $357,000 57 58 100% 17 Toronto W04 22 $10,310,300 $468,650 $408,700 54 80 100% 30 Toronto W05 22 $10,026,900 $455,768 $470,000 33 31 100% 18 Toronto W06 31 $17,833,250 $575,266 $495,000 54 44 103% 14 Toronto W07 18 $14,215,907 $789,773 $711,000 28 21 100% 20 Toronto W08 60 $54,059,359 $900,989 $783,466 124 133 100% 22 Toronto W09 24 $14,117,988 $588,250 $570,000 48 39 101% 18 Toronto W10 30 $12,077,200 $402,573 $380,500 43 45 99% 17 Toronto Central 325 $402,758,238 $1,239,256 $1,037,000 620 583 102% 16 Toronto C01 6 $6,708,168 $1,118,028 $1,163,084 7 8 104% 39 Toronto C02 9 $18,551,000 $2,061,222 $1,775,000 23 31 101% 9 Toronto C03 34 $34,589,400 $1,017,335 $759,000 73 68 101% 19 Toronto C04 62 $73,518,100 $1,185,776 $1,150,000 113 104 103% 15 Toronto C06 16 $11,039,518 $689,970 $690,000 28 26 104% 18 Toronto C07 39 $33,126,986 $849,410 $810,000 75 61 102% 14 Toronto C08 1 $645,000 $645,000 $645,000 4 7 98% 74 Toronto C09 7 $16,656,226 $2,379,461 $2,375,000 29 36 97% 11 Toronto C10 15 $15,970,000 $1,064,667 $975,000 20 15 109% 6 Toronto C11 13 $22,016,888 $1,693,607 $1,779,000 22 21 102% 11 Toronto C12 31 $71,610,576 $2,310,019 $2,179,000 71 92 98% 26 Toronto C13 25 $23,251,700 $930,068 $854,200 41 27 103% 14 Toronto C14 39 $46,439,988 $1,190,769 $1,152,000 64 54 106% 17 Toronto C15 28 $28,634,688 $1,022,667 $857,944 50 33 103% 11 Toronto East 331 $181,971,716 $549,763 $480,000 528 404 102% 14 Toronto E01 17 $10,671,267 $627,722 $660,000 23 20 104% 8 Toronto E02 24 $19,856,400 $827,350 $762,500 48 29 103% 13 Toronto E03 59 $35,823,672 $607,181 $526,500 94 63 105% 13 Toronto E04 44 $18,844,336 $428,280 $429,500 63 49 101% 13 Toronto E05 19 $11,266,770 $592,988 $595,000 27 18 102% 15 Toronto E06 32 $19,613,091 $612,909 $415,000 63 40 102% 12 Toronto E07 16 $9,269,056 $579,316 $550,600 28 22 106% 8 Toronto E08 22 $11,480,075 $521,822 $471,950 37 38 99% 16 Toronto E09 31 $12,886,350 $415,689 $410,000 43 37 101% 12 Toronto E10 40 $20,737,399 $518,435 $475,000 64 59 101% 17 Toronto E11 27 $11,523,300 $426,789 $371,000 38 29 100% 18 Page 3 July 2010 Market Watch, February 2012 8
- 9. Toronto Real Estate Board SEMI-DETACHED HOUSES, FEBRUARY 2012 Industrial Leasing SUMMARY OF EXISTING HOME TRANSACTIONS ALL TREB AREAS Sales1 Dollar Volume1 Average Price1 Median Price1 New Listings2 Active Listings3 Avg. SP/LP 4 Avg. DOM5 TREB Total 757 - $347,814,617 - $459,464 - $420,000 - 1,132 - 827 - 102% - 15 - Halton Region 37 $14,943,100 $403,868 $399,000 50 33 100% 11 Burlington 5 $2,043,000 $408,600 $399,000 5 2 101% 12 Halton Hills 3 $1,135,100 $378,367 $379,900 7 4 101% 4 Milton 23 $9,090,500 $395,239 $385,000 27 14 99% 12 Oakville 6- $2,674,500 - $445,750 - $420,000 - 11 - 13 - 99% - 12 - Peel Region 260 $101,357,225 $389,835 $385,000 395 299 99% 16 Brampton 138 $49,872,225 $361,393 $353,250 216 184 99% 18 Caledon 6 $2,432,200 $405,367 $392,750 5 6 99% 13 Mississauga 116 - $49,052,800 - $422,869 - $424,500 - 174 - 109 - 99% - 13 - City of Toronto 283 $165,646,949 $585,325 $512,000 428 308 104% 12 ! TURN PAGE FOR CITY OF TORONTO TABLES OR CLICK HERE: - - - - - - - - York Region 106 $47,933,643 $452,204 $461,500 157 89 100% 12 Aurora 6 $2,314,500 $385,750 $369,500 7 3 100% 6 E. Gwillimbury 1 $384,000 $384,000 $384,000 - - 97% 25 Georgina 2 $545,000 $272,500 $272,500 2 2 100% 29 King - - - - - - - - Markham 32 $15,652,300 $489,134 $476,500 48 29 101% 11 Newmarket 18 $6,847,200 $380,400 $383,450 26 13 101% 11 Richmond Hill 9 $4,280,000 $475,556 $471,000 23 14 100% 6 Vaughan 29 $14,288,400 $492,703 $480,000 38 18 99% 15 Whitchurch-Stouffville 9- $3,622,243 - $402,471 - $407,555 - 13 - 10 - 100% - 13 - Durham Region 62 $15,692,800 $253,110 $241,450 81 78 99% 27 Ajax 12 $3,806,700 $317,225 $315,250 20 19 99% 17 Brock - - - - - 1 - - Clarington 2 $430,900 $215,450 $215,450 2 2 99% 73 Oshawa 29 $5,630,600 $194,159 $192,000 36 35 98% 28 Pickering 15 $4,796,600 $319,773 $310,000 14 11 99% 26 Scugog 1 $249,000 $249,000 $249,000 2 1 96% 4 Uxbridge 1 $290,000 $290,000 $290,000 - 1 98% 37 Whitby 2- $489,000 - $244,500 - $244,500 - 7- 8- 98% - 29 - Dufferin County 5 $1,144,900 $228,980 $233,900 7 5 96% 19 Orangeville 5 - $1,144,900 - $228,980 - $233,900 - 7 - 5 - 96% - 19 - Simcoe County 4 $1,096,000 $274,000 $263,500 14 15 100% 13 Adjala-Tosorontio - - - - - - - - Bradford West Gwillimbury 2 $643,000 $321,500 $321,500 9 7 101% 11 Essa - - - - 3 4 - - Innisfil - - - - - - - - New Tecumseth 2 $453,000 $226,500 $226,500 2 4 99% 16 Page 3 July 2010 Market Watch, February 2012 9
- 10. Toronto Real Estate Board SEMI-DETACHED HOUSES, FEBRUARY 2012 Industrial Leasing SUMMARY OF EXISTING HOME TRANSACTIONS CITY OF TORONTO MUNICIPAL BREAKDOWN Sales1 Dollar Volume1 Average Price1 Median Price1 New Listings2 Active Listings3 Avg. SP/LP 4 Avg. DOM5 TREB Total 757 $347,814,617 $459,464 $420,000 1,132 827 102% 15 City of Toronto Total 283 $165,646,949 $585,325 $512,000 428 308 104% 12 Toronto West 74 $34,798,951 $470,256 $456,500 132 119 101% 16 Toronto W01 1 $695,000 $695,000 $695,000 8 6 101% 8 Toronto W02 18 $10,715,901 $595,328 $550,000 25 14 102% 11 Toronto W03 23 $9,448,000 $410,783 $425,000 38 36 101% 17 Toronto W04 5 $2,172,500 $434,500 $460,000 8 7 99% 18 Toronto W05 16 $6,641,800 $415,113 $387,250 35 44 99% 20 Toronto W06 5 $2,291,250 $458,250 $468,000 7 3 101% 18 Toronto W07 1 $637,000 $637,000 $637,000 2 1 116% 5 Toronto W08 2 $1,008,000 $504,000 $504,000 1 - 103% 9 Toronto W09 1 $420,000 $420,000 $420,000 3 3 97% 21 Toronto W10 2 $769,500 $384,750 $384,750 5 5 99% 3 Toronto Central 87 $65,643,464 $754,523 $666,080 120 80 106% 12 Toronto C01 17 $12,097,350 $711,609 $605,000 23 18 110% 17 Toronto C02 15 $14,227,606 $948,507 $759,900 25 17 109% 7 Toronto C03 5 $2,885,150 $577,030 $578,000 7 8 100% 14 Toronto C04 10 $8,782,588 $878,259 $800,344 17 6 103% 13 Toronto C06 - - - - - - - - Toronto C07 1 $509,000 $509,000 $509,000 1 - 100% 1 Toronto C08 5 $3,880,400 $776,080 $987,900 3 4 99% 10 Toronto C09 2 $3,571,000 $1,785,500 $1,785,500 2 4 99% 51 Toronto C10 8 $6,707,600 $838,450 $822,500 11 3 108% 7 Toronto C11 3 $2,155,000 $718,333 $720,000 3 2 106% 5 Toronto C12 1 $610,500 $610,500 $610,500 1 - 107% 5 Toronto C13 4 $1,628,800 $407,200 $394,400 8 6 105% 6 Toronto C14 - - - - - - - - Toronto C15 16 $8,588,470 $536,779 $527,550 19 12 106% 13 Toronto East 122 $65,204,534 $534,463 $495,500 176 109 104% 11 Toronto E01 40 $24,204,063 $605,102 $591,000 63 37 106% 9 Toronto E02 25 $14,778,673 $591,147 $538,500 44 23 104% 7 Toronto E03 21 $12,404,400 $590,686 $505,000 31 16 106% 10 Toronto E04 3 $1,009,000 $336,333 $325,000 3 7 97% 8 Toronto E05 4 $1,752,000 $438,000 $437,500 2 3 100% 20 Toronto E06 4 $1,691,000 $422,750 $414,250 4 2 99% 12 Toronto E07 8 $3,217,898 $402,237 $390,500 5 1 102% 11 Toronto E08 - - - - - 1 - - Toronto E09 5 $1,719,900 $343,980 $339,900 7 3 99% 18 Toronto E10 5 $1,944,400 $388,880 $410,500 6 3 99% 8 Toronto E11 7 $2,483,200 $354,743 $358,800 11 13 101% 28 Page 3 July 2010 Market Watch, February 2012 10
- 11. Toronto Real Estate Board CONDOMINIUM TOWNHOUSES, FEBRUARY 2012 Industrial Leasing SUMMARY OF EXISTING HOME TRANSACTIONS ALL TREB AREAS Sales1 Dollar Volume1 Average Price1 Median Price1 New Listings2 Active Listings3 Avg. SP/LP 4 Avg. DOM5 TREB Total 461 - $147,474,339 - $319,901 - $300,000 - 804 - 900 - 99% - 25 - Halton Region 23 $7,436,300 $323,317 $271,000 50 47 99% 24 Burlington 10 $3,205,000 $320,500 $280,500 13 11 98% 25 Halton Hills 5 $1,108,300 $221,660 $200,000 5 5 100% 18 Milton 2 $635,000 $317,500 $317,500 2 1 100% 19 Oakville 6- $2,488,000 - $414,667 - $338,100 - 30 - 30 - 100% - 31 - Peel Region 188 $55,952,801 $297,621 $297,000 276 268 98% 23 Brampton 45 $10,962,650 $243,614 $227,000 70 72 98% 29 Caledon 1 $338,500 $338,500 $338,500 - - 98% 28 Mississauga 142 - $44,651,651 - $314,448 - $312,000 - 206 - 196 - 99% - 21 - City of Toronto 152 $55,617,438 $365,904 $338,000 279 355 100% 27 ! TURN PAGE FOR CITY OF TORONTO TABLES OR CLICK HERE: - - - - - - - - York Region 44 $17,036,000 $387,182 $370,250 109 110 99% 19 Aurora 4 $1,544,700 $386,175 $332,350 6 13 99% 46 E. Gwillimbury - - - - - - - - Georgina - - - - 1 2 - - King - - - - 1 1 - - Markham 14 $5,300,200 $378,586 $362,500 43 51 99% 23 Newmarket 7 $2,199,000 $314,143 $313,000 22 16 99% 14 Richmond Hill 11 $4,117,100 $374,282 $410,000 13 7 98% 10 Vaughan 8 $3,875,000 $484,375 $446,000 19 16 99% 14 Whitchurch-Stouffville - - - - - - - - 4- 4- - - - - Durham Region 47 $9,950,300 $211,709 $217,000 86 117 98% 26 Ajax 8 $1,928,000 $241,000 $241,000 19 18 98% 20 Brock - - - - 1 7 - - Clarington 3 $547,500 $182,500 $173,000 3 10 99% 25 Oshawa 13 $1,839,850 $141,527 $126,000 26 39 97% 26 Pickering 13 $3,480,950 $267,765 $284,900 27 29 99% 25 Scugog - - - - - - - - Uxbridge 2 $552,000 $276,000 $276,000 3 4 96% 19 Whitby 8- $1,602,000 - $200,250 - $205,000 - 7- 10 - 98% - 37 - Dufferin County 1 $205,000 $205,000 $205,000 2 2 98% 25 Orangeville 1 - $205,000 - $205,000 - $205,000 - 2 - 2 - 98% - 25 - Simcoe County 6 $1,276,500 $212,750 $218,500 2 1 98% 51 Adjala-Tosorontio - - - - - - - - Bradford West Gwillimbury 2 $474,500 $237,250 $237,250 1 - 99% 20 Essa - - - - - - - - Innisfil - - - - - - - - New Tecumseth 4 $802,000 $200,500 $200,000 1 1 98% 67 Page 3 July 2010 Market Watch, February 2012 11
- 12. Toronto Real Estate Board CONDOMINIUM TOWNHOUSES, FEBRUARY 2012 Industrial Leasing SUMMARY OF EXISTING HOME TRANSACTIONS CITY OF TORONTO MUNICIPAL BREAKDOWN Sales1 Dollar Volume1 Average Price1 Median Price1 New Listings2 Active Listings3 Avg. SP/LP 4 Avg. DOM5 TREB Total 461 $147,474,339 $319,901 $300,000 804 900 99% 25 City of Toronto Total 152 $55,617,438 $365,904 $338,000 279 355 100% 27 Toronto West 39 $11,595,950 $297,332 $290,000 87 113 99% 40 Toronto W01 2 $854,500 $427,250 $427,250 11 11 101% 9 Toronto W02 4 $1,612,500 $403,125 $397,500 8 6 99% 16 Toronto W03 2 $554,000 $277,000 $277,000 4 4 99% 57 Toronto W04 2 $672,000 $336,000 $336,000 3 11 103% 11 Toronto W05 12 $2,912,650 $242,721 $247,750 26 38 97% 65 Toronto W06 4 $1,924,000 $481,000 $424,450 9 11 99% 36 Toronto W07 1 $252,500 $252,500 $252,500 1 - 95% 27 Toronto W08 4 $1,504,000 $376,000 $375,500 5 5 101% 26 Toronto W09 - - - - 4 5 - - Toronto W10 8 $1,309,800 $163,725 $160,750 16 22 95% 35 Toronto Central 54 $26,377,388 $488,470 $421,500 86 102 100% 21 Toronto C01 11 $4,933,800 $448,527 $396,000 22 23 102% 20 Toronto C02 3 $1,583,000 $527,667 $448,000 4 7 97% 22 Toronto C03 - - - - - - - - Toronto C04 - - - - - 2 - - Toronto C06 - - - - - 2 - - Toronto C07 2 $821,500 $410,750 $410,750 7 10 98% 22 Toronto C08 6 $3,117,400 $519,567 $464,200 4 6 99% 15 Toronto C09 3 $2,137,000 $712,333 $690,000 1 1 103% 45 Toronto C10 1 $909,000 $909,000 $909,000 2 3 98% 17 Toronto C11 4 $1,111,000 $277,750 $249,500 5 5 97% 13 Toronto C12 5 $3,937,500 $787,500 $727,500 6 5 100% 15 Toronto C13 - - - - 3 3 - - Toronto C14 8 $4,065,888 $508,236 $428,000 13 13 101% 17 Toronto C15 11 $3,761,300 $341,936 $356,000 19 22 99% 28 Toronto East 59 $17,644,100 $299,053 $299,000 106 140 99% 23 Toronto E01 8 $3,040,500 $380,063 $360,750 6 7 102% 16 Toronto E02 2 $1,048,000 $524,000 $524,000 2 6 99% 11 Toronto E03 - - - - 1 1 - - Toronto E04 9 $2,720,400 $302,267 $315,000 16 22 98% 13 Toronto E05 7 $2,051,200 $293,029 $301,000 20 22 100% 22 Toronto E06 - - - - 3 1 - - Toronto E07 5 $1,711,900 $342,380 $325,000 9 10 102% 22 Toronto E08 6 $1,527,000 $254,500 $265,500 9 12 99% 29 Toronto E09 3 $1,008,200 $336,067 $378,000 13 24 99% 43 Toronto E10 4 $943,000 $235,750 $210,000 8 11 97% 39 Toronto E11 15 $3,593,900 $239,593 $240,000 19 24 97% 25 Page 3 July 2010 Market Watch, February 2012 12