1. Local Market Update – November 2012
A RESEARCH TOOL PROVIDED BY THE INDIANA ASSOCIATION OF REALTORS®
+ 36.8% + 66.2% + 11.3%
Change in Change in Change in
Monroe County New Listings Closed Sales Median Sales Price
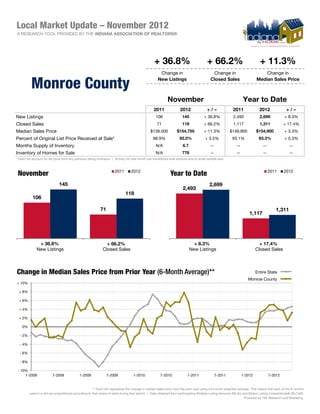
November Year to Date
2011 2012 +/– 2011 2012 +/–
New Listings 106 145 + 36.8% 2,493 2,699 + 8.3%
Closed Sales 71 118 + 66.2% 1,117 1,311 + 17.4%
Median Sales Price $139,000 $154,750 + 11.3% $149,900 $154,900 + 3.3%
Percent of Original List Price Received at Sale* 88.9% 92.0% + 3.5% 93.1% 93.3% + 0.3%
Months Supply of Inventory N/A 6.7 -- -- -- --
Inventory of Homes for Sale N/A 778 -- -- -- --
* Does not account for list price from any previous listing contracts. | Activity for one month can sometimes look extreme due to small sample size.
2011 2012 2011 2012
November Year to Date
145 2,699
2,493
118
106
71 1,311
1 311
1,117
+ 36.8% + 66.2% + 8.3% + 17.4%
New Listings Closed Sales New Listings Closed Sales
Change in Median Sales Price from Prior Year (6-Month Average)** Entire State b
Monroe County a
+ 10%
+ 8%
+ 6%
+ 4%
+ 2%
0%
- 2%
- 4%
- 6%
- 8%
- 10%
1-2008 7-2008 1-2009 7-2009 1-2010 7-2010 1-2011 7-2011 1-2012 7-2012
** Each dot represents the change in median sales price from the prior year using a 6-month weighted average. This means that each of the 6 months
used in a dot are proportioned according to their share of sales during that period. | Data obtained from participating Multiple Listing Services (MLSs) and Broker Listing Cooperatives® (BLCs®).
Powered by 10K Research and Marketing.
2. Local Market Update – November 2012
A RESEARCH TOOL PROVIDED BY THE INDIANA ASSOCIATION OF REALTORS®
+ 2.5% + 34.9% + 7.1%
Change in Change in Change in
Monroe County New Listings Closed Sales Median Sales Price
Last 3 Mos. Compared Last 3 Mos. Compared Last 3 Mos. Compared
to a Year Ago to a Year Ago to a Year Ago
Sep through Nov Dec through Nov
2011 2012 +/– 2011 2012 +/–
New Listings 475 487 + 2.5% 2,597 2,815 + 8.4%
Closed Sales 238 321 + 34.9% 1,198 1,402 + 17.0%
Median Sales Price $140,000 $150,000 + 7.1% $148,900 $152,320 + 2.3%
Percent of Original List Price Received at Sale* 91.7% 92.4% 0.7% 93.1% 93.1% 0.0%
* Does not account for list price from any previous listing contracts. | Activity for one month can sometimes look extreme due to small sample size.
2011 2012 2011 2012
Dec through Nov Sep through Nov
2,815
2,597
475 487
321
1,402
1 402
1,198 238
+ 8.4% + 17.0% + 2.5% + 34.9%
New Listings Closed Sales New Listings Closed Sales
Change in Median Sales Price from Prior Year (6-Month Average)** Entire State b
Monroe County a
+ 10%
+ 8%
+ 6%
+ 4%
+ 2%
0%
- 2%
- 4%
- 6%
- 8%
- 10%
1-2008 7-2008 1-2009 7-2009 1-2010 7-2010 1-2011 7-2011 1-2012 7-2012
** Each dot represents the change in median sales price from the prior year using a 6-month weighted average. This means that each of the 6 months
used in a dot are proportioned according to their share of sales during that period. | Data obtained from participating Multiple Listing Services (MLSs) and Broker Listing Cooperatives® (BLCs®).
Powered by 10K Research and Marketing.