A study on modelling and simulation of photovoltaic cells
ESA SAS paper 2011ESASP_690E__62S
1. A PRACTICAL GUIDE TO SOLAR ARRAY SIMULATION AND PCDU TEST
Noah Schmitz (1)
, Greg Carroll (2)
, Russell Clegg (3)
(1)
Agilent Technologies, 9780 S Meridian Blvd, Englewood CO, USA, noah_schmitz@agilent.com
(2)
Agilent Technologies, 900 South Taft Avenue, Loveland, CO, USA, greg_carroll@agilent.com
(3)
Agilent Technologies, 550 Clark Drive, Suite 101, Budd Lake NJ, USA, russell_clegg@agilent.com
ABSTRACT
Solar arrays consisting of multiple photovoltaic
segments provide power to satellites and charge internal
batteries for use during eclipse. Solar arrays have
unique I-V characteristics and output power which vary
with environmental and operational conditions such as
temperature, irradiance, spin, and eclipse. Therefore,
specialty power solutions are needed to properly test the
satellite on the ground, especially the Power Control
and Distribution Unit (PCDU) and the Array Power
Regulator (APR.)
This paper explores some practical and theoretical
considerations that should be taken into account when
choosing a commercial, off-the-shelf solar array
simulator (SAS) for verification of the satellite PCDU.
An SAS is a unique power supply with I-V output
characteristics that emulate the solar arrays used to
power a satellite. It is important to think about the
strengths and the limitations of this emulation
capability, how closely the SAS approximates a real
solar panel, and how best to design a system using SAS
as components.
1. EMULATION OF A SOLAR PANEL
It is important to consider both the strengths and the
limitations of a commercial SAS when designing the
Electronic Ground Support Equipment (EGSE) for
PCDU verification. The main benefits of using a piece
of test equipment rather than an actual solar panel are
convenience and flexibility. The main drawbacks relate
to the simple fact that any electronic device has
fundamental limits in dynamic performance.
1.1 Benefits
Space is a hostile environment. A satellite will
encounter rapid, large-magnitude variations in
irradiance and temperature, which affect performance
and efficiency. These variations are caused by physical
phenomena (such as distance from the sun) as well as
operational phenomena (such as eclipse.) It is critical to
verify on the ground that the PCDU operates efficiently
and effectively throughout these environmental and
operational changes.
An SAS enables scientists and engineers in the lab to
replicate an entire satellite lifecycle by implementing
different I-V curves that correspond to changing
conditions. Environmental conditions include
temperature and irradiance, among other factors. As
FDQEHVHHQLQ)LJDVRODUSDQHO¶VRXWSXWSRZHUZLOO
reduce as the temperature increases. Notice that the
value for open circuit voltage (Voc) decreases
dramatically as temperature rises. This is caused by
increased conductivity in the semiconductor material in
each cell, which lowers the junction electric field,
inhibiting charge separation and effectively lowering the
voltage. This is offset slightly by higher mobility in the
electrons caused by higher temperature, but the overall
effect is a reduction in efficiency.
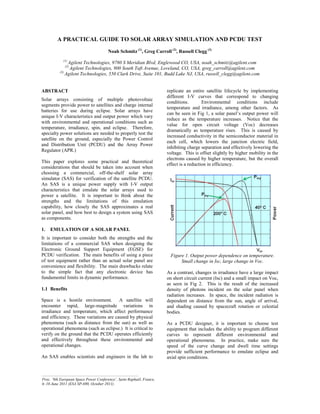
Figure 1. Output power dependence on temperature.
Small change in Isc, large change in Voc.
As a contrast, changes in irradiance have a large impact
on short circuit current (Isc) and a small impact on Voc,
as seen in Fig 2. This is the result of the increased
density of photons incident on the solar panel when
radiation increases. In space, the incident radiation is
dependent on distance from the sun, angle of arrival,
and shading caused by spacecraft rotation or celestial
bodies.
As a PCDU designer, it is important to choose test
equipment that includes the ability to program different
curves to represent different environmental and
operational phenomena. In practice, make sure the
speed of the curve change and dwell time settings
provide sufficient performance to emulate eclipse and
axial spin conditions.
_________________________________________________
Proc. ‘9th European Space Power Conference’, Saint Raphaël, France,
6–10 June 2011 (ESA SP-690, October 2011)
2. Figure 2. Output power dependence on irradiance.
Pmp = power, Imp = current, Vmp = voltage at
maximum power point.
1.2 Limitations
The main limitation of using an electronic instrument to
simulate the output of a solar panel is the speed at which
transitions can occur resulting from stimuli. A
semiconductor reacts almost instantaneously to changes
in load and external input. An electronic device relies
on the bandwidth of its interconnected feedback loops to
recreate this dynamic performance. A good rule of
thumb is to ensure that the update rate of the simulator
is at least one order of magnitude higher than the update
rate of the APR in the PCDU. This will increase the
likelihood that the APR sees a smooth I-V output curve
rather than discrete steps. Keep in mind that update rate
can take on two different forms, as seen in Fig. 3:
1. How fast the SAS changes curves to simulate a
change in operating condition
2. How fast the SAS moves its operating point along a
single curve to simulate a change in loading
Figure 3. I-V curve versus operating point
Dynamic performance requirements depend also on the
regulation topology implemented in the APR. For
Maximum Peak Power Tracker (MPPT) applications, it
is important that the SAS utilize a high resolution curve
(many I-V points) and have sufficient loop gain
EDQGZLGWKDURXQGWKH³NQHH´6KRZQEWKHImp,Vmp
point in Fig. 2) For Sequential Shunt Switching (S3R)
applications, it is important to have a very fast current
settling time and be able to support switching
frequencies in the tens of kHz.
1.3 Dynamic Performance
For both MPPT and S3R applications, the dynamic
performance demands are such that standard DC
SURJUDPPDEOH SRZHU VXSSOLHV FDQ¶W UHDFW TXickly
enough. They are designed to be very good voltage
sources with high output capacitance and very distinct
modes of operation between Constant Current (CC) and
Constant Voltage (CV). An SAS, on the other hand, is
designed to act like a fast-moving current source with
low output capacitance and little to no mode crossover
effects. The best measure of SAS performance, then, is
how closely it mimics the actual characteristics of a
physical solar cell, module, panel, or array.
2. OPERATIONAL EXAMPLES
2.1 Voltage and current response
Figs 4a-4d show the time domain response of an Agilent
E4360A SAS compared to a Raloss SR30-36 solar panel
with the following typical electrical characteristics
provided by the manufacturer at irradiation of 1kW/m2
and 25
o
C panel temperature:
Isc = 1.91A
Voc = 21.81V
Imp = 1.76A
Vmp = 17.49V
In this experiment, the solar panel was illuminated with
an artificial light source capable of producing irradiation
of approximately 500W/m2
, similar to the solar density
on the surface of Mars. 7KHSDQHO¶VRXWSXWYROWDJHZDV
measured in response to sweeping the output current
with a voltage-fed converter. Then the output current
was measured in response to sweeping the output
voltage with a current-fed converter. [1] The time
period of the entire back and forth sweep was roughly 2
seconds. The panel was then replaced with the SAS and
the same measurements repeated. During the testing,
the SAS was programmed to the following settings,
which were measured from the reference panel at a
temperature of 44
o
C:
Isc = 1.035A
Voc = 19.225V
Imp = 0.947A
Vmp = 15.825V
3.
4.
5.
6. purpose test components can all be integrated into
the rack to help guard against damage caused by
temperature, current, voltage, vibration and shock,
and operator error.
4. CONCLUSION
Satellites are high complexity machines that require
sophisticated test equipment and procedures. Solar
Array Simulators are DC power supplies designed
specifically to act like current sources and emulate the
dynamic I-V output characteristics of a real photovoltaic
array. Great care must be taken when considering what
kind of SAS to procure, how to integrate it into a
system, and how to protect your investment in the
spacecraft as well as the EGSE.
5. REFERENCES
1. Suntio, Teuvo; Mäki, Anssi; Leppäaho, Jari;
Valkealahti, Seppo. (2011). On the Validation of
Photovoltaic Interconnection Converters. IEEE
Transactions on Power Electronics. University of
Tampere, Finland.
2. Feng, Xiaogang, Liu, Jinjun, Lee, Fred. (2002).
Impedance Specifications for Stable DC Distributed
Power Systems. IEEE Transactions on Power
Electronics Vol 17 No2.
3. Middlebrook, R. D. (1976) Input filter
consideration in design and application of
switching regulators. Proceedings of the IEEE
Industrial Application Society Annual Meeting.
4. Roeder, Reinhard. (2010). BepiColombo Electrical
Power Subsystem Specification BC-ASD-SP-00028,
European Space Agency BepiColombo Satellite
Programme. EADS Astrium, Friedrichshafen,
Germany.
5. Seipel, Win. (2008). Sequential Shunt Regulation
Application Note 5989-9791EN. Agilent
Technologies, Budd Lake, NJ, USA.
6. Tonicello, Ferdinando, Taylor, Stephen, Fernandez-
Lisbona, Emilio, Strobl, Gerhard, Detleff, Klaus.
(2005). Investigation at component and power
subsystem level into the application of protection
diodes for multi-junction solar cells. Proceedings of
the Seventh European Space Power Conference,
Stresa, Italy.
![Figure 2. Output power dependence on irradiance.
Pmp = power, Imp = current, Vmp = voltage at
maximum power point.
1.2 Limitations
The main limitation of using an electronic instrument to
simulate the output of a solar panel is the speed at which
transitions can occur resulting from stimuli. A
semiconductor reacts almost instantaneously to changes
in load and external input. An electronic device relies
on the bandwidth of its interconnected feedback loops to
recreate this dynamic performance. A good rule of
thumb is to ensure that the update rate of the simulator
is at least one order of magnitude higher than the update
rate of the APR in the PCDU. This will increase the
likelihood that the APR sees a smooth I-V output curve
rather than discrete steps. Keep in mind that update rate
can take on two different forms, as seen in Fig. 3:
1. How fast the SAS changes curves to simulate a
change in operating condition
2. How fast the SAS moves its operating point along a
single curve to simulate a change in loading
Figure 3. I-V curve versus operating point
Dynamic performance requirements depend also on the
regulation topology implemented in the APR. For
Maximum Peak Power Tracker (MPPT) applications, it
is important that the SAS utilize a high resolution curve
(many I-V points) and have sufficient loop gain
EDQGZLGWKDURXQGWKH³NQHH´6KRZQEWKHImp,Vmp
point in Fig. 2) For Sequential Shunt Switching (S3R)
applications, it is important to have a very fast current
settling time and be able to support switching
frequencies in the tens of kHz.
1.3 Dynamic Performance
For both MPPT and S3R applications, the dynamic
performance demands are such that standard DC
SURJUDPPDEOH SRZHU VXSSOLHV FDQ¶W UHDFW TXickly
enough. They are designed to be very good voltage
sources with high output capacitance and very distinct
modes of operation between Constant Current (CC) and
Constant Voltage (CV). An SAS, on the other hand, is
designed to act like a fast-moving current source with
low output capacitance and little to no mode crossover
effects. The best measure of SAS performance, then, is
how closely it mimics the actual characteristics of a
physical solar cell, module, panel, or array.
2. OPERATIONAL EXAMPLES
2.1 Voltage and current response
Figs 4a-4d show the time domain response of an Agilent
E4360A SAS compared to a Raloss SR30-36 solar panel
with the following typical electrical characteristics
provided by the manufacturer at irradiation of 1kW/m2
and 25
o
C panel temperature:
Isc = 1.91A
Voc = 21.81V
Imp = 1.76A
Vmp = 17.49V
In this experiment, the solar panel was illuminated with
an artificial light source capable of producing irradiation
of approximately 500W/m2
, similar to the solar density
on the surface of Mars. 7KHSDQHO¶VRXWSXWYROWDJHZDV
measured in response to sweeping the output current
with a voltage-fed converter. Then the output current
was measured in response to sweeping the output
voltage with a current-fed converter. [1] The time
period of the entire back and forth sweep was roughly 2
seconds. The panel was then replaced with the SAS and
the same measurements repeated. During the testing,
the SAS was programmed to the following settings,
which were measured from the reference panel at a
temperature of 44
o
C:
Isc = 1.035A
Voc = 19.225V
Imp = 0.947A
Vmp = 15.825V](data:image/gif;base64,R0lGODlhAQABAIAAAAAAAP///yH5BAEAAAAALAAAAAABAAEAAAIBRAA7)