SlideShare a Scribd company logo
1 of 29
Download to read offline
Available online at www.sciencedirect.com
Journal of Economic Dynamics & Control 27 (2003) 1069–1097
www.elsevier.com/locate/econbase
Retirement saving with contribution payments and
labor income as a benchmark for investments
Arjan Berkelaara, Roy Kouwenbergb; ∗
aWorld Bank, Pension Fund, Washington, DC, USA
bAEGON Asset Management and Erasmus University Rotterdam, P.O. Box 202, 2501 CE,
The Hague, Netherlands
Abstract
In this paper we study the retirement saving problem from the point of view of a plan
sponsor, who makes contribution payments for the future retirement of an employee. The plan
sponsor considers the employee’s labor income as investment-benchmark in order to ensure the
continuation of consumption habits after retirement. We demonstrate that the demand for risky
assets increases at low wealth levels due to the contribution payments. We quantify the demand
for hedging against changes in wage growth and 4nd that it is relatively small. We show that
downside-risk measures increase risk-taking at both low and high levels of wealth. ? 2002
Elsevier Science B.V. All rights reserved.
JEL classi-cation: G11; G23
Keywords: Retirement saving; Optimal asset allocation; Discrete-time 4nance; Dynamic programming
1. Introduction
In this paper we study the problem of saving for retirement with contribution pay-
ments and labor income as a benchmark for investments. We consider the retirement
saving problem from the point of view of a plan sponsor. The plan sponsor makes
contribution payments to an investment fund in order to save for the future retirement
of an employee. The goal is to ensure that the employee can continue his consumption
pattern after retirement. As the consumption habits of the employee are related to his
 This paper re:ects the personal views of the authors and not those of the World Bank. We are grateful
to Bart Oldenkamp and Ton Vorst for comments on an earlier version of this paper.
∗ Corresponding author. Econometric Institute, Erasmus University Rotterdam, P.O. Box 1738, 3000 DR
Rotterdam, Netherlands. Tel.: +31-70-3448089.
E-mail address: rkouwenberg@aegon.nl, kouwenberg@few.eur.nl (R. Kouwenberg).
0165-1889/02/$ - see front matter ? 2002 Elsevier Science B.V. All rights reserved.
PII: S0165-1889(02)00055-6
1070 A. Berkelaar, R. Kouwenberg / Journal of Economic Dynamics  Control 27 (2003) 1069–1097
wages, the plan sponsor considers the labor income of the employee as a benchmark
for investments.
Clearly, the plan sponsor is not only concerned about the welfare of the employee and
also wants to minimize his contribution payments. We formalize this in a multi-period
retirement saving model, where the plan sponsor makes a trade-oG between the utility
of low contribution payments and the utility of high fund values at retirement, relative
to the labor income of the employee. The solution of the model reveals the optimal
dynamic investment strategy and the optimal funding policy of the plan sponsor.
The retirement saving model presented in this paper includes both a de4ned con-
tributions pension plan and a ‘4nal pay’ de4ned bene4ts plan as special cases. The
generality of the model allows us to circumvent the large diGerence in pension schemes
throughout the world: we focus on the core of the retirement saving problem. Clearly,
not every plan sponsor or pension fund considers labor income as a benchmark for
investments. However, we believe that it is in the interest of the employees to do so,
without any adverse consequences.
An important assumption throughout the paper is that the labor income of the em-
ployee cannot be replicated with the available assets: consequently, the 4nancial market
is incomplete. Moreover, we assume that the wage growth rate is partly predictable.
Given the basic model setup, we derive optimal decision rules by applying dynamic
programming. The optimal decision rules specify the asset weights and the contribution
payment as a function of the state variables (the wealth-to-income ratio and the wage
growth rate) and provide direct insight into the underlying problem.
We are particularly interested in the following issues, which are relevant for retire-
ment saving and have not been studied adequately in the literature yet
1. What is the magnitude of the demand for the hedge portfolio against random changes
of the wage growth rate?
2. What is the impact of contribution payments on the optimal asset allocation?
3. What is the optimal multi-period investment strategy for investment objectives based
on downside-risk measures, which are very popular in practice?
4. What is the eGect of an objective that assigns utility to a high fund value before
the retirement date (on top of utility at retirement)?
With our implementation of the dynamic programming algorithm we were able to
address these three main questions about optimal investment and funding in the retire-
ment saving model. The conclusions to be drawn from our analysis and computational
experiments are as follows:
1. Regardless of his utility function, the plan sponsor invests in a hedge portfolio
against random :uctuations of the employee’s labor income. The hedge portfolio
depends on the covariance of the asset returns with the wage growth rate. The
numerical results demonstrate that the correlation between asset returns and wage
growth has a substantial in:uence on portfolio composition. Dynamic adjustments
of the hedging strategy due to changes of the wage growth rate are relatively small.
2. Contribution payments change the optimal investment strategy considerably, even for
a plan sponsor with constant relative risk aversion over fund value. The portfolio
A. Berkelaar, R. Kouwenberg / Journal of Economic Dynamics  Control 27 (2003) 1069–1097 1071
weights are no longer constant and there is a strong tendency to gamble at low
levels of wealth. We also 4nd that contribution payments lead to a strong investment
horizon eGect.
3. If a plan sponsor maximizes the expected fund value subject to a penalty on
downside-risk, then the optimal investment policy is to increase the weight of risky
assets at low levels of wealth. This gambling policy can be attributed to the property
of increasing relative risk aversion of the downside-risk objective.
4. Intertemporal measurement of utility over wealth reduces the gambling eGects due
to contribution payments considerably.
The insights gained from the basic retirement saving model studied in this paper may
help plan sponsors to formulate dynamic investment policies and choose reasonable
objectives. Furthermore, the optimal decision-rules derived here can be implemented
in simulation-based systems for ALM, where additional market imperfections such as
transaction costs could be added.
In order to place this paper in the literature, we could interpret the retirement saving
problem with labor income as an asset–liability management (ALM) problem. In the
literature many single-period ALM models have been studied (Sharpe and Tint, 1990;
Leibowitz et al., 1994). These models indicate that investors should take the correlation
between assets and liabilities into account, while deciding about the investment strategy.
However, saving for retirement typically involves a long-term investment goal, and
one-period models are, therefore, inappropriate due to stochastic opportunity sets and
non-myopic preferences.
There is a large stream of literature about the application of stochastic programming
methods for multi-period ALM (see Mulvey and Ziemba (1998) for an overview).
Stochastic programming models formulate an accurate answer to the question: how to
invest today, given optimal recourse in the future? However, the optimal policies do
not explicitly reveal the relation between the decisions and the state-variables. Our
main objective is to gain insight in optimal decision rules for portfolio choice and
funding in a simple micro-economic model without market imperfections.
Dynamic retirement saving problems have also been studied in the actuarial literature:
we refer to O’Brien (1987) for an early continuous-time formulation and Haberman and
Sung (1994) for a more recent discrete-time model. Haberman and Sung (1994) provide
a closed-form solution for a discrete-time pension model where the objective function
is to minimize the squared deviations from the target contribution rate, and the squared
deviations from the target funding ratio. The mathematical results of Haberman and
Sung (1994) are impressive but the approach can not be easily extended to objective
functions that are non-quadratic, or to problems with constraints on the policies, as
studied in this paper.
Due to the focus on dynamic programming and micro-economic analysis this paper
is also related to the individual consumption–investment literature (Mossin, 1968;
Hakansson, 1969; Samuelson, 1969). Our retirement saving model can be classi4ed
as a model with a stochastic opportunity set (predictable wage growth), with both
negative and positive consumption (the net contribution payment) and without a risk-
less asset (due to market incompleteness). Koo (1999) analyzes a simple discrete-time
1072 A. Berkelaar, R. Kouwenberg / Journal of Economic Dynamics  Control 27 (2003) 1069–1097
model with labor income for power utility and has to apply numerical techniques to
solve it. As our model is more elaborate and as we additionally want to study more
general objectives than power utility, we clearly need a numerical solution method.
For the computation of the optimal investment policy we apply a dynamic program-
ming algorithm. We add several numerical improvements to the basic algorithm in order
to increase eOciency, including transformation and interpolation of the value function,
which facilitate the solution of investment models with power and HARA-utility. As
we apply dynamic programming, the optimal policies are derived in feedback form and
we acquire direct insight into the structure of the strategies. This paper can be placed
in a growing literature that solves consumption–investment problems numerically in
order to study the impact of relevant, but analytically complicated, issues such as pre-
dictability, transaction costs and parameter uncertainty (Brennan et al., 1997; Balduzzi
and Lynch, 1999; Barberis, 2000).
This paper is organized as follows. In Section 2, we introduce the retirement saving
model and the main assumptions. Moreover, we review the literature and introduce
our implementation of the dynamic programming algorithm. In Section 3, we study the
optimal investment strategies in detail for diGerent investment objectives. We show that
the widely used class of downside-risk measures leads to peculiar investment policies in
a multi-period setting. In Section 4, we study the additional eGect of funding payments
on the investment strategy, while Section 5 considers horizon eGects and the impact of
utility over intertemporal fund value. Section 6 concludes and summarizes the paper.
2. Retirement saving model
2.1. Model de-nition and assumptions
In this section we introduce the model for retirement saving that will be studied in
this paper. We assume that a plan sponsor pays contributions in order to 4nance the
retirement of an employee at time T. The plan sponsor has established an investment
fund with initial wealth Wt at time t = 0 in order to achieve the retirement goal at the
planning horizon T. At the beginning of each period t =0; 1; : : : ; T −1 the plan sponsor
decides either to add a contribution payment of C+
t ¿ 0 to the fund or to extract cash
from the fund C−
t ¿ 0. We represent the net cash:ow into the fund by Ct = C+
t − C−
t .
After the cash in- and out:ows a total amount of (Wt + Ct) is left for investment in
the capital market. There are I + 1 assets available for investment in the economy at
time t, each providing a discretely compounded random return of Ri;t+1 at time t + 1
for i = 0; 1; : : : ; I. Each period the plan sponsor invests a fraction wit of the investment
fund’s wealth into asset i = 1; : : : ; I, while the remaining fraction (1 −
I
i=1 wi
t) is
invested in asset 0.
The investment goal of the plan sponsor is to enable the employee to continue his
consumption habits after retirement. As the employee’s consumption pattern is likely
to be related to his labor income, the plan sponsor considers the employee’s wages
at retirement IT as a benchmark for investments. We assume that the plan sponsor
measures wealth relative to the labor income of the employee and maximizes a utility
A. Berkelaar, R. Kouwenberg / Journal of Economic Dynamics  Control 27 (2003) 1069–1097 1073
function U(FT ; T) over the relative fund value FT = WT =IT at retirement. The function
U(FT ; T) is increasing and concave in the fund value FT .
Additionally, the plan sponsor tries to minimize his contribution payments by max-
imizing the utility function V(−Ct; It; t) over the intertemporal payments Ct for t =
0; 1; : : : ; T − 1. The function V(: ; It; t) is increasing and concave in its 4rst argument.
Higher contribution payments therefore decrease the utility of the plan sponsor and in-
crease the marginal utility of a unit reduction in payments. We formalize the trade-oG
between fund value at retirement and contribution payments in the following retirement
saving (RS) model:
max
wit ;Ct
E0
T−1

t=0
V(−Ct; It; t) + U(WT =IT ; T)

; (1)
s:t: Wt+1 = (Wt + Ct)
 I

i=1
wit(1 + Ri;t+1) +

1 −
I

i=1
wit

(1 + R0;t+1)

;
for t = 0; 1; : : : ; T − 1; (2)
where  ¿ 0 is a parameter in:uencing the relative impact of utility over fund value
FT = WT =IT at retirement T.
The general model for retirement saving needs a more detailed speci4cation for a
meaningful analysis. As a 4rst building block, we will assume that the wage growth
rate t follows a mean-reverting process:
Assumption 1. Labor income It at time t grows with the continuously compounded
wage growth rate t+1; which follows a mean-reverting process
It+1 = Itet+1
= It(1 + t+1); (3)
Qt+1 = ( − t) + t+1; t+1 ∼ IID(0; 2
); (4)
where Qt+1 =t+1 −t; 0 ¡  ¡ 1 is the mean reversion parameter;  is the long run
mean wage growth rate and t+1 is an identically intertemporal independently distributed
(IID) innovation with expectation zero and variance 2
. For ease of exposition we also
de4ne the discrete wage growth rate t+1 = et+1
− 1.
Secondly, we assume that the asset returns are not correlated intertemporally and
imperfectly correlated with the wage growth innovation:
Assumption 2. The joint distribution of the continuously compounded asset returns
ri;t+1 and the wage growth innovation t+1 is equal in each period t = 0; 1; : : : ; T − 1.
The vector of mean asset returns is  = {i}I
i=0 and the covariance matrix is  =
{ij}I
i;j=0. The correlation vector of the asset returns with the wage growth innovation
t+1 is denoted by I = {i}I
i=0. The asset returns are not correlated intertemporally:
Cov(ri;t+1; ri;t) = 0 for t = 0; 1; : : : ; T − 1. The discretely compounded asset return is
de4ned as Ri;t+1 = eri; t+1
− 1.
1074 A. Berkelaar, R. Kouwenberg / Journal of Economic Dynamics  Control 27 (2003) 1069–1097
Assumption 2 implies that there is no direct compensation for wage growth in the
mean of the asset returns, although the returns can still be imperfectly correlated with
the wage growth rate. Consequently, this assumption entails that there is no perfect
hedge for wage in:ation: the -nancial market is incomplete.
Thirdly, we assume that the plan sponsor measures the utility of a contribution
payment Ct relative to employee’s wage income It at time t.
Assumption 3. The utility V over contribution payments is a function of time and the
ratio Ct=It only: V(−Ct; It; t) = H(−Ct=It; t). We de4ne ct = Ct=It as the contribution
rate relative to the employee’s labor income.
Assumption 3 allows us to reduce the state space of the retirement saving problem
from three variables (wealth Wt, income It and wage growth t) to two variables (the
wealth–income ratio Ft and wage growth t). As a result the eGort needed for solving
the model reduces signi4cantly. In our opinion this reduction of complexity makes up
for the slight loss of generality. Moreover, the assumption of utility over contribution
rates is also made by Boender (1997) in a widely used decision support system for
pension funds.
In practice, pension schemes are often categorized as either a de4ned contributions
plan or a de4ned bene4ts plan. We would like to point out that our retirement saving
model can include both schemes as special cases. If we 4x the contribution payments
Ct at a constant non-negative level, then we replicate a de4ned contributions scheme.
The retirement saving model also includes a ‘4nal pay’ de4ned bene4ts scheme, where
the plan sponsor guarantees to pay M times the employee’s labor income at retirement
(i.e. MIT ). 1
In the next sections we will discuss solution methods for the retirement
saving model.
2.2. Dynamic programming and -rst-order conditions
A well-known solution technique for sequential decision problems under uncertainty
is dynamic programming (see Bellman, 1957; Bertsekas, 1976). It is based on the
observation that an optimal policy for the entire sequential decision problem should
also be optimal starting from any given state at a later date. This property is known as
the principle of optimality. Given Assumptions 1–3, we can describe the state of the
retirement fund at time t completely with the relative fund value Ft = Wt=It and the
wage growth rate t. Let the value function J(Ft; t; t) denote the maximum expected
utility obtainable for the plan sponsor starting at time t in state (Ft; t):
J(Ft; t; t) = max
wit ;ct
Et
T−1

j=t
H(cj; j) + U(FT ; T)

; (5)
1 In order to guarantee MIT at retirement, the plan sponsor either has to pay an additional amount of
C+
T = max{0; MIT − WT } or he receives the redundant fund value C−
T = max{0; WT − MIT }. Suppose that
the plan sponsor maximizes a utility function H(cT ; T) over the 4nal contribution rate cT =(MIT −WT )=IT =
M − FT . We can model this equivalently with a utility function U(FT ; T) over 4nal fund value FT , as in
the objective (1) of the retirement saving model.
A. Berkelaar, R. Kouwenberg / Journal of Economic Dynamics  Control 27 (2003) 1069–1097 1075
s:t: Ft+1 = (Ft + ct)
 I

i=1
wit
(1 + Ri;t+1)
(1 + t+1)
+

1 −
I

i=1
wit

(1 + R0;t+1)
(1 + t+1)

for t = 0; 1; : : : ; T − 1: (6)
The plan sponsor’s initial planning problem is de4ned by J(F0; 0; 0). Using the princi-
ple of optimality, the dynamic programming algorithm derives this function recursively
by solving the following sequence of one-period problems:
J(Ft; t; t) = max
wit ;ct
{H(ct; t) + Et[J(Ft+1; t+1; t + 1)]}; (7)
s:t: Ft+1 = (Ft + ct)
 I

i=1
wit
(1 + Ri;t+1)
(1 + t+1)
+

1 −
I

i=1
wit

(1 + R0;t+1)
(1 + t+1)

;
for t = 0; 1; : : : ; T − 1; (8)
where J(FT ; T ; T) = U(FT ; T).
2.3. Implementation of the discretized dynamic programming algorithm
In general, it is not easy to 4nd closed-form expressions for the optimal policies
that maximize (7) and in most cases numerical methods are required. We apply a
numerical solution technique that is based on a discretization of the state space, i.e.
a grid for the values of the state variables Ft and t. For each point on this grid we
solve the dynamic programming equation (7) numerically for the optimal investment
and funding decisions. Note that the required computations easily get out of hand, as
the expectation of next period’s value function has to be integrated numerically. An
additional complicating factor is the curse of dimensionality: the size of the state grid
grows exponentially with the number of state variables.
Our implementation of the discretized dynamic programming algorithm uses four
numerical techniques that increase the eOciency of the method:
1. Variance reduction techniques in order to improve Monte-Carlo simulations.
2. Interpolation of the value function in order to reduce the size of the grid.
3. Transformation of the value function in order to facilitate interpolation methods.
4. Fast numerical optimizations using restarts from neighboring grid points.
More information on the implementation of the algorithm can be found in Appendix
A. The largest model solved in the paper has two state variables (wage growth, fund
value) and 10 periods: we use a three-dimensional grid with 17 × 36 × 11 = 6; 732
points to discretize the state space. The algorithm required 20; 501 s (about 5:7 h) to
solve the problem on a Pentium 200 desktop PC with 64 Mb of memory.
In practice pension funds might want to consider even larger models in order to
add more speci4c details about their planning problem, such as the liabilities and
actuarial risk. The computational requirements for solving a more complex model will
1076 A. Berkelaar, R. Kouwenberg / Journal of Economic Dynamics  Control 27 (2003) 1069–1097
de4nitely increase, however, we would like to point out that the dynamic programming
algorithm is suited very well for parallel computations. Nowadays most companies
have a network of desktop and mainframe computers, which could easily be used for
parallel computations. We refer to Zenios (1999) for a discussion and an overview of
the applications of parallel and high-performance computing in 4nance.
3. Investment policies for retirement saving
3.1. Portfolio separation and liability hedging credits
We try to gain insight in the optimal policies of the retirement saving model by
analysing diGerent parts in isolation. In this section we focus on optimal investment
policies in a model without contribution payments, while in Section 4 we will in-
vestigate the additional eGect of funding decisions. Throughout the following sections
we will assume that the discrete asset returns and the wage growth are log-normally
distributed.
Assumption 4. The joint distribution of the continuously compounded asset returns
ri;t+1 and the wage growth innovation t+1 is multi-variate normal in each period t =
0; 1; : : : ; T − 1; with a constant mean vector and a constant covariance matrix (see
Assumption 2). Consequently; the discrete returns (1 + Ri;t+1) = eri; t+1
and the discrete
wage growth (1 + i;t+1) = et+1
follow a multi-variate log-normal distribution.
We 4rst pay attention to the general structure of the investment strategies. The corre-
lation of the asset returns with the wage growth rate is very important for investments
in the retirement saving model, as it drives the hedging demand for assets against
changes in the wage growth rate. We can observe this in the general fund separation
result of Merton (1971). In order to derive fund separation for our discrete-time re-
tirement saving model we have to apply a linear approximation of the continuously
compounded returns and we have to assume that asset 0 is riskless, leading to the
following result:
w∗
t = −
Et[JF ]
FtEt[JFF ]
−1
( − !r0) +

1 −
Et[JF]
FtE[JFF ]

−1
I; (9)
where w∗
t is the vector of optimal portfolio weights. The proof is omitted to save space,
but available on request from the authors.
The optimal asset weights of the plan sponsor can be separated into a market port-
folio, a hedge portfolio for the wage growth rate and a riskless portfolio. Note that the
second part of the portfolio, involving I, represents the intertemporal hedge against
changes of the wage growth rate. Typically, an investor will increase the weight of an
asset if it has a higher covariance I with the wage growth rate. This eGect is related
to the concept of liability hedging credits, introduced by Sharpe and Tint (1990): the
investor is willing to accept a lower expected return on assets that provide a partial
hedge against changes in the value of the liabilities.
A. Berkelaar, R. Kouwenberg / Journal of Economic Dynamics  Control 27 (2003) 1069–1097 1077
3.2. Hedging demand under constant relative risk aversion
The portfolio separation result holds for any investment objective, but it does not
provide a complete solution as the investment rule depends on the unknown value
function J(Ft; t; t). In order to learn more about the optimal investment strategies we
will 4rst consider the case of constant relative risk aversion. We assume that the plan
sponsor maximizes a power utility function over the relative fund value FT at the
retirement date T:
U(FT ; T) = (1 + )−T 1
#
(FT )#
; (10)
RU
(FT ; T) =
−FT UFF (FT ; T)
UF (FT ; T)
= 1 − #; (11)
where # ¡ 1 is the relative risk aversion coeOcient and  ¿ 0 is the intertemporal
discount factor.
The function RU
(FT ; T) in (11) is the Arrow–Pratt measure of relative risk aversion,
which is constant for power utility. In a simple investment model with one risky asset
and one riskless asset the portfolio weight of the risky asset increases (decreases) as a
function of wealth, if the relative risk aversion is decreasing (increasing) in wealth. An
investor with constant relative risk aversion does not change the risky asset weight.
We can derive a similar result for the retirement saving model with a power utility
function (10) as objective, under the assumption of zero contribution rates ct = 0 for
t = 0; 1; : : : ; T − 1:
dw∗
it
dFt
= 0 and
dw∗
it
dt
= 0 for t = 0; 1; : : : ; T − 1 and i = 0; 1; : : : ; I; (12)
where w∗
it denotes the optimal asset weight for i = 0; 1; : : : ; I. The proof is omitted to
save space, but available on request from the authors.
3.3. Hedging demand under decreasing relative risk aversion
We conclude from (12) that the plan sponsor does not adjust the portfolio weights
if the fund value or the wage growth changes, in the case with a CRRA objective and
without intertemporal contribution payments. We will now study utility functions with
decreasing relative risk aversion (DRRA), in order to investigate whether the optimal
investment strategies are indeed diGerent. We introduce the following class of utility
functions with DRRA, which can be applied in our economy without causing feasibility
problems: 2
U(FT ; T) = (1 + )−T

1
# − p
F−p
T +
%
#

F#
T ; (13)
2 HARA-utility functions with a positive sustenance level  ¿ 0 also have the property of DRRA, however,
we cannot apply them in our incomplete market as they would cause bankruptcy problems (the constraint
Ft ¿  of the HARA-utility function cannot be satis4ed under all circumstances).
1078 A. Berkelaar, R. Kouwenberg / Journal of Economic Dynamics  Control 27 (2003) 1069–1097
0.5 1 1.5 2 2.5 3 3.5
0
0.5
1
1.5
2
2.5
3
3.5
4
4.5
5
Wealth-Income Ratio
Relative
Risk-Aversion
Fig. 1. Relative risk aversion function for DRRA. This 4gure shows the Arrow–Pratt measure of relative
risk aversion (14) of utility function (13) as a function of the wealth–income ratio F, for parameter values
# = −0:5, p = 3 and % = 3.
RU
(F; T) = −FT
UFF (FT ; T)
UF (FT ; T)
=
(1 − # + p) + (1 − #)%Fp
T
1 + %Fp
T
; (14)
where # ¡ 1, p ¿ 0 and % ¿ 0 are constant parameters. It is easy to prove that
UF (FT ; T) ¿ 0, UFF (FT ; T) ¡ 0 and RU
F (FT ; T) ¡ 0 hold: U is a utility function with
DRRA.
If FT is close to zero then the relative risk aversion coeOcient equals (1 − # + p),
while it decreases monotonically to (1 − #) as the fund value increases to in4nity.
Hence, (1 − #) is the minimum relative risk aversion coeOcient, while p measures the
maximum increase in risk aversion that occurs as the investor becomes less wealthy.
Finally, the parameter % determines the rate at which risk aversion decreases from
(1 − # + p) to (1 − #), as wealth grows. Fig. 1 shows a graph of the relative risk
aversion function (14) for the parameter values # = −0:5, p = 3 and % = 3. These
parameter values imply a decrease of relative risk aversion from 4:5 to 1:5.
We would like to investigate the impact of DRRA on optimal investment strate-
gies, however analytical solutions are not readily available under this particular utility
speci4cation and therefore we rely on our numerical method. First, we specify the
coeOcients that will be used in all numerical examples from now on.
Assumption 5. For the numerical cases we consider a retirement fund 10 years before
the retirement date; i.e. T = 10. The discount rate  is 2% per year. The initial wealth
of the fund is W0 = 1 and the initial labor income of the employee is I0 = 1. At the
A. Berkelaar, R. Kouwenberg / Journal of Economic Dynamics  Control 27 (2003) 1069–1097 1079
beginning of each period t=0; 1; : : : ; T −1 the plan sponsor can adjust the asset portfolio
of the retirement fund. Two assets are available for investing; a risky bond and a risky
stock. There is no riskless asset and short selling is not allowed. Consequently; the
asset weights of the bond and the stock are within 0% and 100%. The asset returns
are jointly log-normally distributed with expected returns B =6:8% and S =8:6% for
the bond and the stock; respectively; standard deviations B =5:9% and S =15:7% and
a correlation of BS = +0:38. The long run mean wage growth rate is  = 5:7% ; the
mean reversion parameter equals  = 0:31 and the standard deviation is  = 3%. We
will make speci4c assumptions about the correlation between asset returns and wage
growth later on.
These parameters for the distribution of the asset returns and the wage growth rate
are based on a Dutch yearly dataset from the period 1956–1994 (see Kouwenberg,
2001). We only consider two risky assets in order to facilitate the interpretation of the
results. We now apply the discretized dynamic programming algorithm and solve the
retirement saving model with DRRA numerically:
Case 3.1: We solve the retirement saving model with DRRA utility function (13)
for # = −0:5, p = 3 and % = 3. As a benchmark, we also solve the model with CRRA
objective (10), for # = −0:5 and # = −3:5. In order to distinguish the impact of the
objective we ignore uncertainty about labor income in this example: the wage growth
rate is 4xed at t = 3% annually. We apply the discretized dynamic programming
algorithm on a grid consisting of 36 equally spaced fund values F = 0–3.5 (step size
0:1). Expectations over the return distribution are approximated with 10; 000 simulation
points:
Fig. 2 shows the optimal proportion invested in stocks at time t = 0, as a function
of initial fund value. The investment strategy is clearly myopic for the two constant
relative risk aversion cases # = −0:5 and −3:5, demonstrating the convergence of
the numerical algorithm. With decreasing relative risk aversion the weight of stocks
increases from 28% to 90%. It is clear that this optimal investment strategy can be
explained quite well by the corresponding decreasing relative risk aversion function in
Fig. 1.
We will now additionally investigate the impact of uncertainty about the wage growth
rate. We already know that a plan sponsor with CRRA utility follows a myopic in-
vestment strategy, as there is no substitution between assets in our economy if the
wage growth changes. Note that a change of the wage growth rate does inAuence the
expected fund value. Consequently, we hypothesize that a plan sponsor with DRRA
hedges intertemporally against changes of wage growth, as his investment strategy
is in:uenced by changes in (expected) wealth. We will now demonstrate this eGect
numerically:
Case 3.2: The plan sponsor maximizes DRRA utility function (13) with parameter
values #=−0:5, p=3 and %=3. Additionally, the wage growth rate t is stochastic, with
the parameters speci4ed in Assumption 5. For the correlation between wage growth
and asset returns we consider two cases: 1. bond returns are positively correlated with
wage growth, while stock returns are uncorrelated (B = +1
3 and S = 0) and 2. the
opposite case (B =0 and S =+1
3 ). We apply the discretized dynamic programming
1080 A. Berkelaar, R. Kouwenberg / Journal of Economic Dynamics  Control 27 (2003) 1069–1097
0.5 1 1.5 2 2.5 3 3.5
0
0.2
0.4
0.6
0.8
1
1.2
Wealth-Income Ratio
Fraction
Invested
in
Stocks
Fig. 2. Stock weight for DRRA. This 4gure shows the fraction invested in stocks for constant relative risk
aversion levels # = −3:5 (dotted line) and # = −0:5 (dashed line) and decreasing relative risk aversion
(solid curve). A more risk averse investor dedicates less to stocks (28% for risk aversion level # = −3:5
compared to 90% for risk aversion level # = −0:5). Moreover, decreasing relative risk aversion implies that
the investor desires less exposure to stocks when real wealth drops.
algorithm on a two-dimensional grid for the state variables consisting of 36 equally
spaced fund values F = 0–3:5 (step size 0:1) and 17 wage growth rates  = −0:10–
+0:22 (step size 0:02). Expectations over the return distribution are approximated with
10; 000 simulation points.
Fig. 3 shows the optimal stock proportion at time 0 as a function of fund value
and the initial wage growth rate, in the case that bond returns are positively correlated
with wage in:ation. We observe two major eGects. First, the fraction invested in stocks
increases as the fund value becomes larger: this is the familiar result for DRRA. Second,
an increase in the expected wage growth leads to a larger proportion of bonds in the
portfolio in order to hedge against the expected reduction of future wealth, as we
hypothesized earlier.
Fig. 4 displays the results for the case where stock returns are positively correlated
with the wage growth rate. We clearly observe that the fraction invested in stocks
increases at any level of fund value and wage in:ation, compared to the situation in
Fig. 3. This parallel shift of the investment strategy can be explained by the increased
liability hedging credits of stocks. If we concentrate on the dynamic hedging strategy,
the results in Figs. 3 and 4 are similar: an increase of expected wage growth reduces the
proportion of stocks in the portfolio, regardless of the underlying correlation structure.
A. Berkelaar, R. Kouwenberg / Journal of Economic Dynamics  Control 27 (2003) 1069–1097 1081
0.5
1
1.5
2
2.5
3
3.5
-0.1
-0.05
0
0.05
0.1
0.15
0.2
0
0.2
0.4
0.6
0.8
1
Wealth-Income Ratio
Wage Growth Rate
Fraction
Invested
in
Stocks
Fig. 3. Stock weight for DRRA with stochastic wage growth (S =0 and B =0:33). This 4gure shows the
fraction invested in stocks when returns on bonds are positively correlated with wage growth. The percentage
of stocks in the optimal portfolio slightly decreases for increasing wage growth levels.
0.5
1
1.5
2 2.5
3
3.5
-0.1
-0.05
0
0.05
0.1
0.15
0.2
0
0.2
0.4
0.6
0.8
1
Wealth-Income Ratio
Wage Growth Rate
Fraction
Invested
in
Stocks
Fig. 4. Stock weight for DRRA with stochastic wage growth (S = 0:33 and B = 0). This 4gure shows
the fraction invested in stocks when returns on stocks are positively correlated with wage growth. Compared
to Fig. 3 the graph is shifted only in a parallel way, i.e. the weight increases generally when stock returns
are positively correlated with wage growth. Adjustments of the portfolio as a function of the wage growth
rate are small and comparable to Fig. 3.
1082 A. Berkelaar, R. Kouwenberg / Journal of Economic Dynamics  Control 27 (2003) 1069–1097
3.4. The V-shaped consequences of downside-risk measures
In practice a popular objective is to maximize the expected fund value, subject to a
penalty if wealth drops below the investment benchmark, i.e. a penalty on downside-
risk. Downside-risk measures have been introduced as a substitute for standard risk
measures such as variance, as it seems unreasonable to penalize negative and positive
deviations from the benchmark equally. Popular measures include: shortfall probability,
expected shortfall and semivariance (see Bawa and Lindenberg, 1977).
In this section we study the optimal investment strategy if the plan sponsor maxi-
mizes the expected fund value at retirement, subject to a quadratic penalty if he fails
to outperform the investment benchmark (i.e. if FT ¡ 1)
max
wit
E0[U(FT ; T)] =
1
(1 + )T
	
E0[FT ] − 'E0


min{0; 1 − FT }2
; (15)
where U(FT ; T) = (1 + )−T
	
FT − ' min{0; 1 − FT }2
and ' ¿ 0 is a constant risk
aversion parameter.
In the normative ALM literature for pension funds the downside-risk concept is
highly successful and seems to have replaced traditional utility functions. Investors
that try to meet their liabilities usually apply a threshold of 1 for the funding ratio, i.e.
the ratio of assets to liabilities. Even regulating authorities nowadays advocate the use
of downside-risk measures to improve the solvency of institutional investors. Not much
attention has been paid, however, to the optimal investment strategies for downside-risk
objectives in a multi-period model.
Downside-risk averse investors can be considered as expected utility maximizers with
a risk-neutral (linear) utility function above the threshold FT = 1 and a utility function
with increasing relative risk aversion (IRRA) below the threshold. The eGect of IRRA
below the threshold might be gambling behavior: a decrease of wealth increases the
portfolio weight of stocks. Furthermore, risk-neutrality above the threshold should lead
to a strong increase in the demand for stocks.
Consequently, in a two-asset economy we expect a V-shaped 4gure if we draw the
optimal stock weight as a function of fund value Ft. We will now solve the retirement
saving model numerically in order to investigate these eGects.
Case 3.3: We solve the retirement saving model with downside-risk objective (15)
for risk aversion values ' = 16 and 64. In order to distinguish the impact of the
investment objective clearly we ignore uncertainty about labor income: the wage growth
rate is 4xed at t =3%. We apply the discretized dynamic programming algorithm on a
grid consisting of 36 equally spaced fund values F =0–3.5 (step size 0:1). Expectations
over the return distributions are approximated with 10,000 simulation points.
Fig. 5 shows the optimal initial weight of stocks for risk aversion levels '=16 and 64.
The optimal investment strategy has a clear V-shape: at low wealth levels the weight of
stocks decreases, while it increases at higher wealth levels. We 4nd equivalent results
for other downside-risk measures such as expected shortfall and shortfall probability,
which have a similar relative risk aversion function. Given the widespread acceptance
of downside-risk measures it is questionable whether investors are fully aware of the
accompanying gambling behavior at low wealth levels.
A. Berkelaar, R. Kouwenberg / Journal of Economic Dynamics  Control 27 (2003) 1069–1097 1083
0.2 0.4 0.6 0.8 1 1.2 1.4 1.6
0
0.2
0.4
0.6
0.8
1
1.2
Fraction
Invested
in
Stocks
Wealth-Income Ratio
Fig. 5. Stock weight for downside-risk objective. This 4gure shows the fraction invested in stocks at time
t = 0 as a function of the wealth–income ratio for risk aversion parameters ' = 16 (solid curve) and ' = 64
(dotted line). Note that the investor cannot dedicate more than 100% to stocks due to a borrowing constraint.
4. Consumption and funding decisions
4.1. The eEect of a -xed funding payment
In the previous section we have ignored contribution payments by the plan sponsor,
while we focused on optimal investment strategies for the retirement saving model. In
this section we study the additional eGect of funding payments. As a 4rst example, we
consider the impact of a 4xed non-negative contribution payment.
Case 4.1: We solve the retirement saving model with a 4xed contribution rate
ct = 0:05 for t = 0; 1; : : : ; T − 1. The utility over fund value at retirement is CRRA
(10) with # = −3:5, −2 and −0:5. We ignore uncertainty about labor income in this
example: the wage growth rate is 4xed at t =3% annually. The grid of the discretized
dynamic programming algorithm consists of 36 equally spaced fund values F = 0–3:5
(step size 0:1) and the return distributions are approximated with 10; 000 simulation
points.
Fig. 6 displays the optimal investment strategy at time t = 0 for the three levels
of risk aversion. Due to the contribution payments, the portfolio weight of stocks is
decreasing as a function of fund value for # = −2 and −3:5 and the weight is always
1084 A. Berkelaar, R. Kouwenberg / Journal of Economic Dynamics  Control 27 (2003) 1069–1097
0.5 1 1.5 2 2.5 3 3.5
0
0.2
0.4
0.6
0.8
1
1.2
Wealth-Income Ratio
Fraction
Invested
in
Stocks
Fig. 6. Stock weight for CRRA with 4xed contribution rates. The 4gure shows the stock weight at time
t = 0 for power-utility with risk aversion # = −0:5 (dashed line), # = −2 (solid line) and # = −3:5 (dotted
line), with a 4xed contribution rate of ct = 0:05 for t = 0; 1; : : : ; T − 1. Due to the 4xed contribution rate the
portfolio weight of stocks increases at low levels of fund value (wealth-to-income ratio).
at the upper bound for # =−0:5. The plan sponsor appreciates the 4xed payment more
at low fund values than at high fund values (i.e. marginal utility of the contribution
payment decreases). Poor returns on investments therefore have less impact on utility
at low fund levels than at high fund values, which explains the decreasing optimal
portfolio weight of stocks for # = −2 and −3:5.
4.2. The eEect of optimal dynamic funding payments
We will now study the case where the plan sponsor can change the contribution
payments intertemporally. Clearly, the plan sponsor has to make a trade-oG between
low contribution payments and high fund values at retirement. Given Assumption 3,
we formalize this as a trade-oG between the utility H(ct; t) of contribution rates ct and
the utility U(FT ; T) of fund value at retirement.
A widely used and intuitively attractive way for modelling preferences over contri-
bution payments is to minimize the expected net present value. In our framework this
can be speci4ed as H(−ct; t) = −ct=(1 + )t
, subject to the 4xed bounds c 6 ct 6 U
c.
Note, however, that the optimal contribution rate c∗
t for this objective is always at the
lower or upper bound: c∗
t = c or c∗
t = U
c. Hence, minimizing the net present value of
contribution payments will lead to a rather peculiar optimal strategy for setting the
contribution rates (called a “bang-bang” strategy).
A. Berkelaar, R. Kouwenberg / Journal of Economic Dynamics  Control 27 (2003) 1069–1097 1085
0.5 1 1.5 2 2.5 3 3.5
0
0.2
0.4
0.6
0.8
1
1.2
Wealth-Income Ratio
Fraction
Invested
in
Stocks
Fig. 7. Stock weight with HARA-utility over contribution rates. The 4gure shows the fraction invested in
stocks at time t = 0 for power-utility with # = −2 over fund value and HARA-utility over contribution rates
with ( = −2:5 (dashed line), −2 (solid line) and −1:5 (dotted line). The weight of stock increases to the
upper bound 100% at low levels of fund value, due to the increasing marginal value of the contribution
payment.
Instead of the net present value rule, we presume that the plan sponsor maxi-
mizes a HARA-utility (16) over the contribution rates, as it enforces a positive upper
bound U
c ¿ 0 on ct:
H(−ct; t) =
1 − (
(

−ct + U
c
(1 − ()
(
; −∞ 6 ct ¡ U
c; (16)
where ( ¡ 1 is the risk aversion coeOcient and U
c ¿ 0 is the upper bound of the con-
tribution rate.
Note that the HARA-utility function H(−ct; t) is increasing and concave in its 4rst
argument and moreover it has the property of increasing relative risk aversion (IRRA).
We will investigate in Case 4.2 whether this property in:uences the investment strategy.
Case 4.2: We solve the retirement saving model with HARA-utility (16) for contribu-
tion rates, with risk aversion parameters ( = −1:5,−2 and −2:5 and upper
bound U
c = 0:1. The utility function over fund value at retirement is CRRA with
# = −2. The trade-oG parameter between utility over contribution rates and fund value
is  = 250; 000. A high value of  is required to make sure that contribution rates are
positive at low fund values Ft 6 1. This is due to the fact that the utility function
H(−ct; t) approaches minus in4nity very fast between 0 and the upper bound U
c = 0:1.
Fig. 8 displays the optimal contribution rate ct at time t = 0 as a function of initial
fund value Ft, for the cases ( = −1:5, −2 and −2:5. The optimal contribution rates
1086 A. Berkelaar, R. Kouwenberg / Journal of Economic Dynamics  Control 27 (2003) 1069–1097
0.5 1 1.5 2 2.5 3 3.5
-0.2
-0.1
0
0.1
Wealth-Income Ratio
Contribution
Rate
Fig. 8. Contribution rates with HARA-utility. The 4gure shows the contribution rate at time t = 0 for
power-utility with # = −2 over fund value and HARA-utility over contribution rates with ( = −2:5 (dashed
line), −2 (solid line) and −1:5 (dotted line). The contribution rates decrease approximately linear as a
function of fund value.
are decreasing linearly as functions of fund value, while higher risk aversion ( over
contribution rates leads to lower rates. Fig. 7 shows the investment strategy at time
t = 0 and we 4nd the same decreasing stock weight pattern as in the case of a 4xed
contribution rate (see Fig. 6), although more pronounced. Hence, also in the case of an
optimal dynamic contribution rule we 4nd that contribution payments lead to increased
risk taking at low levels of fund value.
4.3. A lower bound on the funding policy
In practice the contribution rate might be constrained by explicit restrictions (see
Boender, 1997). The HARA-function (16) naturally imposes an upper bound on the
funding payment as marginal utility approaches −∞ near the level U
c. We now consider
the additional eGect of a lower bound on funding payments (ct ¿ c), which we enforce
in the implementation of the discretized dynamic programming algorithm.
Case 4.3: We solve the problem of Case 4.2 again, with the addition of a lower
bound c = 0 on funding payments (i.e. the plan sponsor cannot extract cash from the
fund). The upper bound equals U
c = 0:1 and the risk aversion coeOcients of the utility
functions H(ct; t) and U(FT ; T) are ( = −2 and # = −2.
With an additional lower bound the optimal contribution rate is decreasing linearly
as a function of the fund value until it hits the lower bound c = 0 at F0 = 1:5 and
from thereon it remains constant. In contrast to this predictable result, the optimal
A. Berkelaar, R. Kouwenberg / Journal of Economic Dynamics  Control 27 (2003) 1069–1097 1087
0.5 1 1.5 2 2.5 3 3.5
0
0.2
0.4
0.6
0.8
1
1.2
Wealth-Income Ratio
Fraction
Invested
in
Stocks
Fig. 9. Stock weight for CRRA with a lower bound on funding payments. This 4gure shows the fraction
invested in stocks with lower bound c = 0 on contribution rates. The upward part of the smile is due to the
lower bound on funding payments, which provide a cushion against losses.
investment strategy displayed in Fig. 9 is more surprising. The stock weight 4rst
decreases to a minimum around F0 = 1:9 and from this point onwards it starts to
rise, up to 100%. The increasing stock weight trend in the right side of the graph
can be interpreted as a gambling policy: the potential losses of stocks become less
important as the funding payment is stuck at an involuntary ‘high’ level (provid-
ing a cushion for possible losses), while the potential gains of stocks remain the
same.
4.4. The plan sponsor takes what the plan sponsor gives
Another interesting constraint on the funding policy is one induced by a maximum
allowable level of the fund value. Suppose that the plan sponsor decides that the
value of the retirement fund should never exceed U
F times the labor income of the
employee, as this fund value is considered suOcient to provide a good retirement
income. Consequently, if the fund value Ft exceeds the ‘saturation’ level U
F, then the
plan sponsor extracts cash from the fund (i.e. ct ¡ 0) in order to reduce the fund value
back to U
F.
Case 4.4: We consider Case 4.2, with the addition of a maximum fund level at U
F=2.
The risk aversion coeOcients are #=(=−2 and the upper bound for contribution rates
is U
c = 0:1.
1088 A. Berkelaar, R. Kouwenberg / Journal of Economic Dynamics  Control 27 (2003) 1069–1097
0.5 1 1.5 2 2.5 3 3.5
0
0.2
0.4
0.6
0.8
1
1.2
Wealth-Income Ratio
Fraction
Invested
in
Stocks
Fig. 10. Stock weight for CRRA with an upper bound on fund value. This 4gure shows the fraction invested
in stocks with an upper bound U
F =2 on fund values, enforced with negative contribution rates (i.e. refunds).
Beyond the maximum allowed fund value U
F = 2 the stock weight becomes constant at a low level.
The optimal funding policy in this case is piecewise linear: at fund values above U
F=2
the plan sponsor extract large amounts of cash from the fund. The eGect on the optimal
investment strategy is depicted in Fig. 10. For low fund values the optimal stock weight
is decreasing and it remains at the minimum of 12% for fund values above U
F = 2. As
a consequence of the maximum fund level, the plan sponsor drastically reduces stock
exposure at wealthy fund values. The gains of investing in stocks at high fund values
are reduced by refunds, while the losses of investing in stocks still loom as large as
before.
According to the optimal investment policy in Fig. 10, plan sponsors that would like
to take the excess surplus out of the pension fund in good years should also make
a shift to a more conservative investment policy once the optimal wealth target is
reached.
5. Horizon eects and intertemporal utility over fund value
5.1. Horizon eEects
So far we have displayed the optimal investment and contribution strategy at time
t = 0. We now study to what extent the optimal strategies change as the retirement
date T approaches. In the case of CRRA over fund value and without contribution
payments, the asset weights are constant through time. For DRRA, Fig. 11 shows the
A. Berkelaar, R. Kouwenberg / Journal of Economic Dynamics  Control 27 (2003) 1069–1097 1089
0.5 1 1.5 2 2.5 3 3.5
0
0.2
0.4
0.6
0.8
1
1.2
Wealth-Income Ratio
Fraction
Invested
in
Stocks
Fig. 11. Stock weight at time t = 9; 4 and 0 for DRRA utility. The 4gure shows the fraction invested in
stocks for diGerent investment horizons, given DRRA utility with parameter values #=−0:5, p=3 and %=3.
The dotted line represents the optimal fraction with only 1 year left (t = 9). The dashed line correspond to
an intermediate period (t = 4) and the solid line represents the initial portfolio choice (t = 0).
optimal investment strategy at times t = 9; 4 and 0 (based on Case 3.1). We 4nd that
the weight of stocks increases with the investment horizon for fund levels between
F = 0:4 and 2, although the horizon eGect is rather small.
In the case of a 4xed contribution rate horizon eGects are even present for a CRRA
investor. Fig. 12 shows the optimal stock weight at times t = 9; 4 and 0, for a CRRA
objective with a 4xed contribution rate ct = 0:05 for t = 0; 1; : : : ; T − 1 (based on Case
4.1). One period before retirement (t = 9) the investment strategy is still constant,
while we observe a drastic increase of the stock weight at low fund values for longer
investment horizons (t = 4 and 0).
With optimal dynamic contribution rates based on HARA-utility (16), the horizon
eGect in the investment strategy is very similar to the 4xed payment case in Fig.
12. Fig. 13 shows the optimal dynamic decision rules for setting contributions at
times t = 9; 4 and 0, for a HARA-utility function over contribution rates with ( = −2
and U
c=0:1 and a CRRA utility function over fund values. We 4nd that the contribution
rates tend to increase as we move closer to the retirement date.
5.2. The eEects of intertemporal utility over fund value
Previous results demonstrate that the payment of intertemporal contributions to the
retirement fund has a peculiar eGect on the optimal investment strategy: the plan
1090 A. Berkelaar, R. Kouwenberg / Journal of Economic Dynamics  Control 27 (2003) 1069–1097
0.5 1 1.5 2 2.5 3 3.5
0
0.2
0.4
0.6
0.8
1
1.2
Wealth-Income Ratio
Fraction
Invested
in
Stocks
Fig. 12. Stock weight at time t = 9; 4 and 0 for CRRA utility, with a 4xed contribution rate. The 4gure
shows the fraction invested in stocks for diGerent investment horizons, given CRRA utility with risk aversion
# = −2 and a 4xed contribution rate ct = 0:05 for t = 0; 1; : : : ; T − 1. The dotted line represents the optimal
fraction with only one year left (t = 9). The dashed line corresponds to an intermediate period (t = 4) and
the solid line represents the initial portfolio choice (t = 0).
sponsor increases the weight of stocks as the fund level decreases. Moreover, the gam-
bling eGect becomes worse for longer investment horizons. Note that this investment
policy might be considered impudent, most notably in the case of a de4ned bene4ts
pension scheme.
We will now demonstrate that the propensity to gamble can be reduced considerably
if the plan sponsor cares about intertemporal fund values Ft at times t = 1; 2; : : : ; T − 1
before the planning horizon T. We 4rst introduce the following objective for the plan
sponsor, with intertemporal utility over fund values:
max
wit ;ct
E0
T−1

t=0
H(ct; t) + 
T

t=1
U(Ft; t)

: (17)
One might argue that it is not rational for the plan sponsor to worry about fund
value before the actual retirement date T. Note, however, that many pension funds
are monitored by regulatory authorities, in order to keep intertemporal fund values
above prespeci4ed values. These regulations are often applied to de4ned bene4ts pen-
sion plans, where the plan sponsor has made a promise to pay a certain amount at
retirement.
In the next case we calculate investment strategies for the objective function
above.
A. Berkelaar, R. Kouwenberg / Journal of Economic Dynamics  Control 27 (2003) 1069–1097 1091
0.5 1 1.5 2 2.5 3 3.5
-0.1
-0.08
-0.06
-0.04
-0.02
0
0.02
0.04
0.06
0.08
0.1
Wealth-Income Ratio
Contribution
Rate
Fig. 13. Contribution rate at time t =9; 4 and 0, with HARA utility over contribution rates. The 4gure shows
the contribution rate for diGerent investment horizons, given CRRA utility with risk aversion # = −2 and
HARA-utility over contribution rates with ( = −2. The dotted line represents the optimal contribution rate
with only one year left (t = 9). The dashed line corresponds to an intermediate period (t = 4) and the solid
line represents the initial portfolio choice (t = 0).
Case 5.1: We solve the retirement saving model with CRRA utility over fund values,
measured intertemporally according to (17), with # = −2. The utility function over
contribution rates is HARA (16), with risk aversion parameters ( = −2 and upper
bound U
c = 0:1. The trade-oG parameter between utility over contribution rates and fund
value is  = 250; 000. We choose this value for  to make sure that contribution rate
is positive for funding levels F ¡ 1.
Figs. 14 and 15 show the optimal investment and contribution policy. From Fig. 14
it is clear that the optimal weight of stocks is still slightly higher at low fund levels,
however, the eGect has reduced considerably and it cannot be considered a gambling
strategy anymore. Fig. 15 is also interesting, as it shows that the horizon eGect for the
contribution rates has reversed: as the retirement date T gets nearer, the plan sponsor
pays less contributions. We conclude that a focus on fund value before the retirement
date can greatly reduce the gambling behavior induced by contribution payments.
6. Conclusions
In this paper we studied a retirement saving model with labor income as a bench-
mark for investments and contribution payments by the plan sponsor. Due to mar-
ket incompleteness it is very hard to derive closed-form solutions for the optimal
1092 A. Berkelaar, R. Kouwenberg / Journal of Economic Dynamics  Control 27 (2003) 1069–1097
0.5 1 1.5 2 2.5 3 3.5
0
0.2
0.4
0.6
0.8
1
1.2
Wealth-Income Ratio
Fraction
Invested
in
Stocks
Fig. 14. Stock weight at time t = 9; 4 and 0, with intertemporal utility over fund value. The 4gure shows
the fraction invested in stocks for diGerent investment horizons, given intertemporal measurement of CRRA
utility over fund values with risk aversion # = −2 and HARA-utility over contribution rates with ( = −2.
The dotted line represents the optimal fraction with only one year left (t = 9). The dashed line corresponds
to an intermediate period (t = 4) and the solid line represents the initial portfolio choice (t = 0).
investment and contribution policies of the plan sponsor. We used an eOcient imple-
mentation of the dynamic programming algorithm in order to solve the problem nu-
merically. The main conclusions of our analysis and computational experiments are as
follows:
1. Regardless of his utility function, the plan sponsor invests in a hedge portfo-
lio against random :uctuations of the employee’s labor income. The hedge port-
folio depends on the covariance of the asset returns with the wage growth rate.
The numerical results demonstrate that the correlation between asset returns and
wage growth has a substantial in:uence on portfolio composition. Dynamic adjust-
ments of the hedging strategy due to changes of the wage growth rate are relatively
small.
2. Contribution payments change the optimal investment strategy considerably, even for
a plan sponsor with constant relative risk aversion over fund value. The portfolio
weights are no longer constant and there is a strong tendency to gamble at low
levels of wealth. We also 4nd that contribution payments lead to a investment
horizon eGect. Moreover, additional constraints on the funding policy can have a
large impact on the optimal investment strategy.
3. If a plan sponsor maximizes the expected fund value subject to a penalty on
downside-risk, then the optimal weight of risky assets in the portfolio increases
A. Berkelaar, R. Kouwenberg / Journal of Economic Dynamics  Control 27 (2003) 1069–1097 1093
0.5 1 1.5 2 2.5 3 3.5
-0.1
-0.08
-0.06
-0.04
-0.02
0
0.02
0.04
0.06
0.08
0.1
Wealth-Income Ratio
Contribution
Rate
Fig. 15. Contribution rate at time t =9; 4 and 0, with intertemporal utility over fund value. The 4gure shows
the optimal contribution rate for diGerent investment horizons, given intertemporal measurement of CRRA
utility over fund values with risk aversion # = −2 and HARA-utility over contribution rates with ( = −2.
The dotted line represents t = 9, the dashed line corresponds to t = 4 and the solid line represents the initial
portfolio choice at t = 0.
at low levels of wealth. The gambling policy can be attributed to the increasing
relative risk aversion property of the downside-risk measure.
4. Intertemporal measurement of utility over wealth can reduce gambling eGects.
The insights gained through the numerical computations in this paper may aid fund-
managers to formulate dynamic policies and choose reasonable investment objectives.
Furthermore, the decision rules derived here could be applied in simulation-based mod-
els for asset–liability management, where additional market imperfections such as trans-
action costs and position limits can be taken into account.
Appendix A. Implementation of the dynamic programming algorithm
We apply Monte-Carlo simulation to calculate expectations over the return distribu-
tions in Eq. (7), with an additional variance reduction technique to reduce the approxi-
mation error of the simulation method. We employ the method of antithetic sampling to
replicate the mean of the underlying asset return distributions. Additionally we rescale
the entire sample of returns in order to 4t the variance of the returns exactly.
The implementation of the dynamic programming algorithm uses a discretization of
the state space, i.e. a grid for the values of Ft and t. Note that each simulated drawing
1094 A. Berkelaar, R. Kouwenberg / Journal of Economic Dynamics  Control 27 (2003) 1069–1097
from the distribution of the state variables tends to lie in between the points on the
grid at time t + 1. In order to calculate the expectation at time t of the value function
at time t + 1 in Eq. (7) we apply interpolation methods.
First, we consider the cases without stochastic wage growth. Let n = 0; 1; : : : ; N
represent the points on the grid for the fund value F (wealth-to-income ratio), with a
4xed step size of +F between the N +1 points and minimum fund value F. Let J(n; t)
denote the value function in point n = 0; 1; : : : ; N on the grid at time t = 0; 1; : : : ; T.
Suppose that we are at time t in the dynamic programming algorithm and want to
know the value function at F∗
at time t + 1 (in order to approximate the expectation
of the value function numerically). Let n∗
denote the point on the grid with fund value
closest to F∗
: n∗
= (F∗
− F)=+F . We apply interpolation with points surrounding
n∗
, as F∗
tends to lie in between the available fund values F + n+F on the grid for
n=0; 1; : : : ; N. Moreover, in some cases F∗
is larger than the maximum fund value on
the grid (F∗
¿ F + N+F ) and then we apply extrapolation.
In order to facilitate both interpolation and extrapolation for utility functions with
a vertical asymptote, we 4rst transform the value-function: y(n; t) = H(J(n; t)), where
H(:) is an invertible transformation function. The goal of the transformation is to get
rid of the asymptote at low fund values near F (in order to improve the quality of
interpolation) and to get a roughly linear function at high fund values (in order to
improve the quality of extrapolation).
Note that the utility function U(FT ; T) over fund value at retirement is crucial for
the asymptote of the value function and not the utility function over contribution rates
H(ct; t). As the plan sponsor controls the contribution rate ct, he will never let the
utility function over contribution rates go to minus in4nity at a faster rate than the value
function itself (at low levels of wealth F → F). Below is a list of the transformations
applied for the cases studied in the paper:
1. Power and DRRA utility over fund values, see the speci4cation in (13):
y(n; t) = J(n; t)1=(#−p)
for n+F 6 0:5 and y(n; t) = J(n; t)1=#
for n+F ¿ 0:5:
2. Expected fund value subject to a downside-risk penalty, see the speci4cation
in (15):
no transformation required (no vertical asymptote).
Before we interpolate or extrapolate the transformed value function we would like to
know its shape near F∗
. Therefore, we estimate the scaled second derivative of the
transformed value function. Let Qy(n; t + 1) denote a numerical estimate for the 4rst
derivative of y(n; t +1) at time t +1 with respect to fund value F, while Q2
y(n; t +1)
is a numerical estimate of the second derivative of the transformed value function. 3
3 We use a mid-point formula to calculate numerical estimates for the points n = 2; 3; : : : ; N − 2. For the
points on the edge of the grid, n=0; 1 and n=N −1; N, we use a one-sided approximation of the derivatives
(see Press et al., 1989).
A. Berkelaar, R. Kouwenberg / Journal of Economic Dynamics  Control 27 (2003) 1069–1097 1095
The estimate of the scaled second derivative (absolute risk aversion) is
z(n; t + 1) =
Q2
y(n; t + 1)
Qy(n; t + 1)
for n = 0; 1; : : : ; N:
Depending on the magnitude of the scaled second derivative we choose an interpolation
method. Interpolation with a local rational polynomial is a good method for nearly any
function, even with an asymptote (see Press et al., 1989), however, it is rather slow.
If we know that the value function is locally linear then we rather apply a fast linear
interpolation scheme with two points. Moreover, if the value function has an abrupt
change in the second derivative due to a ‘break’ (as in the case of downside-risk
measures near the threshold) it is safer to apply linear interpolation.
We use a decision rule for choosing the interpolation method. Extensive numerical
testing of eOciency and reliability resulted in the following speci4cation:
1. Power and DRRA utility over fund values:
If F∗
¿ F + N+F then we apply linear extrapolation with 2 points.
If |z(n∗
; t + 1)| ¿ 4:5 then we apply rational interpolation with 10 points.
If 0:5 ¡ |z(n∗
; t + 1)| 6 4:5 then we apply polynomial interpolation with 4 points.
If |z(n∗
; t + 1)| 6 0:5 then we apply linear interpolation with 2 points.
2. Expected fund value subject to a downside-risk penalty:
If F∗
¿ F + N+F then we apply linear extrapolation with 2 points.
If F∗
¡ 0:9 and |z(n∗
; t + 1)| ¿ 0:5 then we apply polynomial interpolation with 4
points.
In other cases we apply linear interpolation.
After applying the interpolation or extrapolation above, we obtain y∗
as an estimate
of the transformed value function in the point F∗
. As a last step, we use the inverse
transformation H−1
(y∗
)=J∗
, to get the required estimate of the original value function
in the point F∗
.
Finally, if we additionally consider mean-reverting wage growth rates then the state
space grid becomes two-dimensional. In the wage growth dimension we use linear
interpolation with two points, as there are no problems with asymptotes or abrupt
changes of the value function. We apply the transformation and interpolation methods
as described previously in the fund value dimension.
In order to 4nd the optimal 4nd the optimal policies that maximize the dynamic pro-
gramming Eq. (7), we exploit Powell’s method (Press et al., 1989). The computation-
times can be cut drastically by using the optimal policy of a neighboring grid point
as initial guess for the optimization method. Note that Powell’s method does not ex-
plicitly handle bounds on the decision variables. However, we can still impose lower
and upper bounds on the variables by simple transformations with an exponential or
arctangent function.
Our implementation of the discretized dynamic programming algorithm converges to
the optimal solution, given a number of mild continuity assumptions about the utility
functions. Convergence in this context means that the numerical approximation of the
value function at time t =0 will get arbitrarily close to the actual value function, as the

More Related Content

What's hot

HowActuariescanuseFinancialEconomics
HowActuariescanuseFinancialEconomicsHowActuariescanuseFinancialEconomics
HowActuariescanuseFinancialEconomicsAndrew Smith
 
Expected value return & standard deviation
Expected value return & standard deviationExpected value return & standard deviation
Expected value return & standard deviationJahanzeb Memon
 
Investment Management Risk and Return
Investment Management Risk and ReturnInvestment Management Risk and Return
Investment Management Risk and ReturnDr. John V. Padua
 
Financial Economics Essay Maxwell Mayhew 2015
Financial Economics Essay Maxwell Mayhew 2015Financial Economics Essay Maxwell Mayhew 2015
Financial Economics Essay Maxwell Mayhew 2015Max Mayhew
 
Risk returns analysis
Risk returns analysisRisk returns analysis
Risk returns analysisJoseph Ukpong
 
Portfolio risk and retun project
Portfolio risk and retun projectPortfolio risk and retun project
Portfolio risk and retun projectRohit Sethi
 
Nominal & effective Interest Rates
Nominal & effective Interest RatesNominal & effective Interest Rates
Nominal & effective Interest RatesNzar Braim
 
Chapter7 an introduction to risk and return
Chapter7 an introduction to risk and returnChapter7 an introduction to risk and return
Chapter7 an introduction to risk and returnRodel Falculan
 
2010 09 the empirical law of active management
2010 09 the empirical law of active management2010 09 the empirical law of active management
2010 09 the empirical law of active managementbfmresearch
 
Business Finance Chapter 11 Risk and return
Business Finance Chapter 11 Risk and returnBusiness Finance Chapter 11 Risk and return
Business Finance Chapter 11 Risk and returnTinku Kumar
 
IAQF report_Cornell Team
IAQF report_Cornell TeamIAQF report_Cornell Team
IAQF report_Cornell TeamJin Li
 
Security Analysis and Portfolio Management
Security Analysis and Portfolio ManagementSecurity Analysis and Portfolio Management
Security Analysis and Portfolio ManagementShrey Sao
 
Usse average internal rate of return (airr), don't use internal rate of retur...
Usse average internal rate of return (airr), don't use internal rate of retur...Usse average internal rate of return (airr), don't use internal rate of retur...
Usse average internal rate of return (airr), don't use internal rate of retur...Futurum2
 
Chapter 08 Risk & Return
Chapter 08 Risk & ReturnChapter 08 Risk & Return
Chapter 08 Risk & ReturnAlamgir Alwani
 
“Over” and “Under” Valued Financial Institutions: Evidence from a “Fair-Value...
“Over” and “Under” Valued Financial Institutions: Evidence from a “Fair-Value...“Over” and “Under” Valued Financial Institutions: Evidence from a “Fair-Value...
“Over” and “Under” Valued Financial Institutions: Evidence from a “Fair-Value...Ilias Lekkos
 

What's hot (18)

Ch 04
Ch 04Ch 04
Ch 04
 
HowActuariescanuseFinancialEconomics
HowActuariescanuseFinancialEconomicsHowActuariescanuseFinancialEconomics
HowActuariescanuseFinancialEconomics
 
Expected value return & standard deviation
Expected value return & standard deviationExpected value return & standard deviation
Expected value return & standard deviation
 
Investment Management Risk and Return
Investment Management Risk and ReturnInvestment Management Risk and Return
Investment Management Risk and Return
 
Financial Economics Essay Maxwell Mayhew 2015
Financial Economics Essay Maxwell Mayhew 2015Financial Economics Essay Maxwell Mayhew 2015
Financial Economics Essay Maxwell Mayhew 2015
 
Chapter 5
Chapter 5Chapter 5
Chapter 5
 
Risk returns analysis
Risk returns analysisRisk returns analysis
Risk returns analysis
 
Portfolio risk and retun project
Portfolio risk and retun projectPortfolio risk and retun project
Portfolio risk and retun project
 
Nominal & effective Interest Rates
Nominal & effective Interest RatesNominal & effective Interest Rates
Nominal & effective Interest Rates
 
Chapter7 an introduction to risk and return
Chapter7 an introduction to risk and returnChapter7 an introduction to risk and return
Chapter7 an introduction to risk and return
 
2010 09 the empirical law of active management
2010 09 the empirical law of active management2010 09 the empirical law of active management
2010 09 the empirical law of active management
 
Business Finance Chapter 11 Risk and return
Business Finance Chapter 11 Risk and returnBusiness Finance Chapter 11 Risk and return
Business Finance Chapter 11 Risk and return
 
IAQF report_Cornell Team
IAQF report_Cornell TeamIAQF report_Cornell Team
IAQF report_Cornell Team
 
Security Analysis and Portfolio Management
Security Analysis and Portfolio ManagementSecurity Analysis and Portfolio Management
Security Analysis and Portfolio Management
 
Usse average internal rate of return (airr), don't use internal rate of retur...
Usse average internal rate of return (airr), don't use internal rate of retur...Usse average internal rate of return (airr), don't use internal rate of retur...
Usse average internal rate of return (airr), don't use internal rate of retur...
 
Chapter 08 Risk & Return
Chapter 08 Risk & ReturnChapter 08 Risk & Return
Chapter 08 Risk & Return
 
6. risk and return
6. risk and return6. risk and return
6. risk and return
 
“Over” and “Under” Valued Financial Institutions: Evidence from a “Fair-Value...
“Over” and “Under” Valued Financial Institutions: Evidence from a “Fair-Value...“Over” and “Under” Valued Financial Institutions: Evidence from a “Fair-Value...
“Over” and “Under” Valued Financial Institutions: Evidence from a “Fair-Value...
 

Similar to Retirement saving with contribution payments and labor income as a benchmark for investments

2012 01-bis-the sustainability of pension schemes
2012 01-bis-the sustainability of pension schemes2012 01-bis-the sustainability of pension schemes
2012 01-bis-the sustainability of pension schemesJean-Baptiste Pethe
 
Scenario generation and stochastic programming models for asset liabiltiy man...
Scenario generation and stochastic programming models for asset liabiltiy man...Scenario generation and stochastic programming models for asset liabiltiy man...
Scenario generation and stochastic programming models for asset liabiltiy man...Nicha Tatsaneeyapan
 
Rudebusch Lopez Christensen
Rudebusch Lopez ChristensenRudebusch Lopez Christensen
Rudebusch Lopez ChristensenPeter Ho
 
Outline March 2014
Outline March 2014Outline March 2014
Outline March 2014Redington
 
Market Theory, Capital Asset Pricing Model
Market Theory, Capital Asset Pricing ModelMarket Theory, Capital Asset Pricing Model
Market Theory, Capital Asset Pricing ModelKatie Gulley
 
· Respond to 3 posts listed below. Advance the conversation; provi.docx
· Respond to 3 posts listed below. Advance the conversation; provi.docx· Respond to 3 posts listed below. Advance the conversation; provi.docx
· Respond to 3 posts listed below. Advance the conversation; provi.docxLynellBull52
 
Gust Lopez Salido
Gust Lopez SalidoGust Lopez Salido
Gust Lopez SalidoPeter Ho
 
Capital Budegting.pdf
Capital Budegting.pdfCapital Budegting.pdf
Capital Budegting.pdfsauravjain15
 
Accounting Research Center, Booth School of Business, Universi.docx
Accounting Research Center, Booth School of Business, Universi.docxAccounting Research Center, Booth School of Business, Universi.docx
Accounting Research Center, Booth School of Business, Universi.docxnettletondevon
 
Optimal Portfolio Selection for a Defined Contribution Pension Fund with Retu...
Optimal Portfolio Selection for a Defined Contribution Pension Fund with Retu...Optimal Portfolio Selection for a Defined Contribution Pension Fund with Retu...
Optimal Portfolio Selection for a Defined Contribution Pension Fund with Retu...BRNSS Publication Hub
 
67004276
6700427667004276
67004276prabu10
 
Asset owners rethink their strategies (BNP 2016)
Asset owners rethink their strategies (BNP 2016)Asset owners rethink their strategies (BNP 2016)
Asset owners rethink their strategies (BNP 2016)Turlough Guerin GAICD FGIA
 
AIAR Winter 2015 - Henry Ma Adaptive Invest Approach
AIAR Winter 2015 - Henry Ma Adaptive Invest ApproachAIAR Winter 2015 - Henry Ma Adaptive Invest Approach
AIAR Winter 2015 - Henry Ma Adaptive Invest ApproachHenry Ma
 
Quantifying the Value of Risk Management - Jan 2008
Quantifying the Value of Risk Management - Jan 2008Quantifying the Value of Risk Management - Jan 2008
Quantifying the Value of Risk Management - Jan 2008Adrian Crockett, CFA
 
Revaluation accounting and decision usefulness of accounting ratios
Revaluation accounting and decision usefulness of accounting ratiosRevaluation accounting and decision usefulness of accounting ratios
Revaluation accounting and decision usefulness of accounting ratiosAlexander Decker
 
Stochastic life cycle costing
Stochastic life cycle costingStochastic life cycle costing
Stochastic life cycle costingBruno De Wachter
 
Do conditional and unconditional conservatism impact
Do conditional and unconditional conservatism impactDo conditional and unconditional conservatism impact
Do conditional and unconditional conservatism impactAlexander Decker
 

Similar to Retirement saving with contribution payments and labor income as a benchmark for investments (20)

2012 01-bis-the sustainability of pension schemes
2012 01-bis-the sustainability of pension schemes2012 01-bis-the sustainability of pension schemes
2012 01-bis-the sustainability of pension schemes
 
Scenario generation and stochastic programming models for asset liabiltiy man...
Scenario generation and stochastic programming models for asset liabiltiy man...Scenario generation and stochastic programming models for asset liabiltiy man...
Scenario generation and stochastic programming models for asset liabiltiy man...
 
Rudebusch Lopez Christensen
Rudebusch Lopez ChristensenRudebusch Lopez Christensen
Rudebusch Lopez Christensen
 
Outline March 2014
Outline March 2014Outline March 2014
Outline March 2014
 
Market Theory, Capital Asset Pricing Model
Market Theory, Capital Asset Pricing ModelMarket Theory, Capital Asset Pricing Model
Market Theory, Capital Asset Pricing Model
 
· Respond to 3 posts listed below. Advance the conversation; provi.docx
· Respond to 3 posts listed below. Advance the conversation; provi.docx· Respond to 3 posts listed below. Advance the conversation; provi.docx
· Respond to 3 posts listed below. Advance the conversation; provi.docx
 
Gust Lopez Salido
Gust Lopez SalidoGust Lopez Salido
Gust Lopez Salido
 
Capital Budegting.pdf
Capital Budegting.pdfCapital Budegting.pdf
Capital Budegting.pdf
 
Accounting Research Center, Booth School of Business, Universi.docx
Accounting Research Center, Booth School of Business, Universi.docxAccounting Research Center, Booth School of Business, Universi.docx
Accounting Research Center, Booth School of Business, Universi.docx
 
Optimal Portfolio Selection for a Defined Contribution Pension Fund with Retu...
Optimal Portfolio Selection for a Defined Contribution Pension Fund with Retu...Optimal Portfolio Selection for a Defined Contribution Pension Fund with Retu...
Optimal Portfolio Selection for a Defined Contribution Pension Fund with Retu...
 
03_AJMS_155_18_RA.pdf
03_AJMS_155_18_RA.pdf03_AJMS_155_18_RA.pdf
03_AJMS_155_18_RA.pdf
 
03_AJMS_155_18_RA.pdf
03_AJMS_155_18_RA.pdf03_AJMS_155_18_RA.pdf
03_AJMS_155_18_RA.pdf
 
67004276
6700427667004276
67004276
 
Asset owners rethink their strategies (BNP 2016)
Asset owners rethink their strategies (BNP 2016)Asset owners rethink their strategies (BNP 2016)
Asset owners rethink their strategies (BNP 2016)
 
Governance, cost and sustainable investing
Governance, cost and sustainable investingGovernance, cost and sustainable investing
Governance, cost and sustainable investing
 
AIAR Winter 2015 - Henry Ma Adaptive Invest Approach
AIAR Winter 2015 - Henry Ma Adaptive Invest ApproachAIAR Winter 2015 - Henry Ma Adaptive Invest Approach
AIAR Winter 2015 - Henry Ma Adaptive Invest Approach
 
Quantifying the Value of Risk Management - Jan 2008
Quantifying the Value of Risk Management - Jan 2008Quantifying the Value of Risk Management - Jan 2008
Quantifying the Value of Risk Management - Jan 2008
 
Revaluation accounting and decision usefulness of accounting ratios
Revaluation accounting and decision usefulness of accounting ratiosRevaluation accounting and decision usefulness of accounting ratios
Revaluation accounting and decision usefulness of accounting ratios
 
Stochastic life cycle costing
Stochastic life cycle costingStochastic life cycle costing
Stochastic life cycle costing
 
Do conditional and unconditional conservatism impact
Do conditional and unconditional conservatism impactDo conditional and unconditional conservatism impact
Do conditional and unconditional conservatism impact
 

More from Nicha Tatsaneeyapan

How To Shift Consumer Behaviors to be more sustainable; a literature review a...
How To Shift Consumer Behaviors to be more sustainable; a literature review a...How To Shift Consumer Behaviors to be more sustainable; a literature review a...
How To Shift Consumer Behaviors to be more sustainable; a literature review a...Nicha Tatsaneeyapan
 
An ethical approach to data privacy protection
An ethical approach to data privacy protectionAn ethical approach to data privacy protection
An ethical approach to data privacy protectionNicha Tatsaneeyapan
 
Linkages between extreme stock market and currency returns
Linkages between extreme stock market and currency returnsLinkages between extreme stock market and currency returns
Linkages between extreme stock market and currency returnsNicha Tatsaneeyapan
 
Incentives and risk taking in hedge funds
Incentives and risk taking in hedge fundsIncentives and risk taking in hedge funds
Incentives and risk taking in hedge fundsNicha Tatsaneeyapan
 
Loss-aversion and household portfolio choice
Loss-aversion and household portfolio choiceLoss-aversion and household portfolio choice
Loss-aversion and household portfolio choiceNicha Tatsaneeyapan
 
Estimating ambiguity preferences and perceptions in multiple prior models: Ev...
Estimating ambiguity preferences and perceptions in multiple prior models: Ev...Estimating ambiguity preferences and perceptions in multiple prior models: Ev...
Estimating ambiguity preferences and perceptions in multiple prior models: Ev...Nicha Tatsaneeyapan
 
Forecasting the US housing market
Forecasting the US housing marketForecasting the US housing market
Forecasting the US housing marketNicha Tatsaneeyapan
 
Options and earnings announcements: an empirical study of volatility,trading ...
Options and earnings announcements: an empirical study of volatility,trading ...Options and earnings announcements: an empirical study of volatility,trading ...
Options and earnings announcements: an empirical study of volatility,trading ...Nicha Tatsaneeyapan
 
Early Warning Systems for Currency Crises: A Multivariate Extreme Value Appr...
Early Warning Systems for Currency Crises:  A Multivariate Extreme Value Appr...Early Warning Systems for Currency Crises:  A Multivariate Extreme Value Appr...
Early Warning Systems for Currency Crises: A Multivariate Extreme Value Appr...Nicha Tatsaneeyapan
 
Incentives and Risk Taking in Hedge Funds *
Incentives and Risk Taking in Hedge Funds *Incentives and Risk Taking in Hedge Funds *
Incentives and Risk Taking in Hedge Funds *Nicha Tatsaneeyapan
 
The effect of VaR-based risk management on asset prices and the volatility s...
The effect of VaR-based risk management on asset prices  and the volatility s...The effect of VaR-based risk management on asset prices  and the volatility s...
The effect of VaR-based risk management on asset prices and the volatility s...Nicha Tatsaneeyapan
 
Model Uncertainty and Exchange Rate Forecasting
Model Uncertainty and Exchange Rate ForecastingModel Uncertainty and Exchange Rate Forecasting
Model Uncertainty and Exchange Rate ForecastingNicha Tatsaneeyapan
 
HIGH-PERFORMANCE COMPUTING FOR ASSET-LIABILITY MANAGEMENT
HIGH-PERFORMANCE COMPUTING FOR ASSET-LIABILITY MANAGEMENTHIGH-PERFORMANCE COMPUTING FOR ASSET-LIABILITY MANAGEMENT
HIGH-PERFORMANCE COMPUTING FOR ASSET-LIABILITY MANAGEMENTNicha Tatsaneeyapan
 
Endogenous Price Bubbles in a Multi-Agent System of the Housing Market
Endogenous Price Bubbles in a Multi-Agent System of the Housing MarketEndogenous Price Bubbles in a Multi-Agent System of the Housing Market
Endogenous Price Bubbles in a Multi-Agent System of the Housing MarketNicha Tatsaneeyapan
 
Comparisons of Foreign Multinationals and Local Firms in Asian Manufacturing...
Comparisons of Foreign Multinationals and Local  Firms in Asian Manufacturing...Comparisons of Foreign Multinationals and Local  Firms in Asian Manufacturing...
Comparisons of Foreign Multinationals and Local Firms in Asian Manufacturing...Nicha Tatsaneeyapan
 
Wage differentials between_foreign_multinationals_
Wage differentials between_foreign_multinationals_Wage differentials between_foreign_multinationals_
Wage differentials between_foreign_multinationals_Nicha Tatsaneeyapan
 
Variations in human resource management in asian countries mnc home country a...
Variations in human resource management in asian countries mnc home country a...Variations in human resource management in asian countries mnc home country a...
Variations in human resource management in asian countries mnc home country a...Nicha Tatsaneeyapan
 
Sterilization costs and exchange rate targeting∗
Sterilization costs and exchange rate targeting∗Sterilization costs and exchange rate targeting∗
Sterilization costs and exchange rate targeting∗Nicha Tatsaneeyapan
 
Comparisons of Foreign Multinationals and Local Firms in Asian Manufacturing...
Comparisons of Foreign Multinationals and Local  Firms in Asian Manufacturing...Comparisons of Foreign Multinationals and Local  Firms in Asian Manufacturing...
Comparisons of Foreign Multinationals and Local Firms in Asian Manufacturing...Nicha Tatsaneeyapan
 
The Investment Climate for Japanese Manufacturing MNCs in Asia: ICSEAD's In...
The Investment Climate for  Japanese Manufacturing MNCs in Asia:  ICSEAD's In...The Investment Climate for  Japanese Manufacturing MNCs in Asia:  ICSEAD's In...
The Investment Climate for Japanese Manufacturing MNCs in Asia: ICSEAD's In...Nicha Tatsaneeyapan
 

More from Nicha Tatsaneeyapan (20)

How To Shift Consumer Behaviors to be more sustainable; a literature review a...
How To Shift Consumer Behaviors to be more sustainable; a literature review a...How To Shift Consumer Behaviors to be more sustainable; a literature review a...
How To Shift Consumer Behaviors to be more sustainable; a literature review a...
 
An ethical approach to data privacy protection
An ethical approach to data privacy protectionAn ethical approach to data privacy protection
An ethical approach to data privacy protection
 
Linkages between extreme stock market and currency returns
Linkages between extreme stock market and currency returnsLinkages between extreme stock market and currency returns
Linkages between extreme stock market and currency returns
 
Incentives and risk taking in hedge funds
Incentives and risk taking in hedge fundsIncentives and risk taking in hedge funds
Incentives and risk taking in hedge funds
 
Loss-aversion and household portfolio choice
Loss-aversion and household portfolio choiceLoss-aversion and household portfolio choice
Loss-aversion and household portfolio choice
 
Estimating ambiguity preferences and perceptions in multiple prior models: Ev...
Estimating ambiguity preferences and perceptions in multiple prior models: Ev...Estimating ambiguity preferences and perceptions in multiple prior models: Ev...
Estimating ambiguity preferences and perceptions in multiple prior models: Ev...
 
Forecasting the US housing market
Forecasting the US housing marketForecasting the US housing market
Forecasting the US housing market
 
Options and earnings announcements: an empirical study of volatility,trading ...
Options and earnings announcements: an empirical study of volatility,trading ...Options and earnings announcements: an empirical study of volatility,trading ...
Options and earnings announcements: an empirical study of volatility,trading ...
 
Early Warning Systems for Currency Crises: A Multivariate Extreme Value Appr...
Early Warning Systems for Currency Crises:  A Multivariate Extreme Value Appr...Early Warning Systems for Currency Crises:  A Multivariate Extreme Value Appr...
Early Warning Systems for Currency Crises: A Multivariate Extreme Value Appr...
 
Incentives and Risk Taking in Hedge Funds *
Incentives and Risk Taking in Hedge Funds *Incentives and Risk Taking in Hedge Funds *
Incentives and Risk Taking in Hedge Funds *
 
The effect of VaR-based risk management on asset prices and the volatility s...
The effect of VaR-based risk management on asset prices  and the volatility s...The effect of VaR-based risk management on asset prices  and the volatility s...
The effect of VaR-based risk management on asset prices and the volatility s...
 
Model Uncertainty and Exchange Rate Forecasting
Model Uncertainty and Exchange Rate ForecastingModel Uncertainty and Exchange Rate Forecasting
Model Uncertainty and Exchange Rate Forecasting
 
HIGH-PERFORMANCE COMPUTING FOR ASSET-LIABILITY MANAGEMENT
HIGH-PERFORMANCE COMPUTING FOR ASSET-LIABILITY MANAGEMENTHIGH-PERFORMANCE COMPUTING FOR ASSET-LIABILITY MANAGEMENT
HIGH-PERFORMANCE COMPUTING FOR ASSET-LIABILITY MANAGEMENT
 
Endogenous Price Bubbles in a Multi-Agent System of the Housing Market
Endogenous Price Bubbles in a Multi-Agent System of the Housing MarketEndogenous Price Bubbles in a Multi-Agent System of the Housing Market
Endogenous Price Bubbles in a Multi-Agent System of the Housing Market
 
Comparisons of Foreign Multinationals and Local Firms in Asian Manufacturing...
Comparisons of Foreign Multinationals and Local  Firms in Asian Manufacturing...Comparisons of Foreign Multinationals and Local  Firms in Asian Manufacturing...
Comparisons of Foreign Multinationals and Local Firms in Asian Manufacturing...
 
Wage differentials between_foreign_multinationals_
Wage differentials between_foreign_multinationals_Wage differentials between_foreign_multinationals_
Wage differentials between_foreign_multinationals_
 
Variations in human resource management in asian countries mnc home country a...
Variations in human resource management in asian countries mnc home country a...Variations in human resource management in asian countries mnc home country a...
Variations in human resource management in asian countries mnc home country a...
 
Sterilization costs and exchange rate targeting∗
Sterilization costs and exchange rate targeting∗Sterilization costs and exchange rate targeting∗
Sterilization costs and exchange rate targeting∗
 
Comparisons of Foreign Multinationals and Local Firms in Asian Manufacturing...
Comparisons of Foreign Multinationals and Local  Firms in Asian Manufacturing...Comparisons of Foreign Multinationals and Local  Firms in Asian Manufacturing...
Comparisons of Foreign Multinationals and Local Firms in Asian Manufacturing...
 
The Investment Climate for Japanese Manufacturing MNCs in Asia: ICSEAD's In...
The Investment Climate for  Japanese Manufacturing MNCs in Asia:  ICSEAD's In...The Investment Climate for  Japanese Manufacturing MNCs in Asia:  ICSEAD's In...
The Investment Climate for Japanese Manufacturing MNCs in Asia: ICSEAD's In...
 

Recently uploaded

原版1:1复刻温哥华岛大学毕业证Vancouver毕业证留信学历认证
原版1:1复刻温哥华岛大学毕业证Vancouver毕业证留信学历认证原版1:1复刻温哥华岛大学毕业证Vancouver毕业证留信学历认证
原版1:1复刻温哥华岛大学毕业证Vancouver毕业证留信学历认证rjrjkk
 
Classical Theory of Macroeconomics by Adam Smith
Classical Theory of Macroeconomics by Adam SmithClassical Theory of Macroeconomics by Adam Smith
Classical Theory of Macroeconomics by Adam SmithAdamYassin2
 
Chapter 2.ppt of macroeconomics by mankiw 9th edition
Chapter 2.ppt of macroeconomics by mankiw 9th editionChapter 2.ppt of macroeconomics by mankiw 9th edition
Chapter 2.ppt of macroeconomics by mankiw 9th editionMuhammadHusnain82237
 
Call Girls Near Me WhatsApp:+91-9833363713
Call Girls Near Me WhatsApp:+91-9833363713Call Girls Near Me WhatsApp:+91-9833363713
Call Girls Near Me WhatsApp:+91-9833363713Sonam Pathan
 
The Triple Threat | Article on Global Resession | Harsh Kumar
The Triple Threat | Article on Global Resession | Harsh KumarThe Triple Threat | Article on Global Resession | Harsh Kumar
The Triple Threat | Article on Global Resession | Harsh KumarHarsh Kumar
 
Attachment Of Assets......................
Attachment Of Assets......................Attachment Of Assets......................
Attachment Of Assets......................AmanBajaj36
 
Governor Olli Rehn: Dialling back monetary restraint
Governor Olli Rehn: Dialling back monetary restraintGovernor Olli Rehn: Dialling back monetary restraint
Governor Olli Rehn: Dialling back monetary restraintSuomen Pankki
 
NO1 WorldWide Genuine vashikaran specialist Vashikaran baba near Lahore Vashi...
NO1 WorldWide Genuine vashikaran specialist Vashikaran baba near Lahore Vashi...NO1 WorldWide Genuine vashikaran specialist Vashikaran baba near Lahore Vashi...
NO1 WorldWide Genuine vashikaran specialist Vashikaran baba near Lahore Vashi...Amil baba
 
(办理原版一样)QUT毕业证昆士兰科技大学毕业证学位证留信学历认证成绩单补办
(办理原版一样)QUT毕业证昆士兰科技大学毕业证学位证留信学历认证成绩单补办(办理原版一样)QUT毕业证昆士兰科技大学毕业证学位证留信学历认证成绩单补办
(办理原版一样)QUT毕业证昆士兰科技大学毕业证学位证留信学历认证成绩单补办fqiuho152
 
letter-from-the-chair-to-the-fca-relating-to-british-steel-pensions-scheme-15...
letter-from-the-chair-to-the-fca-relating-to-british-steel-pensions-scheme-15...letter-from-the-chair-to-the-fca-relating-to-british-steel-pensions-scheme-15...
letter-from-the-chair-to-the-fca-relating-to-british-steel-pensions-scheme-15...Henry Tapper
 
Call Girls In Yusuf Sarai Women Seeking Men 9654467111
Call Girls In Yusuf Sarai Women Seeking Men 9654467111Call Girls In Yusuf Sarai Women Seeking Men 9654467111
Call Girls In Yusuf Sarai Women Seeking Men 9654467111Sapana Sha
 
chapter_2.ppt The labour market definitions and trends
chapter_2.ppt The labour market definitions and trendschapter_2.ppt The labour market definitions and trends
chapter_2.ppt The labour market definitions and trendslemlemtesfaye192
 
fca-bsps-decision-letter-redacted (1).pdf
fca-bsps-decision-letter-redacted (1).pdffca-bsps-decision-letter-redacted (1).pdf
fca-bsps-decision-letter-redacted (1).pdfHenry Tapper
 
(办理学位证)加拿大萨省大学毕业证成绩单原版一比一
(办理学位证)加拿大萨省大学毕业证成绩单原版一比一(办理学位证)加拿大萨省大学毕业证成绩单原版一比一
(办理学位证)加拿大萨省大学毕业证成绩单原版一比一S SDS
 
Bladex Earnings Call Presentation 1Q2024
Bladex Earnings Call Presentation 1Q2024Bladex Earnings Call Presentation 1Q2024
Bladex Earnings Call Presentation 1Q2024Bladex
 
Independent Lucknow Call Girls 8923113531WhatsApp Lucknow Call Girls make you...
Independent Lucknow Call Girls 8923113531WhatsApp Lucknow Call Girls make you...Independent Lucknow Call Girls 8923113531WhatsApp Lucknow Call Girls make you...
Independent Lucknow Call Girls 8923113531WhatsApp Lucknow Call Girls make you...makika9823
 
government_intervention_in_business_ownership[1].pdf
government_intervention_in_business_ownership[1].pdfgovernment_intervention_in_business_ownership[1].pdf
government_intervention_in_business_ownership[1].pdfshaunmashale756
 
Q3 2024 Earnings Conference Call and Webcast Slides
Q3 2024 Earnings Conference Call and Webcast SlidesQ3 2024 Earnings Conference Call and Webcast Slides
Q3 2024 Earnings Conference Call and Webcast SlidesMarketing847413
 
call girls in Nand Nagri (DELHI) 🔝 >༒9953330565🔝 genuine Escort Service 🔝✔️✔️
call girls in  Nand Nagri (DELHI) 🔝 >༒9953330565🔝 genuine Escort Service 🔝✔️✔️call girls in  Nand Nagri (DELHI) 🔝 >༒9953330565🔝 genuine Escort Service 🔝✔️✔️
call girls in Nand Nagri (DELHI) 🔝 >༒9953330565🔝 genuine Escort Service 🔝✔️✔️9953056974 Low Rate Call Girls In Saket, Delhi NCR
 

Recently uploaded (20)

原版1:1复刻温哥华岛大学毕业证Vancouver毕业证留信学历认证
原版1:1复刻温哥华岛大学毕业证Vancouver毕业证留信学历认证原版1:1复刻温哥华岛大学毕业证Vancouver毕业证留信学历认证
原版1:1复刻温哥华岛大学毕业证Vancouver毕业证留信学历认证
 
🔝+919953056974 🔝young Delhi Escort service Pusa Road
🔝+919953056974 🔝young Delhi Escort service Pusa Road🔝+919953056974 🔝young Delhi Escort service Pusa Road
🔝+919953056974 🔝young Delhi Escort service Pusa Road
 
Classical Theory of Macroeconomics by Adam Smith
Classical Theory of Macroeconomics by Adam SmithClassical Theory of Macroeconomics by Adam Smith
Classical Theory of Macroeconomics by Adam Smith
 
Chapter 2.ppt of macroeconomics by mankiw 9th edition
Chapter 2.ppt of macroeconomics by mankiw 9th editionChapter 2.ppt of macroeconomics by mankiw 9th edition
Chapter 2.ppt of macroeconomics by mankiw 9th edition
 
Call Girls Near Me WhatsApp:+91-9833363713
Call Girls Near Me WhatsApp:+91-9833363713Call Girls Near Me WhatsApp:+91-9833363713
Call Girls Near Me WhatsApp:+91-9833363713
 
The Triple Threat | Article on Global Resession | Harsh Kumar
The Triple Threat | Article on Global Resession | Harsh KumarThe Triple Threat | Article on Global Resession | Harsh Kumar
The Triple Threat | Article on Global Resession | Harsh Kumar
 
Attachment Of Assets......................
Attachment Of Assets......................Attachment Of Assets......................
Attachment Of Assets......................
 
Governor Olli Rehn: Dialling back monetary restraint
Governor Olli Rehn: Dialling back monetary restraintGovernor Olli Rehn: Dialling back monetary restraint
Governor Olli Rehn: Dialling back monetary restraint
 
NO1 WorldWide Genuine vashikaran specialist Vashikaran baba near Lahore Vashi...
NO1 WorldWide Genuine vashikaran specialist Vashikaran baba near Lahore Vashi...NO1 WorldWide Genuine vashikaran specialist Vashikaran baba near Lahore Vashi...
NO1 WorldWide Genuine vashikaran specialist Vashikaran baba near Lahore Vashi...
 
(办理原版一样)QUT毕业证昆士兰科技大学毕业证学位证留信学历认证成绩单补办
(办理原版一样)QUT毕业证昆士兰科技大学毕业证学位证留信学历认证成绩单补办(办理原版一样)QUT毕业证昆士兰科技大学毕业证学位证留信学历认证成绩单补办
(办理原版一样)QUT毕业证昆士兰科技大学毕业证学位证留信学历认证成绩单补办
 
letter-from-the-chair-to-the-fca-relating-to-british-steel-pensions-scheme-15...
letter-from-the-chair-to-the-fca-relating-to-british-steel-pensions-scheme-15...letter-from-the-chair-to-the-fca-relating-to-british-steel-pensions-scheme-15...
letter-from-the-chair-to-the-fca-relating-to-british-steel-pensions-scheme-15...
 
Call Girls In Yusuf Sarai Women Seeking Men 9654467111
Call Girls In Yusuf Sarai Women Seeking Men 9654467111Call Girls In Yusuf Sarai Women Seeking Men 9654467111
Call Girls In Yusuf Sarai Women Seeking Men 9654467111
 
chapter_2.ppt The labour market definitions and trends
chapter_2.ppt The labour market definitions and trendschapter_2.ppt The labour market definitions and trends
chapter_2.ppt The labour market definitions and trends
 
fca-bsps-decision-letter-redacted (1).pdf
fca-bsps-decision-letter-redacted (1).pdffca-bsps-decision-letter-redacted (1).pdf
fca-bsps-decision-letter-redacted (1).pdf
 
(办理学位证)加拿大萨省大学毕业证成绩单原版一比一
(办理学位证)加拿大萨省大学毕业证成绩单原版一比一(办理学位证)加拿大萨省大学毕业证成绩单原版一比一
(办理学位证)加拿大萨省大学毕业证成绩单原版一比一
 
Bladex Earnings Call Presentation 1Q2024
Bladex Earnings Call Presentation 1Q2024Bladex Earnings Call Presentation 1Q2024
Bladex Earnings Call Presentation 1Q2024
 
Independent Lucknow Call Girls 8923113531WhatsApp Lucknow Call Girls make you...
Independent Lucknow Call Girls 8923113531WhatsApp Lucknow Call Girls make you...Independent Lucknow Call Girls 8923113531WhatsApp Lucknow Call Girls make you...
Independent Lucknow Call Girls 8923113531WhatsApp Lucknow Call Girls make you...
 
government_intervention_in_business_ownership[1].pdf
government_intervention_in_business_ownership[1].pdfgovernment_intervention_in_business_ownership[1].pdf
government_intervention_in_business_ownership[1].pdf
 
Q3 2024 Earnings Conference Call and Webcast Slides
Q3 2024 Earnings Conference Call and Webcast SlidesQ3 2024 Earnings Conference Call and Webcast Slides
Q3 2024 Earnings Conference Call and Webcast Slides
 
call girls in Nand Nagri (DELHI) 🔝 >༒9953330565🔝 genuine Escort Service 🔝✔️✔️
call girls in  Nand Nagri (DELHI) 🔝 >༒9953330565🔝 genuine Escort Service 🔝✔️✔️call girls in  Nand Nagri (DELHI) 🔝 >༒9953330565🔝 genuine Escort Service 🔝✔️✔️
call girls in Nand Nagri (DELHI) 🔝 >༒9953330565🔝 genuine Escort Service 🔝✔️✔️
 

Retirement saving with contribution payments and labor income as a benchmark for investments

  • 1. Available online at www.sciencedirect.com Journal of Economic Dynamics & Control 27 (2003) 1069–1097 www.elsevier.com/locate/econbase Retirement saving with contribution payments and labor income as a benchmark for investments Arjan Berkelaara, Roy Kouwenbergb; ∗ aWorld Bank, Pension Fund, Washington, DC, USA bAEGON Asset Management and Erasmus University Rotterdam, P.O. Box 202, 2501 CE, The Hague, Netherlands Abstract In this paper we study the retirement saving problem from the point of view of a plan sponsor, who makes contribution payments for the future retirement of an employee. The plan sponsor considers the employee’s labor income as investment-benchmark in order to ensure the continuation of consumption habits after retirement. We demonstrate that the demand for risky assets increases at low wealth levels due to the contribution payments. We quantify the demand for hedging against changes in wage growth and 4nd that it is relatively small. We show that downside-risk measures increase risk-taking at both low and high levels of wealth. ? 2002 Elsevier Science B.V. All rights reserved. JEL classi-cation: G11; G23 Keywords: Retirement saving; Optimal asset allocation; Discrete-time 4nance; Dynamic programming 1. Introduction In this paper we study the problem of saving for retirement with contribution pay- ments and labor income as a benchmark for investments. We consider the retirement saving problem from the point of view of a plan sponsor. The plan sponsor makes contribution payments to an investment fund in order to save for the future retirement of an employee. The goal is to ensure that the employee can continue his consumption pattern after retirement. As the consumption habits of the employee are related to his This paper re:ects the personal views of the authors and not those of the World Bank. We are grateful to Bart Oldenkamp and Ton Vorst for comments on an earlier version of this paper. ∗ Corresponding author. Econometric Institute, Erasmus University Rotterdam, P.O. Box 1738, 3000 DR Rotterdam, Netherlands. Tel.: +31-70-3448089. E-mail address: rkouwenberg@aegon.nl, kouwenberg@few.eur.nl (R. Kouwenberg). 0165-1889/02/$ - see front matter ? 2002 Elsevier Science B.V. All rights reserved. PII: S0165-1889(02)00055-6
  • 2. 1070 A. Berkelaar, R. Kouwenberg / Journal of Economic Dynamics Control 27 (2003) 1069–1097 wages, the plan sponsor considers the labor income of the employee as a benchmark for investments. Clearly, the plan sponsor is not only concerned about the welfare of the employee and also wants to minimize his contribution payments. We formalize this in a multi-period retirement saving model, where the plan sponsor makes a trade-oG between the utility of low contribution payments and the utility of high fund values at retirement, relative to the labor income of the employee. The solution of the model reveals the optimal dynamic investment strategy and the optimal funding policy of the plan sponsor. The retirement saving model presented in this paper includes both a de4ned con- tributions pension plan and a ‘4nal pay’ de4ned bene4ts plan as special cases. The generality of the model allows us to circumvent the large diGerence in pension schemes throughout the world: we focus on the core of the retirement saving problem. Clearly, not every plan sponsor or pension fund considers labor income as a benchmark for investments. However, we believe that it is in the interest of the employees to do so, without any adverse consequences. An important assumption throughout the paper is that the labor income of the em- ployee cannot be replicated with the available assets: consequently, the 4nancial market is incomplete. Moreover, we assume that the wage growth rate is partly predictable. Given the basic model setup, we derive optimal decision rules by applying dynamic programming. The optimal decision rules specify the asset weights and the contribution payment as a function of the state variables (the wealth-to-income ratio and the wage growth rate) and provide direct insight into the underlying problem. We are particularly interested in the following issues, which are relevant for retire- ment saving and have not been studied adequately in the literature yet 1. What is the magnitude of the demand for the hedge portfolio against random changes of the wage growth rate? 2. What is the impact of contribution payments on the optimal asset allocation? 3. What is the optimal multi-period investment strategy for investment objectives based on downside-risk measures, which are very popular in practice? 4. What is the eGect of an objective that assigns utility to a high fund value before the retirement date (on top of utility at retirement)? With our implementation of the dynamic programming algorithm we were able to address these three main questions about optimal investment and funding in the retire- ment saving model. The conclusions to be drawn from our analysis and computational experiments are as follows: 1. Regardless of his utility function, the plan sponsor invests in a hedge portfolio against random :uctuations of the employee’s labor income. The hedge portfolio depends on the covariance of the asset returns with the wage growth rate. The numerical results demonstrate that the correlation between asset returns and wage growth has a substantial in:uence on portfolio composition. Dynamic adjustments of the hedging strategy due to changes of the wage growth rate are relatively small. 2. Contribution payments change the optimal investment strategy considerably, even for a plan sponsor with constant relative risk aversion over fund value. The portfolio
  • 3. A. Berkelaar, R. Kouwenberg / Journal of Economic Dynamics Control 27 (2003) 1069–1097 1071 weights are no longer constant and there is a strong tendency to gamble at low levels of wealth. We also 4nd that contribution payments lead to a strong investment horizon eGect. 3. If a plan sponsor maximizes the expected fund value subject to a penalty on downside-risk, then the optimal investment policy is to increase the weight of risky assets at low levels of wealth. This gambling policy can be attributed to the property of increasing relative risk aversion of the downside-risk objective. 4. Intertemporal measurement of utility over wealth reduces the gambling eGects due to contribution payments considerably. The insights gained from the basic retirement saving model studied in this paper may help plan sponsors to formulate dynamic investment policies and choose reasonable objectives. Furthermore, the optimal decision-rules derived here can be implemented in simulation-based systems for ALM, where additional market imperfections such as transaction costs could be added. In order to place this paper in the literature, we could interpret the retirement saving problem with labor income as an asset–liability management (ALM) problem. In the literature many single-period ALM models have been studied (Sharpe and Tint, 1990; Leibowitz et al., 1994). These models indicate that investors should take the correlation between assets and liabilities into account, while deciding about the investment strategy. However, saving for retirement typically involves a long-term investment goal, and one-period models are, therefore, inappropriate due to stochastic opportunity sets and non-myopic preferences. There is a large stream of literature about the application of stochastic programming methods for multi-period ALM (see Mulvey and Ziemba (1998) for an overview). Stochastic programming models formulate an accurate answer to the question: how to invest today, given optimal recourse in the future? However, the optimal policies do not explicitly reveal the relation between the decisions and the state-variables. Our main objective is to gain insight in optimal decision rules for portfolio choice and funding in a simple micro-economic model without market imperfections. Dynamic retirement saving problems have also been studied in the actuarial literature: we refer to O’Brien (1987) for an early continuous-time formulation and Haberman and Sung (1994) for a more recent discrete-time model. Haberman and Sung (1994) provide a closed-form solution for a discrete-time pension model where the objective function is to minimize the squared deviations from the target contribution rate, and the squared deviations from the target funding ratio. The mathematical results of Haberman and Sung (1994) are impressive but the approach can not be easily extended to objective functions that are non-quadratic, or to problems with constraints on the policies, as studied in this paper. Due to the focus on dynamic programming and micro-economic analysis this paper is also related to the individual consumption–investment literature (Mossin, 1968; Hakansson, 1969; Samuelson, 1969). Our retirement saving model can be classi4ed as a model with a stochastic opportunity set (predictable wage growth), with both negative and positive consumption (the net contribution payment) and without a risk- less asset (due to market incompleteness). Koo (1999) analyzes a simple discrete-time
  • 4. 1072 A. Berkelaar, R. Kouwenberg / Journal of Economic Dynamics Control 27 (2003) 1069–1097 model with labor income for power utility and has to apply numerical techniques to solve it. As our model is more elaborate and as we additionally want to study more general objectives than power utility, we clearly need a numerical solution method. For the computation of the optimal investment policy we apply a dynamic program- ming algorithm. We add several numerical improvements to the basic algorithm in order to increase eOciency, including transformation and interpolation of the value function, which facilitate the solution of investment models with power and HARA-utility. As we apply dynamic programming, the optimal policies are derived in feedback form and we acquire direct insight into the structure of the strategies. This paper can be placed in a growing literature that solves consumption–investment problems numerically in order to study the impact of relevant, but analytically complicated, issues such as pre- dictability, transaction costs and parameter uncertainty (Brennan et al., 1997; Balduzzi and Lynch, 1999; Barberis, 2000). This paper is organized as follows. In Section 2, we introduce the retirement saving model and the main assumptions. Moreover, we review the literature and introduce our implementation of the dynamic programming algorithm. In Section 3, we study the optimal investment strategies in detail for diGerent investment objectives. We show that the widely used class of downside-risk measures leads to peculiar investment policies in a multi-period setting. In Section 4, we study the additional eGect of funding payments on the investment strategy, while Section 5 considers horizon eGects and the impact of utility over intertemporal fund value. Section 6 concludes and summarizes the paper. 2. Retirement saving model 2.1. Model de-nition and assumptions In this section we introduce the model for retirement saving that will be studied in this paper. We assume that a plan sponsor pays contributions in order to 4nance the retirement of an employee at time T. The plan sponsor has established an investment fund with initial wealth Wt at time t = 0 in order to achieve the retirement goal at the planning horizon T. At the beginning of each period t =0; 1; : : : ; T −1 the plan sponsor decides either to add a contribution payment of C+ t ¿ 0 to the fund or to extract cash from the fund C− t ¿ 0. We represent the net cash:ow into the fund by Ct = C+ t − C− t . After the cash in- and out:ows a total amount of (Wt + Ct) is left for investment in the capital market. There are I + 1 assets available for investment in the economy at time t, each providing a discretely compounded random return of Ri;t+1 at time t + 1 for i = 0; 1; : : : ; I. Each period the plan sponsor invests a fraction wit of the investment fund’s wealth into asset i = 1; : : : ; I, while the remaining fraction (1 − I i=1 wi t) is invested in asset 0. The investment goal of the plan sponsor is to enable the employee to continue his consumption habits after retirement. As the employee’s consumption pattern is likely to be related to his labor income, the plan sponsor considers the employee’s wages at retirement IT as a benchmark for investments. We assume that the plan sponsor measures wealth relative to the labor income of the employee and maximizes a utility
  • 5. A. Berkelaar, R. Kouwenberg / Journal of Economic Dynamics Control 27 (2003) 1069–1097 1073 function U(FT ; T) over the relative fund value FT = WT =IT at retirement. The function U(FT ; T) is increasing and concave in the fund value FT . Additionally, the plan sponsor tries to minimize his contribution payments by max- imizing the utility function V(−Ct; It; t) over the intertemporal payments Ct for t = 0; 1; : : : ; T − 1. The function V(: ; It; t) is increasing and concave in its 4rst argument. Higher contribution payments therefore decrease the utility of the plan sponsor and in- crease the marginal utility of a unit reduction in payments. We formalize the trade-oG between fund value at retirement and contribution payments in the following retirement saving (RS) model: max wit ;Ct E0 T−1 t=0 V(−Ct; It; t) + U(WT =IT ; T) ; (1) s:t: Wt+1 = (Wt + Ct) I i=1 wit(1 + Ri;t+1) + 1 − I i=1 wit (1 + R0;t+1) ; for t = 0; 1; : : : ; T − 1; (2) where ¿ 0 is a parameter in:uencing the relative impact of utility over fund value FT = WT =IT at retirement T. The general model for retirement saving needs a more detailed speci4cation for a meaningful analysis. As a 4rst building block, we will assume that the wage growth rate t follows a mean-reverting process: Assumption 1. Labor income It at time t grows with the continuously compounded wage growth rate t+1; which follows a mean-reverting process It+1 = Itet+1 = It(1 + t+1); (3) Qt+1 = ( − t) + t+1; t+1 ∼ IID(0; 2 ); (4) where Qt+1 =t+1 −t; 0 ¡ ¡ 1 is the mean reversion parameter; is the long run mean wage growth rate and t+1 is an identically intertemporal independently distributed (IID) innovation with expectation zero and variance 2 . For ease of exposition we also de4ne the discrete wage growth rate t+1 = et+1 − 1. Secondly, we assume that the asset returns are not correlated intertemporally and imperfectly correlated with the wage growth innovation: Assumption 2. The joint distribution of the continuously compounded asset returns ri;t+1 and the wage growth innovation t+1 is equal in each period t = 0; 1; : : : ; T − 1. The vector of mean asset returns is = {i}I i=0 and the covariance matrix is = {ij}I i;j=0. The correlation vector of the asset returns with the wage growth innovation t+1 is denoted by I = {i}I i=0. The asset returns are not correlated intertemporally: Cov(ri;t+1; ri;t) = 0 for t = 0; 1; : : : ; T − 1. The discretely compounded asset return is de4ned as Ri;t+1 = eri; t+1 − 1.
  • 6. 1074 A. Berkelaar, R. Kouwenberg / Journal of Economic Dynamics Control 27 (2003) 1069–1097 Assumption 2 implies that there is no direct compensation for wage growth in the mean of the asset returns, although the returns can still be imperfectly correlated with the wage growth rate. Consequently, this assumption entails that there is no perfect hedge for wage in:ation: the -nancial market is incomplete. Thirdly, we assume that the plan sponsor measures the utility of a contribution payment Ct relative to employee’s wage income It at time t. Assumption 3. The utility V over contribution payments is a function of time and the ratio Ct=It only: V(−Ct; It; t) = H(−Ct=It; t). We de4ne ct = Ct=It as the contribution rate relative to the employee’s labor income. Assumption 3 allows us to reduce the state space of the retirement saving problem from three variables (wealth Wt, income It and wage growth t) to two variables (the wealth–income ratio Ft and wage growth t). As a result the eGort needed for solving the model reduces signi4cantly. In our opinion this reduction of complexity makes up for the slight loss of generality. Moreover, the assumption of utility over contribution rates is also made by Boender (1997) in a widely used decision support system for pension funds. In practice, pension schemes are often categorized as either a de4ned contributions plan or a de4ned bene4ts plan. We would like to point out that our retirement saving model can include both schemes as special cases. If we 4x the contribution payments Ct at a constant non-negative level, then we replicate a de4ned contributions scheme. The retirement saving model also includes a ‘4nal pay’ de4ned bene4ts scheme, where the plan sponsor guarantees to pay M times the employee’s labor income at retirement (i.e. MIT ). 1 In the next sections we will discuss solution methods for the retirement saving model. 2.2. Dynamic programming and -rst-order conditions A well-known solution technique for sequential decision problems under uncertainty is dynamic programming (see Bellman, 1957; Bertsekas, 1976). It is based on the observation that an optimal policy for the entire sequential decision problem should also be optimal starting from any given state at a later date. This property is known as the principle of optimality. Given Assumptions 1–3, we can describe the state of the retirement fund at time t completely with the relative fund value Ft = Wt=It and the wage growth rate t. Let the value function J(Ft; t; t) denote the maximum expected utility obtainable for the plan sponsor starting at time t in state (Ft; t): J(Ft; t; t) = max wit ;ct Et T−1 j=t H(cj; j) + U(FT ; T) ; (5) 1 In order to guarantee MIT at retirement, the plan sponsor either has to pay an additional amount of C+ T = max{0; MIT − WT } or he receives the redundant fund value C− T = max{0; WT − MIT }. Suppose that the plan sponsor maximizes a utility function H(cT ; T) over the 4nal contribution rate cT =(MIT −WT )=IT = M − FT . We can model this equivalently with a utility function U(FT ; T) over 4nal fund value FT , as in the objective (1) of the retirement saving model.
  • 7. A. Berkelaar, R. Kouwenberg / Journal of Economic Dynamics Control 27 (2003) 1069–1097 1075 s:t: Ft+1 = (Ft + ct) I i=1 wit (1 + Ri;t+1) (1 + t+1) + 1 − I i=1 wit (1 + R0;t+1) (1 + t+1) for t = 0; 1; : : : ; T − 1: (6) The plan sponsor’s initial planning problem is de4ned by J(F0; 0; 0). Using the princi- ple of optimality, the dynamic programming algorithm derives this function recursively by solving the following sequence of one-period problems: J(Ft; t; t) = max wit ;ct {H(ct; t) + Et[J(Ft+1; t+1; t + 1)]}; (7) s:t: Ft+1 = (Ft + ct) I i=1 wit (1 + Ri;t+1) (1 + t+1) + 1 − I i=1 wit (1 + R0;t+1) (1 + t+1) ; for t = 0; 1; : : : ; T − 1; (8) where J(FT ; T ; T) = U(FT ; T). 2.3. Implementation of the discretized dynamic programming algorithm In general, it is not easy to 4nd closed-form expressions for the optimal policies that maximize (7) and in most cases numerical methods are required. We apply a numerical solution technique that is based on a discretization of the state space, i.e. a grid for the values of the state variables Ft and t. For each point on this grid we solve the dynamic programming equation (7) numerically for the optimal investment and funding decisions. Note that the required computations easily get out of hand, as the expectation of next period’s value function has to be integrated numerically. An additional complicating factor is the curse of dimensionality: the size of the state grid grows exponentially with the number of state variables. Our implementation of the discretized dynamic programming algorithm uses four numerical techniques that increase the eOciency of the method: 1. Variance reduction techniques in order to improve Monte-Carlo simulations. 2. Interpolation of the value function in order to reduce the size of the grid. 3. Transformation of the value function in order to facilitate interpolation methods. 4. Fast numerical optimizations using restarts from neighboring grid points. More information on the implementation of the algorithm can be found in Appendix A. The largest model solved in the paper has two state variables (wage growth, fund value) and 10 periods: we use a three-dimensional grid with 17 × 36 × 11 = 6; 732 points to discretize the state space. The algorithm required 20; 501 s (about 5:7 h) to solve the problem on a Pentium 200 desktop PC with 64 Mb of memory. In practice pension funds might want to consider even larger models in order to add more speci4c details about their planning problem, such as the liabilities and actuarial risk. The computational requirements for solving a more complex model will
  • 8. 1076 A. Berkelaar, R. Kouwenberg / Journal of Economic Dynamics Control 27 (2003) 1069–1097 de4nitely increase, however, we would like to point out that the dynamic programming algorithm is suited very well for parallel computations. Nowadays most companies have a network of desktop and mainframe computers, which could easily be used for parallel computations. We refer to Zenios (1999) for a discussion and an overview of the applications of parallel and high-performance computing in 4nance. 3. Investment policies for retirement saving 3.1. Portfolio separation and liability hedging credits We try to gain insight in the optimal policies of the retirement saving model by analysing diGerent parts in isolation. In this section we focus on optimal investment policies in a model without contribution payments, while in Section 4 we will in- vestigate the additional eGect of funding decisions. Throughout the following sections we will assume that the discrete asset returns and the wage growth are log-normally distributed. Assumption 4. The joint distribution of the continuously compounded asset returns ri;t+1 and the wage growth innovation t+1 is multi-variate normal in each period t = 0; 1; : : : ; T − 1; with a constant mean vector and a constant covariance matrix (see Assumption 2). Consequently; the discrete returns (1 + Ri;t+1) = eri; t+1 and the discrete wage growth (1 + i;t+1) = et+1 follow a multi-variate log-normal distribution. We 4rst pay attention to the general structure of the investment strategies. The corre- lation of the asset returns with the wage growth rate is very important for investments in the retirement saving model, as it drives the hedging demand for assets against changes in the wage growth rate. We can observe this in the general fund separation result of Merton (1971). In order to derive fund separation for our discrete-time re- tirement saving model we have to apply a linear approximation of the continuously compounded returns and we have to assume that asset 0 is riskless, leading to the following result: w∗ t = − Et[JF ] FtEt[JFF ] −1 ( − !r0) + 1 − Et[JF] FtE[JFF ] −1 I; (9) where w∗ t is the vector of optimal portfolio weights. The proof is omitted to save space, but available on request from the authors. The optimal asset weights of the plan sponsor can be separated into a market port- folio, a hedge portfolio for the wage growth rate and a riskless portfolio. Note that the second part of the portfolio, involving I, represents the intertemporal hedge against changes of the wage growth rate. Typically, an investor will increase the weight of an asset if it has a higher covariance I with the wage growth rate. This eGect is related to the concept of liability hedging credits, introduced by Sharpe and Tint (1990): the investor is willing to accept a lower expected return on assets that provide a partial hedge against changes in the value of the liabilities.
  • 9. A. Berkelaar, R. Kouwenberg / Journal of Economic Dynamics Control 27 (2003) 1069–1097 1077 3.2. Hedging demand under constant relative risk aversion The portfolio separation result holds for any investment objective, but it does not provide a complete solution as the investment rule depends on the unknown value function J(Ft; t; t). In order to learn more about the optimal investment strategies we will 4rst consider the case of constant relative risk aversion. We assume that the plan sponsor maximizes a power utility function over the relative fund value FT at the retirement date T: U(FT ; T) = (1 + )−T 1 # (FT )# ; (10) RU (FT ; T) = −FT UFF (FT ; T) UF (FT ; T) = 1 − #; (11) where # ¡ 1 is the relative risk aversion coeOcient and ¿ 0 is the intertemporal discount factor. The function RU (FT ; T) in (11) is the Arrow–Pratt measure of relative risk aversion, which is constant for power utility. In a simple investment model with one risky asset and one riskless asset the portfolio weight of the risky asset increases (decreases) as a function of wealth, if the relative risk aversion is decreasing (increasing) in wealth. An investor with constant relative risk aversion does not change the risky asset weight. We can derive a similar result for the retirement saving model with a power utility function (10) as objective, under the assumption of zero contribution rates ct = 0 for t = 0; 1; : : : ; T − 1: dw∗ it dFt = 0 and dw∗ it dt = 0 for t = 0; 1; : : : ; T − 1 and i = 0; 1; : : : ; I; (12) where w∗ it denotes the optimal asset weight for i = 0; 1; : : : ; I. The proof is omitted to save space, but available on request from the authors. 3.3. Hedging demand under decreasing relative risk aversion We conclude from (12) that the plan sponsor does not adjust the portfolio weights if the fund value or the wage growth changes, in the case with a CRRA objective and without intertemporal contribution payments. We will now study utility functions with decreasing relative risk aversion (DRRA), in order to investigate whether the optimal investment strategies are indeed diGerent. We introduce the following class of utility functions with DRRA, which can be applied in our economy without causing feasibility problems: 2 U(FT ; T) = (1 + )−T 1 # − p F−p T + % # F# T ; (13) 2 HARA-utility functions with a positive sustenance level ¿ 0 also have the property of DRRA, however, we cannot apply them in our incomplete market as they would cause bankruptcy problems (the constraint Ft ¿ of the HARA-utility function cannot be satis4ed under all circumstances).
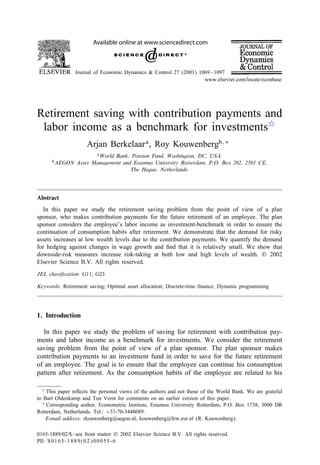
  • 10. 1078 A. Berkelaar, R. Kouwenberg / Journal of Economic Dynamics Control 27 (2003) 1069–1097 0.5 1 1.5 2 2.5 3 3.5 0 0.5 1 1.5 2 2.5 3 3.5 4 4.5 5 Wealth-Income Ratio Relative Risk-Aversion Fig. 1. Relative risk aversion function for DRRA. This 4gure shows the Arrow–Pratt measure of relative risk aversion (14) of utility function (13) as a function of the wealth–income ratio F, for parameter values # = −0:5, p = 3 and % = 3. RU (F; T) = −FT UFF (FT ; T) UF (FT ; T) = (1 − # + p) + (1 − #)%Fp T 1 + %Fp T ; (14) where # ¡ 1, p ¿ 0 and % ¿ 0 are constant parameters. It is easy to prove that UF (FT ; T) ¿ 0, UFF (FT ; T) ¡ 0 and RU F (FT ; T) ¡ 0 hold: U is a utility function with DRRA. If FT is close to zero then the relative risk aversion coeOcient equals (1 − # + p), while it decreases monotonically to (1 − #) as the fund value increases to in4nity. Hence, (1 − #) is the minimum relative risk aversion coeOcient, while p measures the maximum increase in risk aversion that occurs as the investor becomes less wealthy. Finally, the parameter % determines the rate at which risk aversion decreases from (1 − # + p) to (1 − #), as wealth grows. Fig. 1 shows a graph of the relative risk aversion function (14) for the parameter values # = −0:5, p = 3 and % = 3. These parameter values imply a decrease of relative risk aversion from 4:5 to 1:5. We would like to investigate the impact of DRRA on optimal investment strate- gies, however analytical solutions are not readily available under this particular utility speci4cation and therefore we rely on our numerical method. First, we specify the coeOcients that will be used in all numerical examples from now on. Assumption 5. For the numerical cases we consider a retirement fund 10 years before the retirement date; i.e. T = 10. The discount rate is 2% per year. The initial wealth of the fund is W0 = 1 and the initial labor income of the employee is I0 = 1. At the
  • 11. A. Berkelaar, R. Kouwenberg / Journal of Economic Dynamics Control 27 (2003) 1069–1097 1079 beginning of each period t=0; 1; : : : ; T −1 the plan sponsor can adjust the asset portfolio of the retirement fund. Two assets are available for investing; a risky bond and a risky stock. There is no riskless asset and short selling is not allowed. Consequently; the asset weights of the bond and the stock are within 0% and 100%. The asset returns are jointly log-normally distributed with expected returns B =6:8% and S =8:6% for the bond and the stock; respectively; standard deviations B =5:9% and S =15:7% and a correlation of BS = +0:38. The long run mean wage growth rate is = 5:7% ; the mean reversion parameter equals = 0:31 and the standard deviation is = 3%. We will make speci4c assumptions about the correlation between asset returns and wage growth later on. These parameters for the distribution of the asset returns and the wage growth rate are based on a Dutch yearly dataset from the period 1956–1994 (see Kouwenberg, 2001). We only consider two risky assets in order to facilitate the interpretation of the results. We now apply the discretized dynamic programming algorithm and solve the retirement saving model with DRRA numerically: Case 3.1: We solve the retirement saving model with DRRA utility function (13) for # = −0:5, p = 3 and % = 3. As a benchmark, we also solve the model with CRRA objective (10), for # = −0:5 and # = −3:5. In order to distinguish the impact of the objective we ignore uncertainty about labor income in this example: the wage growth rate is 4xed at t = 3% annually. We apply the discretized dynamic programming algorithm on a grid consisting of 36 equally spaced fund values F = 0–3.5 (step size 0:1). Expectations over the return distribution are approximated with 10; 000 simulation points: Fig. 2 shows the optimal proportion invested in stocks at time t = 0, as a function of initial fund value. The investment strategy is clearly myopic for the two constant relative risk aversion cases # = −0:5 and −3:5, demonstrating the convergence of the numerical algorithm. With decreasing relative risk aversion the weight of stocks increases from 28% to 90%. It is clear that this optimal investment strategy can be explained quite well by the corresponding decreasing relative risk aversion function in Fig. 1. We will now additionally investigate the impact of uncertainty about the wage growth rate. We already know that a plan sponsor with CRRA utility follows a myopic in- vestment strategy, as there is no substitution between assets in our economy if the wage growth changes. Note that a change of the wage growth rate does inAuence the expected fund value. Consequently, we hypothesize that a plan sponsor with DRRA hedges intertemporally against changes of wage growth, as his investment strategy is in:uenced by changes in (expected) wealth. We will now demonstrate this eGect numerically: Case 3.2: The plan sponsor maximizes DRRA utility function (13) with parameter values #=−0:5, p=3 and %=3. Additionally, the wage growth rate t is stochastic, with the parameters speci4ed in Assumption 5. For the correlation between wage growth and asset returns we consider two cases: 1. bond returns are positively correlated with wage growth, while stock returns are uncorrelated (B = +1 3 and S = 0) and 2. the opposite case (B =0 and S =+1 3 ). We apply the discretized dynamic programming
  • 12. 1080 A. Berkelaar, R. Kouwenberg / Journal of Economic Dynamics Control 27 (2003) 1069–1097 0.5 1 1.5 2 2.5 3 3.5 0 0.2 0.4 0.6 0.8 1 1.2 Wealth-Income Ratio Fraction Invested in Stocks Fig. 2. Stock weight for DRRA. This 4gure shows the fraction invested in stocks for constant relative risk aversion levels # = −3:5 (dotted line) and # = −0:5 (dashed line) and decreasing relative risk aversion (solid curve). A more risk averse investor dedicates less to stocks (28% for risk aversion level # = −3:5 compared to 90% for risk aversion level # = −0:5). Moreover, decreasing relative risk aversion implies that the investor desires less exposure to stocks when real wealth drops. algorithm on a two-dimensional grid for the state variables consisting of 36 equally spaced fund values F = 0–3:5 (step size 0:1) and 17 wage growth rates = −0:10– +0:22 (step size 0:02). Expectations over the return distribution are approximated with 10; 000 simulation points. Fig. 3 shows the optimal stock proportion at time 0 as a function of fund value and the initial wage growth rate, in the case that bond returns are positively correlated with wage in:ation. We observe two major eGects. First, the fraction invested in stocks increases as the fund value becomes larger: this is the familiar result for DRRA. Second, an increase in the expected wage growth leads to a larger proportion of bonds in the portfolio in order to hedge against the expected reduction of future wealth, as we hypothesized earlier. Fig. 4 displays the results for the case where stock returns are positively correlated with the wage growth rate. We clearly observe that the fraction invested in stocks increases at any level of fund value and wage in:ation, compared to the situation in Fig. 3. This parallel shift of the investment strategy can be explained by the increased liability hedging credits of stocks. If we concentrate on the dynamic hedging strategy, the results in Figs. 3 and 4 are similar: an increase of expected wage growth reduces the proportion of stocks in the portfolio, regardless of the underlying correlation structure.
  • 13. A. Berkelaar, R. Kouwenberg / Journal of Economic Dynamics Control 27 (2003) 1069–1097 1081 0.5 1 1.5 2 2.5 3 3.5 -0.1 -0.05 0 0.05 0.1 0.15 0.2 0 0.2 0.4 0.6 0.8 1 Wealth-Income Ratio Wage Growth Rate Fraction Invested in Stocks Fig. 3. Stock weight for DRRA with stochastic wage growth (S =0 and B =0:33). This 4gure shows the fraction invested in stocks when returns on bonds are positively correlated with wage growth. The percentage of stocks in the optimal portfolio slightly decreases for increasing wage growth levels. 0.5 1 1.5 2 2.5 3 3.5 -0.1 -0.05 0 0.05 0.1 0.15 0.2 0 0.2 0.4 0.6 0.8 1 Wealth-Income Ratio Wage Growth Rate Fraction Invested in Stocks Fig. 4. Stock weight for DRRA with stochastic wage growth (S = 0:33 and B = 0). This 4gure shows the fraction invested in stocks when returns on stocks are positively correlated with wage growth. Compared to Fig. 3 the graph is shifted only in a parallel way, i.e. the weight increases generally when stock returns are positively correlated with wage growth. Adjustments of the portfolio as a function of the wage growth rate are small and comparable to Fig. 3.
  • 14. 1082 A. Berkelaar, R. Kouwenberg / Journal of Economic Dynamics Control 27 (2003) 1069–1097 3.4. The V-shaped consequences of downside-risk measures In practice a popular objective is to maximize the expected fund value, subject to a penalty if wealth drops below the investment benchmark, i.e. a penalty on downside- risk. Downside-risk measures have been introduced as a substitute for standard risk measures such as variance, as it seems unreasonable to penalize negative and positive deviations from the benchmark equally. Popular measures include: shortfall probability, expected shortfall and semivariance (see Bawa and Lindenberg, 1977). In this section we study the optimal investment strategy if the plan sponsor maxi- mizes the expected fund value at retirement, subject to a quadratic penalty if he fails to outperform the investment benchmark (i.e. if FT ¡ 1) max wit E0[U(FT ; T)] = 1 (1 + )T E0[FT ] − 'E0 min{0; 1 − FT }2
  • 15. ; (15) where U(FT ; T) = (1 + )−T FT − ' min{0; 1 − FT }2
  • 16. and ' ¿ 0 is a constant risk aversion parameter. In the normative ALM literature for pension funds the downside-risk concept is highly successful and seems to have replaced traditional utility functions. Investors that try to meet their liabilities usually apply a threshold of 1 for the funding ratio, i.e. the ratio of assets to liabilities. Even regulating authorities nowadays advocate the use of downside-risk measures to improve the solvency of institutional investors. Not much attention has been paid, however, to the optimal investment strategies for downside-risk objectives in a multi-period model. Downside-risk averse investors can be considered as expected utility maximizers with a risk-neutral (linear) utility function above the threshold FT = 1 and a utility function with increasing relative risk aversion (IRRA) below the threshold. The eGect of IRRA below the threshold might be gambling behavior: a decrease of wealth increases the portfolio weight of stocks. Furthermore, risk-neutrality above the threshold should lead to a strong increase in the demand for stocks. Consequently, in a two-asset economy we expect a V-shaped 4gure if we draw the optimal stock weight as a function of fund value Ft. We will now solve the retirement saving model numerically in order to investigate these eGects. Case 3.3: We solve the retirement saving model with downside-risk objective (15) for risk aversion values ' = 16 and 64. In order to distinguish the impact of the investment objective clearly we ignore uncertainty about labor income: the wage growth rate is 4xed at t =3%. We apply the discretized dynamic programming algorithm on a grid consisting of 36 equally spaced fund values F =0–3.5 (step size 0:1). Expectations over the return distributions are approximated with 10,000 simulation points. Fig. 5 shows the optimal initial weight of stocks for risk aversion levels '=16 and 64. The optimal investment strategy has a clear V-shape: at low wealth levels the weight of stocks decreases, while it increases at higher wealth levels. We 4nd equivalent results for other downside-risk measures such as expected shortfall and shortfall probability, which have a similar relative risk aversion function. Given the widespread acceptance of downside-risk measures it is questionable whether investors are fully aware of the accompanying gambling behavior at low wealth levels.
  • 17. A. Berkelaar, R. Kouwenberg / Journal of Economic Dynamics Control 27 (2003) 1069–1097 1083 0.2 0.4 0.6 0.8 1 1.2 1.4 1.6 0 0.2 0.4 0.6 0.8 1 1.2 Fraction Invested in Stocks Wealth-Income Ratio Fig. 5. Stock weight for downside-risk objective. This 4gure shows the fraction invested in stocks at time t = 0 as a function of the wealth–income ratio for risk aversion parameters ' = 16 (solid curve) and ' = 64 (dotted line). Note that the investor cannot dedicate more than 100% to stocks due to a borrowing constraint. 4. Consumption and funding decisions 4.1. The eEect of a -xed funding payment In the previous section we have ignored contribution payments by the plan sponsor, while we focused on optimal investment strategies for the retirement saving model. In this section we study the additional eGect of funding payments. As a 4rst example, we consider the impact of a 4xed non-negative contribution payment. Case 4.1: We solve the retirement saving model with a 4xed contribution rate ct = 0:05 for t = 0; 1; : : : ; T − 1. The utility over fund value at retirement is CRRA (10) with # = −3:5, −2 and −0:5. We ignore uncertainty about labor income in this example: the wage growth rate is 4xed at t =3% annually. The grid of the discretized dynamic programming algorithm consists of 36 equally spaced fund values F = 0–3:5 (step size 0:1) and the return distributions are approximated with 10; 000 simulation points. Fig. 6 displays the optimal investment strategy at time t = 0 for the three levels of risk aversion. Due to the contribution payments, the portfolio weight of stocks is decreasing as a function of fund value for # = −2 and −3:5 and the weight is always
  • 18. 1084 A. Berkelaar, R. Kouwenberg / Journal of Economic Dynamics Control 27 (2003) 1069–1097 0.5 1 1.5 2 2.5 3 3.5 0 0.2 0.4 0.6 0.8 1 1.2 Wealth-Income Ratio Fraction Invested in Stocks Fig. 6. Stock weight for CRRA with 4xed contribution rates. The 4gure shows the stock weight at time t = 0 for power-utility with risk aversion # = −0:5 (dashed line), # = −2 (solid line) and # = −3:5 (dotted line), with a 4xed contribution rate of ct = 0:05 for t = 0; 1; : : : ; T − 1. Due to the 4xed contribution rate the portfolio weight of stocks increases at low levels of fund value (wealth-to-income ratio). at the upper bound for # =−0:5. The plan sponsor appreciates the 4xed payment more at low fund values than at high fund values (i.e. marginal utility of the contribution payment decreases). Poor returns on investments therefore have less impact on utility at low fund levels than at high fund values, which explains the decreasing optimal portfolio weight of stocks for # = −2 and −3:5. 4.2. The eEect of optimal dynamic funding payments We will now study the case where the plan sponsor can change the contribution payments intertemporally. Clearly, the plan sponsor has to make a trade-oG between low contribution payments and high fund values at retirement. Given Assumption 3, we formalize this as a trade-oG between the utility H(ct; t) of contribution rates ct and the utility U(FT ; T) of fund value at retirement. A widely used and intuitively attractive way for modelling preferences over contri- bution payments is to minimize the expected net present value. In our framework this can be speci4ed as H(−ct; t) = −ct=(1 + )t , subject to the 4xed bounds c 6 ct 6 U c. Note, however, that the optimal contribution rate c∗ t for this objective is always at the lower or upper bound: c∗ t = c or c∗ t = U c. Hence, minimizing the net present value of contribution payments will lead to a rather peculiar optimal strategy for setting the contribution rates (called a “bang-bang” strategy).
  • 19. A. Berkelaar, R. Kouwenberg / Journal of Economic Dynamics Control 27 (2003) 1069–1097 1085 0.5 1 1.5 2 2.5 3 3.5 0 0.2 0.4 0.6 0.8 1 1.2 Wealth-Income Ratio Fraction Invested in Stocks Fig. 7. Stock weight with HARA-utility over contribution rates. The 4gure shows the fraction invested in stocks at time t = 0 for power-utility with # = −2 over fund value and HARA-utility over contribution rates with ( = −2:5 (dashed line), −2 (solid line) and −1:5 (dotted line). The weight of stock increases to the upper bound 100% at low levels of fund value, due to the increasing marginal value of the contribution payment. Instead of the net present value rule, we presume that the plan sponsor maxi- mizes a HARA-utility (16) over the contribution rates, as it enforces a positive upper bound U c ¿ 0 on ct: H(−ct; t) = 1 − ( ( −ct + U c (1 − () ( ; −∞ 6 ct ¡ U c; (16) where ( ¡ 1 is the risk aversion coeOcient and U c ¿ 0 is the upper bound of the con- tribution rate. Note that the HARA-utility function H(−ct; t) is increasing and concave in its 4rst argument and moreover it has the property of increasing relative risk aversion (IRRA). We will investigate in Case 4.2 whether this property in:uences the investment strategy. Case 4.2: We solve the retirement saving model with HARA-utility (16) for contribu- tion rates, with risk aversion parameters ( = −1:5,−2 and −2:5 and upper bound U c = 0:1. The utility function over fund value at retirement is CRRA with # = −2. The trade-oG parameter between utility over contribution rates and fund value is = 250; 000. A high value of is required to make sure that contribution rates are positive at low fund values Ft 6 1. This is due to the fact that the utility function H(−ct; t) approaches minus in4nity very fast between 0 and the upper bound U c = 0:1. Fig. 8 displays the optimal contribution rate ct at time t = 0 as a function of initial fund value Ft, for the cases ( = −1:5, −2 and −2:5. The optimal contribution rates
  • 20. 1086 A. Berkelaar, R. Kouwenberg / Journal of Economic Dynamics Control 27 (2003) 1069–1097 0.5 1 1.5 2 2.5 3 3.5 -0.2 -0.1 0 0.1 Wealth-Income Ratio Contribution Rate Fig. 8. Contribution rates with HARA-utility. The 4gure shows the contribution rate at time t = 0 for power-utility with # = −2 over fund value and HARA-utility over contribution rates with ( = −2:5 (dashed line), −2 (solid line) and −1:5 (dotted line). The contribution rates decrease approximately linear as a function of fund value. are decreasing linearly as functions of fund value, while higher risk aversion ( over contribution rates leads to lower rates. Fig. 7 shows the investment strategy at time t = 0 and we 4nd the same decreasing stock weight pattern as in the case of a 4xed contribution rate (see Fig. 6), although more pronounced. Hence, also in the case of an optimal dynamic contribution rule we 4nd that contribution payments lead to increased risk taking at low levels of fund value. 4.3. A lower bound on the funding policy In practice the contribution rate might be constrained by explicit restrictions (see Boender, 1997). The HARA-function (16) naturally imposes an upper bound on the funding payment as marginal utility approaches −∞ near the level U c. We now consider the additional eGect of a lower bound on funding payments (ct ¿ c), which we enforce in the implementation of the discretized dynamic programming algorithm. Case 4.3: We solve the problem of Case 4.2 again, with the addition of a lower bound c = 0 on funding payments (i.e. the plan sponsor cannot extract cash from the fund). The upper bound equals U c = 0:1 and the risk aversion coeOcients of the utility functions H(ct; t) and U(FT ; T) are ( = −2 and # = −2. With an additional lower bound the optimal contribution rate is decreasing linearly as a function of the fund value until it hits the lower bound c = 0 at F0 = 1:5 and from thereon it remains constant. In contrast to this predictable result, the optimal
  • 21. A. Berkelaar, R. Kouwenberg / Journal of Economic Dynamics Control 27 (2003) 1069–1097 1087 0.5 1 1.5 2 2.5 3 3.5 0 0.2 0.4 0.6 0.8 1 1.2 Wealth-Income Ratio Fraction Invested in Stocks Fig. 9. Stock weight for CRRA with a lower bound on funding payments. This 4gure shows the fraction invested in stocks with lower bound c = 0 on contribution rates. The upward part of the smile is due to the lower bound on funding payments, which provide a cushion against losses. investment strategy displayed in Fig. 9 is more surprising. The stock weight 4rst decreases to a minimum around F0 = 1:9 and from this point onwards it starts to rise, up to 100%. The increasing stock weight trend in the right side of the graph can be interpreted as a gambling policy: the potential losses of stocks become less important as the funding payment is stuck at an involuntary ‘high’ level (provid- ing a cushion for possible losses), while the potential gains of stocks remain the same. 4.4. The plan sponsor takes what the plan sponsor gives Another interesting constraint on the funding policy is one induced by a maximum allowable level of the fund value. Suppose that the plan sponsor decides that the value of the retirement fund should never exceed U F times the labor income of the employee, as this fund value is considered suOcient to provide a good retirement income. Consequently, if the fund value Ft exceeds the ‘saturation’ level U F, then the plan sponsor extracts cash from the fund (i.e. ct ¡ 0) in order to reduce the fund value back to U F. Case 4.4: We consider Case 4.2, with the addition of a maximum fund level at U F=2. The risk aversion coeOcients are #=(=−2 and the upper bound for contribution rates is U c = 0:1.
  • 22. 1088 A. Berkelaar, R. Kouwenberg / Journal of Economic Dynamics Control 27 (2003) 1069–1097 0.5 1 1.5 2 2.5 3 3.5 0 0.2 0.4 0.6 0.8 1 1.2 Wealth-Income Ratio Fraction Invested in Stocks Fig. 10. Stock weight for CRRA with an upper bound on fund value. This 4gure shows the fraction invested in stocks with an upper bound U F =2 on fund values, enforced with negative contribution rates (i.e. refunds). Beyond the maximum allowed fund value U F = 2 the stock weight becomes constant at a low level. The optimal funding policy in this case is piecewise linear: at fund values above U F=2 the plan sponsor extract large amounts of cash from the fund. The eGect on the optimal investment strategy is depicted in Fig. 10. For low fund values the optimal stock weight is decreasing and it remains at the minimum of 12% for fund values above U F = 2. As a consequence of the maximum fund level, the plan sponsor drastically reduces stock exposure at wealthy fund values. The gains of investing in stocks at high fund values are reduced by refunds, while the losses of investing in stocks still loom as large as before. According to the optimal investment policy in Fig. 10, plan sponsors that would like to take the excess surplus out of the pension fund in good years should also make a shift to a more conservative investment policy once the optimal wealth target is reached. 5. Horizon eects and intertemporal utility over fund value 5.1. Horizon eEects So far we have displayed the optimal investment and contribution strategy at time t = 0. We now study to what extent the optimal strategies change as the retirement date T approaches. In the case of CRRA over fund value and without contribution payments, the asset weights are constant through time. For DRRA, Fig. 11 shows the
  • 23. A. Berkelaar, R. Kouwenberg / Journal of Economic Dynamics Control 27 (2003) 1069–1097 1089 0.5 1 1.5 2 2.5 3 3.5 0 0.2 0.4 0.6 0.8 1 1.2 Wealth-Income Ratio Fraction Invested in Stocks Fig. 11. Stock weight at time t = 9; 4 and 0 for DRRA utility. The 4gure shows the fraction invested in stocks for diGerent investment horizons, given DRRA utility with parameter values #=−0:5, p=3 and %=3. The dotted line represents the optimal fraction with only 1 year left (t = 9). The dashed line correspond to an intermediate period (t = 4) and the solid line represents the initial portfolio choice (t = 0). optimal investment strategy at times t = 9; 4 and 0 (based on Case 3.1). We 4nd that the weight of stocks increases with the investment horizon for fund levels between F = 0:4 and 2, although the horizon eGect is rather small. In the case of a 4xed contribution rate horizon eGects are even present for a CRRA investor. Fig. 12 shows the optimal stock weight at times t = 9; 4 and 0, for a CRRA objective with a 4xed contribution rate ct = 0:05 for t = 0; 1; : : : ; T − 1 (based on Case 4.1). One period before retirement (t = 9) the investment strategy is still constant, while we observe a drastic increase of the stock weight at low fund values for longer investment horizons (t = 4 and 0). With optimal dynamic contribution rates based on HARA-utility (16), the horizon eGect in the investment strategy is very similar to the 4xed payment case in Fig. 12. Fig. 13 shows the optimal dynamic decision rules for setting contributions at times t = 9; 4 and 0, for a HARA-utility function over contribution rates with ( = −2 and U c=0:1 and a CRRA utility function over fund values. We 4nd that the contribution rates tend to increase as we move closer to the retirement date. 5.2. The eEects of intertemporal utility over fund value Previous results demonstrate that the payment of intertemporal contributions to the retirement fund has a peculiar eGect on the optimal investment strategy: the plan
  • 24. 1090 A. Berkelaar, R. Kouwenberg / Journal of Economic Dynamics Control 27 (2003) 1069–1097 0.5 1 1.5 2 2.5 3 3.5 0 0.2 0.4 0.6 0.8 1 1.2 Wealth-Income Ratio Fraction Invested in Stocks Fig. 12. Stock weight at time t = 9; 4 and 0 for CRRA utility, with a 4xed contribution rate. The 4gure shows the fraction invested in stocks for diGerent investment horizons, given CRRA utility with risk aversion # = −2 and a 4xed contribution rate ct = 0:05 for t = 0; 1; : : : ; T − 1. The dotted line represents the optimal fraction with only one year left (t = 9). The dashed line corresponds to an intermediate period (t = 4) and the solid line represents the initial portfolio choice (t = 0). sponsor increases the weight of stocks as the fund level decreases. Moreover, the gam- bling eGect becomes worse for longer investment horizons. Note that this investment policy might be considered impudent, most notably in the case of a de4ned bene4ts pension scheme. We will now demonstrate that the propensity to gamble can be reduced considerably if the plan sponsor cares about intertemporal fund values Ft at times t = 1; 2; : : : ; T − 1 before the planning horizon T. We 4rst introduce the following objective for the plan sponsor, with intertemporal utility over fund values: max wit ;ct E0 T−1 t=0 H(ct; t) + T t=1 U(Ft; t) : (17) One might argue that it is not rational for the plan sponsor to worry about fund value before the actual retirement date T. Note, however, that many pension funds are monitored by regulatory authorities, in order to keep intertemporal fund values above prespeci4ed values. These regulations are often applied to de4ned bene4ts pen- sion plans, where the plan sponsor has made a promise to pay a certain amount at retirement. In the next case we calculate investment strategies for the objective function above.
  • 25. A. Berkelaar, R. Kouwenberg / Journal of Economic Dynamics Control 27 (2003) 1069–1097 1091 0.5 1 1.5 2 2.5 3 3.5 -0.1 -0.08 -0.06 -0.04 -0.02 0 0.02 0.04 0.06 0.08 0.1 Wealth-Income Ratio Contribution Rate Fig. 13. Contribution rate at time t =9; 4 and 0, with HARA utility over contribution rates. The 4gure shows the contribution rate for diGerent investment horizons, given CRRA utility with risk aversion # = −2 and HARA-utility over contribution rates with ( = −2. The dotted line represents the optimal contribution rate with only one year left (t = 9). The dashed line corresponds to an intermediate period (t = 4) and the solid line represents the initial portfolio choice (t = 0). Case 5.1: We solve the retirement saving model with CRRA utility over fund values, measured intertemporally according to (17), with # = −2. The utility function over contribution rates is HARA (16), with risk aversion parameters ( = −2 and upper bound U c = 0:1. The trade-oG parameter between utility over contribution rates and fund value is = 250; 000. We choose this value for to make sure that contribution rate is positive for funding levels F ¡ 1. Figs. 14 and 15 show the optimal investment and contribution policy. From Fig. 14 it is clear that the optimal weight of stocks is still slightly higher at low fund levels, however, the eGect has reduced considerably and it cannot be considered a gambling strategy anymore. Fig. 15 is also interesting, as it shows that the horizon eGect for the contribution rates has reversed: as the retirement date T gets nearer, the plan sponsor pays less contributions. We conclude that a focus on fund value before the retirement date can greatly reduce the gambling behavior induced by contribution payments. 6. Conclusions In this paper we studied a retirement saving model with labor income as a bench- mark for investments and contribution payments by the plan sponsor. Due to mar- ket incompleteness it is very hard to derive closed-form solutions for the optimal
  • 26. 1092 A. Berkelaar, R. Kouwenberg / Journal of Economic Dynamics Control 27 (2003) 1069–1097 0.5 1 1.5 2 2.5 3 3.5 0 0.2 0.4 0.6 0.8 1 1.2 Wealth-Income Ratio Fraction Invested in Stocks Fig. 14. Stock weight at time t = 9; 4 and 0, with intertemporal utility over fund value. The 4gure shows the fraction invested in stocks for diGerent investment horizons, given intertemporal measurement of CRRA utility over fund values with risk aversion # = −2 and HARA-utility over contribution rates with ( = −2. The dotted line represents the optimal fraction with only one year left (t = 9). The dashed line corresponds to an intermediate period (t = 4) and the solid line represents the initial portfolio choice (t = 0). investment and contribution policies of the plan sponsor. We used an eOcient imple- mentation of the dynamic programming algorithm in order to solve the problem nu- merically. The main conclusions of our analysis and computational experiments are as follows: 1. Regardless of his utility function, the plan sponsor invests in a hedge portfo- lio against random :uctuations of the employee’s labor income. The hedge port- folio depends on the covariance of the asset returns with the wage growth rate. The numerical results demonstrate that the correlation between asset returns and wage growth has a substantial in:uence on portfolio composition. Dynamic adjust- ments of the hedging strategy due to changes of the wage growth rate are relatively small. 2. Contribution payments change the optimal investment strategy considerably, even for a plan sponsor with constant relative risk aversion over fund value. The portfolio weights are no longer constant and there is a strong tendency to gamble at low levels of wealth. We also 4nd that contribution payments lead to a investment horizon eGect. Moreover, additional constraints on the funding policy can have a large impact on the optimal investment strategy. 3. If a plan sponsor maximizes the expected fund value subject to a penalty on downside-risk, then the optimal weight of risky assets in the portfolio increases
  • 27. A. Berkelaar, R. Kouwenberg / Journal of Economic Dynamics Control 27 (2003) 1069–1097 1093 0.5 1 1.5 2 2.5 3 3.5 -0.1 -0.08 -0.06 -0.04 -0.02 0 0.02 0.04 0.06 0.08 0.1 Wealth-Income Ratio Contribution Rate Fig. 15. Contribution rate at time t =9; 4 and 0, with intertemporal utility over fund value. The 4gure shows the optimal contribution rate for diGerent investment horizons, given intertemporal measurement of CRRA utility over fund values with risk aversion # = −2 and HARA-utility over contribution rates with ( = −2. The dotted line represents t = 9, the dashed line corresponds to t = 4 and the solid line represents the initial portfolio choice at t = 0. at low levels of wealth. The gambling policy can be attributed to the increasing relative risk aversion property of the downside-risk measure. 4. Intertemporal measurement of utility over wealth can reduce gambling eGects. The insights gained through the numerical computations in this paper may aid fund- managers to formulate dynamic policies and choose reasonable investment objectives. Furthermore, the decision rules derived here could be applied in simulation-based mod- els for asset–liability management, where additional market imperfections such as trans- action costs and position limits can be taken into account. Appendix A. Implementation of the dynamic programming algorithm We apply Monte-Carlo simulation to calculate expectations over the return distribu- tions in Eq. (7), with an additional variance reduction technique to reduce the approxi- mation error of the simulation method. We employ the method of antithetic sampling to replicate the mean of the underlying asset return distributions. Additionally we rescale the entire sample of returns in order to 4t the variance of the returns exactly. The implementation of the dynamic programming algorithm uses a discretization of the state space, i.e. a grid for the values of Ft and t. Note that each simulated drawing
  • 28. 1094 A. Berkelaar, R. Kouwenberg / Journal of Economic Dynamics Control 27 (2003) 1069–1097 from the distribution of the state variables tends to lie in between the points on the grid at time t + 1. In order to calculate the expectation at time t of the value function at time t + 1 in Eq. (7) we apply interpolation methods. First, we consider the cases without stochastic wage growth. Let n = 0; 1; : : : ; N represent the points on the grid for the fund value F (wealth-to-income ratio), with a 4xed step size of +F between the N +1 points and minimum fund value F. Let J(n; t) denote the value function in point n = 0; 1; : : : ; N on the grid at time t = 0; 1; : : : ; T. Suppose that we are at time t in the dynamic programming algorithm and want to know the value function at F∗ at time t + 1 (in order to approximate the expectation of the value function numerically). Let n∗ denote the point on the grid with fund value closest to F∗ : n∗ = (F∗ − F)=+F . We apply interpolation with points surrounding n∗ , as F∗ tends to lie in between the available fund values F + n+F on the grid for n=0; 1; : : : ; N. Moreover, in some cases F∗ is larger than the maximum fund value on the grid (F∗ ¿ F + N+F ) and then we apply extrapolation. In order to facilitate both interpolation and extrapolation for utility functions with a vertical asymptote, we 4rst transform the value-function: y(n; t) = H(J(n; t)), where H(:) is an invertible transformation function. The goal of the transformation is to get rid of the asymptote at low fund values near F (in order to improve the quality of interpolation) and to get a roughly linear function at high fund values (in order to improve the quality of extrapolation). Note that the utility function U(FT ; T) over fund value at retirement is crucial for the asymptote of the value function and not the utility function over contribution rates H(ct; t). As the plan sponsor controls the contribution rate ct, he will never let the utility function over contribution rates go to minus in4nity at a faster rate than the value function itself (at low levels of wealth F → F). Below is a list of the transformations applied for the cases studied in the paper: 1. Power and DRRA utility over fund values, see the speci4cation in (13): y(n; t) = J(n; t)1=(#−p) for n+F 6 0:5 and y(n; t) = J(n; t)1=# for n+F ¿ 0:5: 2. Expected fund value subject to a downside-risk penalty, see the speci4cation in (15): no transformation required (no vertical asymptote). Before we interpolate or extrapolate the transformed value function we would like to know its shape near F∗ . Therefore, we estimate the scaled second derivative of the transformed value function. Let Qy(n; t + 1) denote a numerical estimate for the 4rst derivative of y(n; t +1) at time t +1 with respect to fund value F, while Q2 y(n; t +1) is a numerical estimate of the second derivative of the transformed value function. 3 3 We use a mid-point formula to calculate numerical estimates for the points n = 2; 3; : : : ; N − 2. For the points on the edge of the grid, n=0; 1 and n=N −1; N, we use a one-sided approximation of the derivatives (see Press et al., 1989).
  • 29. A. Berkelaar, R. Kouwenberg / Journal of Economic Dynamics Control 27 (2003) 1069–1097 1095 The estimate of the scaled second derivative (absolute risk aversion) is z(n; t + 1) = Q2 y(n; t + 1) Qy(n; t + 1) for n = 0; 1; : : : ; N: Depending on the magnitude of the scaled second derivative we choose an interpolation method. Interpolation with a local rational polynomial is a good method for nearly any function, even with an asymptote (see Press et al., 1989), however, it is rather slow. If we know that the value function is locally linear then we rather apply a fast linear interpolation scheme with two points. Moreover, if the value function has an abrupt change in the second derivative due to a ‘break’ (as in the case of downside-risk measures near the threshold) it is safer to apply linear interpolation. We use a decision rule for choosing the interpolation method. Extensive numerical testing of eOciency and reliability resulted in the following speci4cation: 1. Power and DRRA utility over fund values: If F∗ ¿ F + N+F then we apply linear extrapolation with 2 points. If |z(n∗ ; t + 1)| ¿ 4:5 then we apply rational interpolation with 10 points. If 0:5 ¡ |z(n∗ ; t + 1)| 6 4:5 then we apply polynomial interpolation with 4 points. If |z(n∗ ; t + 1)| 6 0:5 then we apply linear interpolation with 2 points. 2. Expected fund value subject to a downside-risk penalty: If F∗ ¿ F + N+F then we apply linear extrapolation with 2 points. If F∗ ¡ 0:9 and |z(n∗ ; t + 1)| ¿ 0:5 then we apply polynomial interpolation with 4 points. In other cases we apply linear interpolation. After applying the interpolation or extrapolation above, we obtain y∗ as an estimate of the transformed value function in the point F∗ . As a last step, we use the inverse transformation H−1 (y∗ )=J∗ , to get the required estimate of the original value function in the point F∗ . Finally, if we additionally consider mean-reverting wage growth rates then the state space grid becomes two-dimensional. In the wage growth dimension we use linear interpolation with two points, as there are no problems with asymptotes or abrupt changes of the value function. We apply the transformation and interpolation methods as described previously in the fund value dimension. In order to 4nd the optimal 4nd the optimal policies that maximize the dynamic pro- gramming Eq. (7), we exploit Powell’s method (Press et al., 1989). The computation- times can be cut drastically by using the optimal policy of a neighboring grid point as initial guess for the optimization method. Note that Powell’s method does not ex- plicitly handle bounds on the decision variables. However, we can still impose lower and upper bounds on the variables by simple transformations with an exponential or arctangent function. Our implementation of the discretized dynamic programming algorithm converges to the optimal solution, given a number of mild continuity assumptions about the utility functions. Convergence in this context means that the numerical approximation of the value function at time t =0 will get arbitrarily close to the actual value function, as the
  • 30. 1096 A. Berkelaar, R. Kouwenberg / Journal of Economic Dynamics Control 27 (2003) 1069–1097 distance between points on the grid becomes smaller. We refer to Bertsekas (1976) for a convergence proof of the discretized dynamic programming algorithm without interpolation schemes. We have tested the convergence of our implementation of the discretized dynamic programming algorithm and found satisfactory results. For example, suppose that the objective function is to maximize power utility (10) with #=−0:5, without contribution payments and ignoring stochastic wage growth. There are two assets: a stock with log-normally distributed returns with mean S=8:6%, standard deviation S=15:7% and a riskless asset with return r =6:8%. We applied the discretized dynamic programming algorithm on a grid consisting of 36 equally spaced fund values F = 0–3:5 (step size 0:1). Expectations over the return distribution are approximated with 10; 000 simulation points. The optimal stock weight found by the algorithm is 82.6% for all 36 levels of the funding level, and in all 10 periods. The standard deviation of the 360 stock weights is 0:0014%, and the diGerence between the minimum and the maximum is only 0:0107%. Hence, the variation in the weights is negligible, and we 4nd a constant stock weight as predicted by theory. As a comparison, we also maximized a one-period version of the same problem in Excel, using a discretized log-normal distribution consisting of a 1000 points: the optimal stock weight found by the Excel solver was also 82.6%. References Balduzzi, P., Lynch, A., 1999. Transaction costs and predictability: some utility cost calculations. Journal of Financial Economics 52, 47–78. Barberis, N., 2000. Investing for the long run when returns are predictable. Journal of Finance 55, 225–264. Bawa, V.S., Lindenberg, E.B., 1977. Capital market equilibrium in a mean-lower partial moment framework. Journal of Financial Economics 5, 189–200. Bellman, R., 1957. Dynamic Programming. Princeton University Press, Princeton, NJ. Bertsekas, D.P., 1976. Dynamic Programming and Stochastic Control. Academic Press, New York. Boender, G.C.E., 1997. A hybrid simulation=optimisation scenario model for asset=liability management. European Journal of Operational Research 99, 126–135. Brennan, M.J., Schwartz, E.S., Lagnado, R., 1997. Strategic asset allocation. Journal of Economic Dynamics and Control 21, 1377–1403. Haberman, S., Sung, J.-H., 1994. Dynamic approaches to pension funding. Insurance: Mathematics and Economics 15, 151–162. Hakansson, N.H., 1969. Optimal investment and consumption strategies under risk, an uncertain lifetime and insurance. International Economic Review 10, 443–466. Koo, H.K., 1999. Consumption and portfolio selection with labor income: a discrete-time approach. Mathematical Methods of Operations Research 50, 219–243. Kouwenberg, R., 2001. Scenario generation and stochastic programming models for asset–liability management. European Journal of Operational Research 134, 279–292. Leibowitz, M.L., Kogelman, S., Bader, L.N., 1994. Funding ratio return. Journal of Portfolio Management (Fall), 39–47. Merton, R.C., 1971. Optimum consumption and portfolio rules in a continuous-time model. Journal of Economic Theory 3, 373–413. Mossin, J., 1968. Optimal multiperiod portfolio policies. Journal of Business 41, 215–229. Mulvey, J.M., Ziemba, W.T., 1998. Asset and liability management systems for long-term investors: discussion of the issues. In: Mulvey, J.M., Ziemba, W.T. (Eds.), Worldwide Asset and Liability Modelling. Cambridge University Press, Cambridge, pp. 3–38.
  • 31. A. Berkelaar, R. Kouwenberg / Journal of Economic Dynamics Control 27 (2003) 1069–1097 1097 O’Brien, T., 1987. A two-parameter family of pension contribution functions and stochastic optimization. Insurance: Mathematics and Economics 6, 129–134. Press, W., Flannery, B., Teukolsky, S., Vetterling, W., 1989. Numerical Recipes: The Art of Scienti4c Computing. Cambridge University Press, Cambridge. Samuelson, P.A., 1969. Lifetime portfolio selection by dynamic stochastic programming. Review of Economics and Statistics 51, 239–246. Sharpe, W.F., Tint, L.G., 1990. Liabilities—a new approach. Journal of Portfolio Management (Winter), 5–10. Zenios, S.A., 1999. High-performance computing in 4nance: the last ten years and the next. Parallel Computing 25, 2149–2175.